Races in Chanhassen, Minnesota (MN) Detailed Stats
Data:
Races - White alone (%)
Races - White alone (% change since 2000)
Races - Black alone (%)
Races - Black alone (% change since 2000)
Races - American Indian alone (%)
Races - American Indian alone (% change since 2000)
Races - Asian alone (%)
Races - Asian alone (% change since 2000)
Races - Hispanic (%)
Races - Hispanic (% change since 2000)
Races - Native Hawaiian and Other Pacific Islander alone (%)
Races - Native Hawaiian and Other Pacific Islander alone (% change since 2000)
Races - Two or more races(%)
Races - Two or more races(% change since 2000)
Races - Other race alone (%)
Races - Other race alone (% change since 2000)
Racial diversity
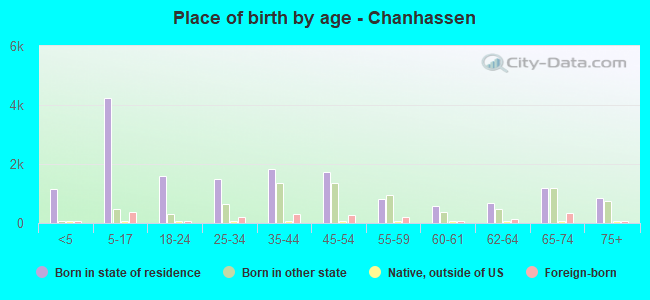
Place of birth - Born in state of residence (%)
Place of birth - Born in state of residence (%) - White
Place of birth - Born in state of residence (%) - Black or African American
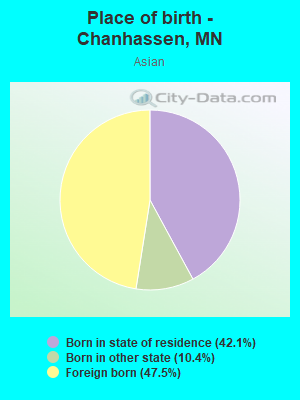
Place of birth - Born in state of residence (%) - Asian
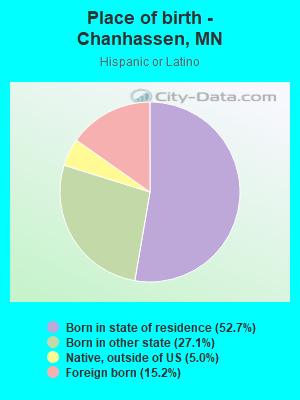
Place of birth - Born in state of residence (%) - Hispanic or Latino
Place of birth - Born in state of residence (%) - American Indian and Alaska Native
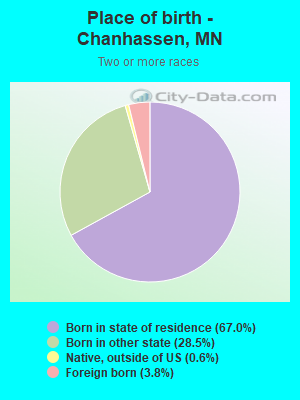
Place of birth - Born in state of residence (%) - Multirace
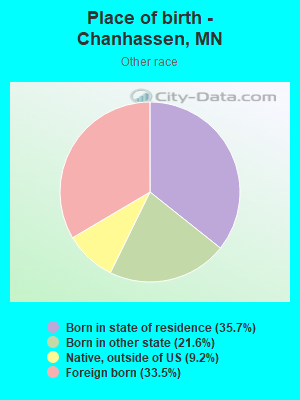
Place of birth - Born in state of residence (%) - Other Race
Place of birth - Born in other state (%)
Place of birth - Born in other state (%) - White
Place of birth - Born in other state (%) - Black or African American
Place of birth - Born in other state (%) - Asian
Place of birth - Born in other state (%) - Hispanic or Latino
Place of birth - Born in other state (%) - American Indian and Alaska Native
Place of birth - Born in other state (%) - Multirace
Place of birth - Born in other state (%) - Other Race
Place of birth - Native, outside of US (%)
Place of birth - Native, outside of US (%) - White
Place of birth - Native, outside of US (%) - Black or African American
Place of birth - Native, outside of US (%) - Asian
Place of birth - Native, outside of US (%) - Hispanic or Latino
Place of birth - Native, outside of US (%) - American Indian and Alaska Native
Place of birth - Native, outside of US (%) - Multirace
Place of birth - Native, outside of US (%) - Other Race
Place of birth - Foreign born (%)
Place of birth - Foreign born (%) - White
Place of birth - Foreign born (%) - Black or African American
Place of birth - Foreign born (%) - Asian
Place of birth - Foreign born (%) - Hispanic or Latino
Place of birth - Foreign born (%) - American Indian and Alaska Native
Place of birth - Foreign born (%) - Multirace
Place of birth - Foreign born (%) - Other Race
Residents speaking English at home (%)
Residents speaking English at home - Born in the United States (%)
Residents speaking English at home - Native, born elsewhere (%)
Residents speaking English at home - Foreign born (%)
Residents speaking Spanish at home (%)
Residents speaking Spanish at home - Born in the United States (%)
Residents speaking Spanish at home - Native, born elsewhere (%)
Residents speaking Spanish at home - Foreign born (%)
Residents speaking other language at home (%)
Residents speaking other language at home - Born in the United States (%)
Residents speaking other language at home - Native, born elsewhere (%)
Residents speaking other language at home - Foreign born (%)
Marital status - Never married (%)
Marital status - Now married (%)
Marital status - Separated (%)
Marital status - Widowed (%)
Marital status - Divorced (%)
Ancestries Reported - Arab (%)
Ancestries Reported - Czech (%)
Ancestries Reported - Danish (%)
Ancestries Reported - Dutch (%)
Ancestries Reported - English (%)
Ancestries Reported - French (%)
Ancestries Reported - French Canadian (%)
Ancestries Reported - German (%)
Ancestries Reported - Greek (%)
Ancestries Reported - Hungarian (%)
Ancestries Reported - Irish (%)
Ancestries Reported - Italian (%)
Ancestries Reported - Lithuanian (%)
Ancestries Reported - Norwegian (%)
Ancestries Reported - Polish (%)
Ancestries Reported - Portuguese (%)
Ancestries Reported - Russian (%)
Ancestries Reported - Scotch-Irish (%)
Ancestries Reported - Scottish (%)
Ancestries Reported - Slovak (%)
Ancestries Reported - Subsaharan African (%)
Ancestries Reported - Swedish (%)
Ancestries Reported - Swiss (%)
Ancestries Reported - Ukrainian (%)
Ancestries Reported - United States (%)
Ancestries Reported - Welsh (%)
Ancestries Reported - West Indian (%)
Ancestries Reported - Other (%)
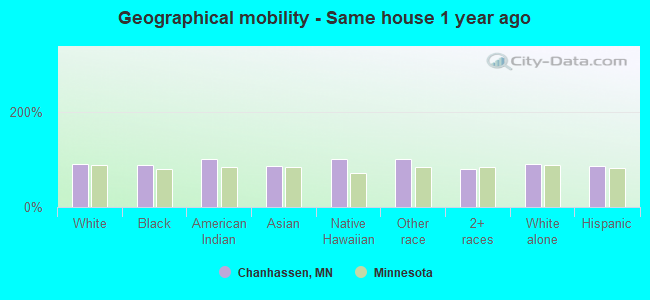
Geographical mobility - Same house 1 year ago (%)
Geographical mobility - Same house 1 year ago (%) - White
Geographical mobility - Same house 1 year ago (%) - Black or African American
Geographical mobility - Same house 1 year ago (%) - Asian
Geographical mobility - Same house 1 year ago (%) - Hispanic or Latino
Geographical mobility - Same house 1 year ago (%) - American Indian and Alaska Native
Geographical mobility - Same house 1 year ago (%) - Multirace
Geographical mobility - Same house 1 year ago (%) - Other Race
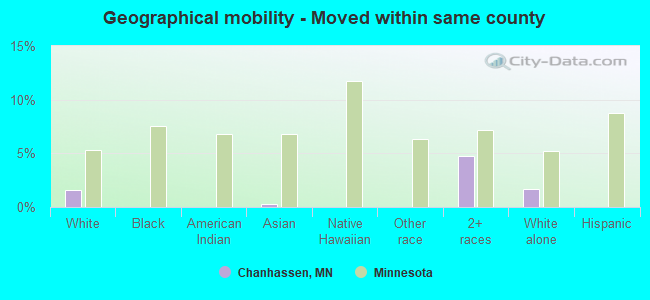
Geographical mobility - Moved within same county (%)
Geographical mobility - Moved within same county (%) - White
Geographical mobility - Moved within same county (%) - Black or African American
Geographical mobility - Moved within same county (%) - Asian
Geographical mobility - Moved within same county (%) - Hispanic or Latino
Geographical mobility - Moved within same county (%) - American Indian and Alaska Native
Geographical mobility - Moved within same county (%) - Multirace
Geographical mobility - Moved within same county (%) - Other Race
Geographical mobility - Moved from different county within same state (%)
Geographical mobility - Moved from different county within same state (%) - White
Geographical mobility - Moved from different county within same state (%) - Black or African American
Geographical mobility - Moved from different county within same state (%) - Asian
Geographical mobility - Moved from different county within same state (%) - Hispanic or Latino
Geographical mobility - Moved from different county within same state (%) - American Indian and Alaska Native
Geographical mobility - Moved from different county within same state (%) - Multirace
Geographical mobility - Moved from different county within same state (%) - Other Race
Geographical mobility - Moved from different state (%)
Geographical mobility - Moved from different state (%) - White
Geographical mobility - Moved from different state (%) - Black or African American
Geographical mobility - Moved from different state (%) - Asian
Geographical mobility - Moved from different state (%) - Hispanic or Latino
Geographical mobility - Moved from different state (%) - American Indian and Alaska Native
Geographical mobility - Moved from different state (%) - Multirace
Geographical mobility - Moved from different state (%) - Other Race
Geographical mobility - Moved from abroad (%)
Geographical mobility - Moved from abroad (%) - White
Geographical mobility - Moved from abroad (%) - Black or African American
Geographical mobility - Moved from abroad (%) - Asian
Geographical mobility - Moved from abroad (%) - Hispanic or Latino
Geographical mobility - Moved from abroad (%) - American Indian and Alaska Native
Geographical mobility - Moved from abroad (%) - Multirace
Geographical mobility - Moved from abroad (%) - Other Race
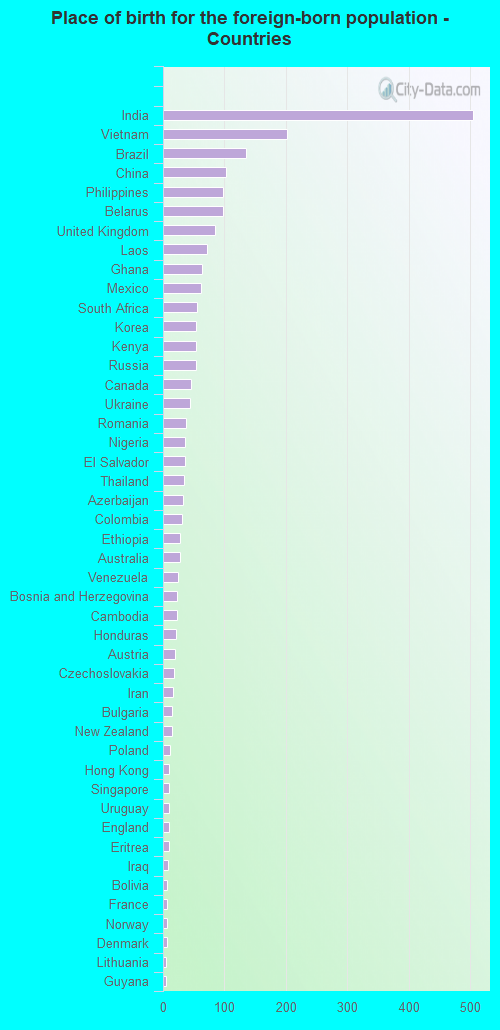
Place of birth for the foreign-born population - Ireland (%)
Place of birth for the foreign-born population - Denmark (%)
Place of birth for the foreign-born population - Norway (%)
Place of birth for the foreign-born population - Sweden (%)
Place of birth for the foreign-born population - United Kingdom (%)
Place of birth for the foreign-born population - England (%)
Place of birth for the foreign-born population - Scotland (%)
Place of birth for the foreign-born population - Other Northern Europe (%)
Place of birth for the foreign-born population - Austria (%)
Place of birth for the foreign-born population - Belgium (%)
Place of birth for the foreign-born population - France (%)
Place of birth for the foreign-born population - Germany (%)
Place of birth for the foreign-born population - Netherlands (%)
Place of birth for the foreign-born population - Switzerland (%)
Place of birth for the foreign-born population - Other Western Europe (%)
Place of birth for the foreign-born population - Greece (%)
Place of birth for the foreign-born population - Italy (%)
Place of birth for the foreign-born population - Portugal (%)
Place of birth for the foreign-born population - Spain (%)
Place of birth for the foreign-born population - Other Southern Europe (%)
Place of birth for the foreign-born population - Albania (%)
Place of birth for the foreign-born population - Belarus (%)
Place of birth for the foreign-born population - Bosnia and Herzegovina (%)
Place of birth for the foreign-born population - Bulgaria (%)
Place of birth for the foreign-born population - Croatia (%)
Place of birth for the foreign-born population - Czechoslovakia (%)
Place of birth for the foreign-born population - Hungary (%)
Place of birth for the foreign-born population - Latvia (%)
Place of birth for the foreign-born population - Lithuania (%)
Place of birth for the foreign-born population - North Macedonia (Macedonia) (%)
Place of birth for the foreign-born population - Moldova (%)
Place of birth for the foreign-born population - Poland (%)
Place of birth for the foreign-born population - Romania (%)
Place of birth for the foreign-born population - Russia (%)
Place of birth for the foreign-born population - Serbia (%)
Place of birth for the foreign-born population - Ukraine (%)
Place of birth for the foreign-born population - Other Eastern Europe (%)
Place of birth for the foreign-born population - China (%)
Place of birth for the foreign-born population - Hong Kong (%)
Place of birth for the foreign-born population - Taiwan (%)
Place of birth for the foreign-born population - Japan (%)
Place of birth for the foreign-born population - Korea (%)
Place of birth for the foreign-born population - Other Eastern Asia (%)
Place of birth for the foreign-born population - Afghanistan (%)
Place of birth for the foreign-born population - Bangladesh (%)
Place of birth for the foreign-born population - India (%)
Place of birth for the foreign-born population - Iran (%)
Place of birth for the foreign-born population - Kazakhstan (%)
Place of birth for the foreign-born population - Nepal (%)
Place of birth for the foreign-born population - Pakistan (%)
Place of birth for the foreign-born population - Sri Lanka (%)
Place of birth for the foreign-born population - Uzbekistan (%)
Place of birth for the foreign-born population - Other South Central Asia (%)
Place of birth for the foreign-born population - Burma (%)
Place of birth for the foreign-born population - Cambodia (%)
Place of birth for the foreign-born population - Indonesia (%)
Place of birth for the foreign-born population - Laos (%)
Place of birth for the foreign-born population - Malaysia (%)
Place of birth for the foreign-born population - Philippines (%)
Place of birth for the foreign-born population - Singapore (%)
Place of birth for the foreign-born population - Thailand (%)
Place of birth for the foreign-born population - Vietnam (%)
Place of birth for the foreign-born population - Other South Eastern Asia (%)
Place of birth for the foreign-born population - Armenia (%)
Place of birth for the foreign-born population - Iraq (%)
Place of birth for the foreign-born population - Israel (%)
Place of birth for the foreign-born population - Jordan (%)
Place of birth for the foreign-born population - Kuwait (%)
Place of birth for the foreign-born population - Lebanon (%)
Place of birth for the foreign-born population - Saudi Arabia (%)
Place of birth for the foreign-born population - Syria (%)
Place of birth for the foreign-born population - Turkey (%)
Place of birth for the foreign-born population - Yemen (%)
Place of birth for the foreign-born population - Other Western Asia (%)
Place of birth for the foreign-born population - Eritrea (%)
Place of birth for the foreign-born population - Ethiopia (%)
Place of birth for the foreign-born population - Kenya (%)
Place of birth for the foreign-born population - Somalia (%)
Place of birth for the foreign-born population - Uganda (%)
Place of birth for the foreign-born population - Zimbabwe (%)
Place of birth for the foreign-born population - Other Eastern Africa (%)
Place of birth for the foreign-born population - Cameroon (%)
Place of birth for the foreign-born population - Congo (%)
Place of birth for the foreign-born population - Democratic Republic of Congo (Zaire) (%)
Place of birth for the foreign-born population - Other Middle Africa (%)
Place of birth for the foreign-born population - Egypt (%)
Place of birth for the foreign-born population - Morocco (%)
Place of birth for the foreign-born population - Sudan (%)
Place of birth for the foreign-born population - Other Northern Africa (%)
Place of birth for the foreign-born population - South Africa (%)
Place of birth for the foreign-born population - Other Southern Africa (%)
Place of birth for the foreign-born population - Cabo Verde (%)
Place of birth for the foreign-born population - Ghana (%)
Place of birth for the foreign-born population - Liberia (%)
Place of birth for the foreign-born population - Nigeria (%)
Place of birth for the foreign-born population - Senegal (%)
Place of birth for the foreign-born population - Sierra Leone (%)
Place of birth for the foreign-born population - Other Western Africa (%)
Place of birth for the foreign-born population - Australia (%)
Place of birth for the foreign-born population - New Zealand (%)
Place of birth for the foreign-born population - Fiji (%)
Place of birth for the foreign-born population - Micronesia (%)
Place of birth for the foreign-born population - Bahamas (%)
Place of birth for the foreign-born population - Barbados (%)
Place of birth for the foreign-born population - Cuba (%)
Place of birth for the foreign-born population - Dominica (%)
Place of birth for the foreign-born population - Dominican Republic (%)
Place of birth for the foreign-born population - Grenada (%)
Place of birth for the foreign-born population - Haiti (%)
Place of birth for the foreign-born population - Jamaica (%)
Place of birth for the foreign-born population - St. Vincent and the Grenadines (%)
Place of birth for the foreign-born population - Trinidad and Tobago (%)
Place of birth for the foreign-born population - West Indies (%)
Place of birth for the foreign-born population - Other Caribbean (%)
Place of birth for the foreign-born population - Belize (%)
Place of birth for the foreign-born population - Costa Rica (%)
Place of birth for the foreign-born population - El Salvador (%)
Place of birth for the foreign-born population - Guatemala (%)
Place of birth for the foreign-born population - Honduras (%)
Place of birth for the foreign-born population - Mexico (%)
Place of birth for the foreign-born population - Nicaragua (%)
Place of birth for the foreign-born population - Panama (%)
Place of birth for the foreign-born population - Other Central America (%)
Place of birth for the foreign-born population - Argentina (%)
Place of birth for the foreign-born population - Bolivia (%)
Place of birth for the foreign-born population - Brazil (%)
Place of birth for the foreign-born population - Chile (%)
Place of birth for the foreign-born population - Colombia (%)
Place of birth for the foreign-born population - Ecuador (%)
Place of birth for the foreign-born population - Guyana (%)
Place of birth for the foreign-born population - Peru (%)
Place of birth for the foreign-born population - Uruguay (%)
Place of birth for the foreign-born population - Venezuela (%)
Place of birth for the foreign-born population - Other South America (%)
Place of birth for the foreign-born population - Canada (%)
Place of birth for the foreign-born population - Other Northern America (%)
Place of birth for the foreign-born population - Other (%)
Latest news about races in Chanhassen, MN collected exclusively by city-data.com from local newspapers, TV, and radio stations
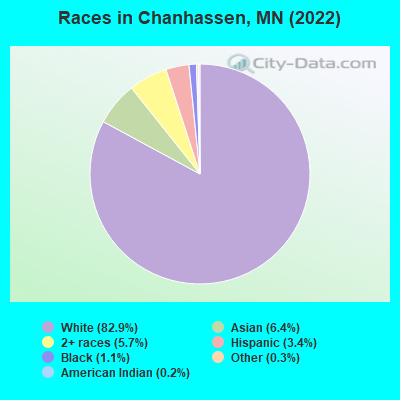
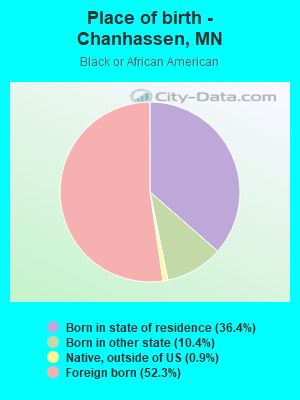
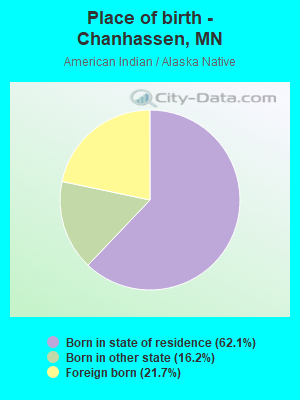
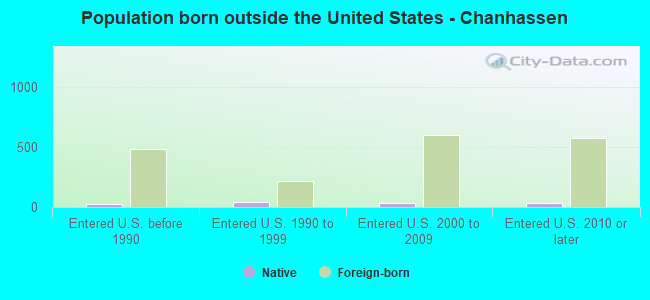
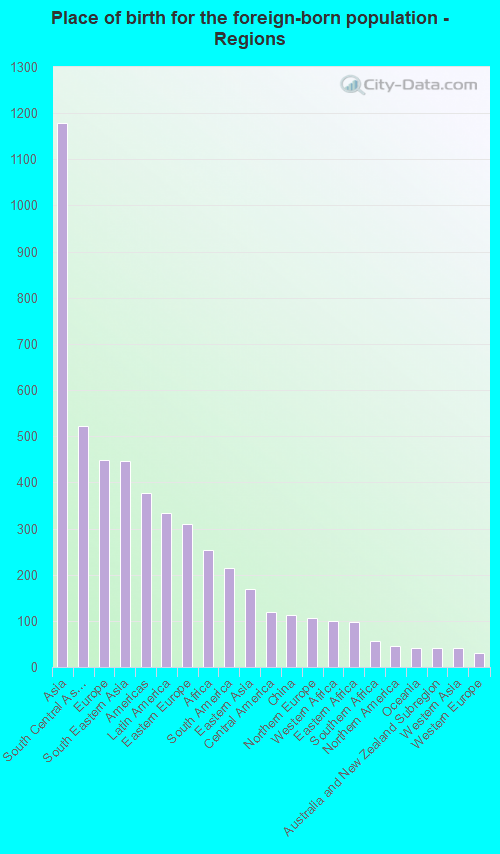
According to 2022 data, the most numerous races in Chanhassen, MN are White alone (22,000 residents), Black alone (305 residents), and Hispanic (912 residents). 89.7% of Chanhassen residents speak English at home. 8.7% of Chanhassen, MN residents are foreign-born (4.4% born in Asia, 1.7% born in Europe, 1.2% born in Latin America, 0.9% born in Africa), which is 7.8% greater than the foreign-born rate of 8.0% across the entire state of Minnesota.
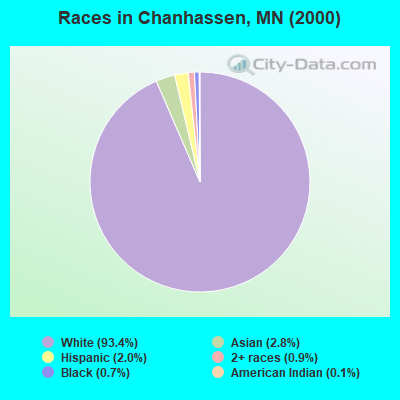
Race distribution in Chanhassen
2000 2022
4,337,143 88.2% White alone 168,813 3.4% Black alone 143,382 2.9% Hispanic 141,083 2.9% Asian alone 70,304 1.4% Two or more races 52,009 1.1% American Indian alone 5,031 0.1% Other race alone 1,714 0.03% Native Hawaiian and Other
4,356,347 76.2% White alone 395,179 6.9% Black alone 333,830 5.8% Hispanic 294,800 5.2% Asian alone 259,649 4.5% Two or more races 42,125 0.7% American Indian alone 32,976 0.6% Other race alone 2,278 0.04% Native Hawaiian and Other
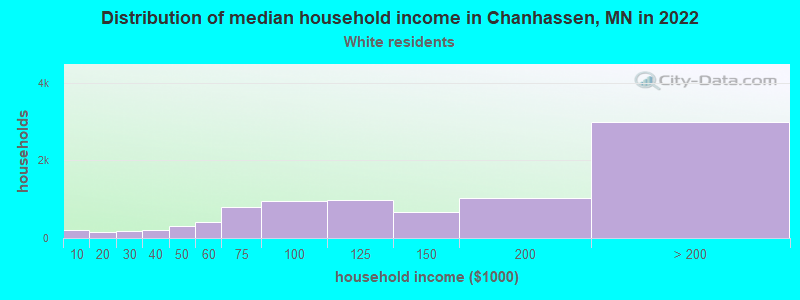
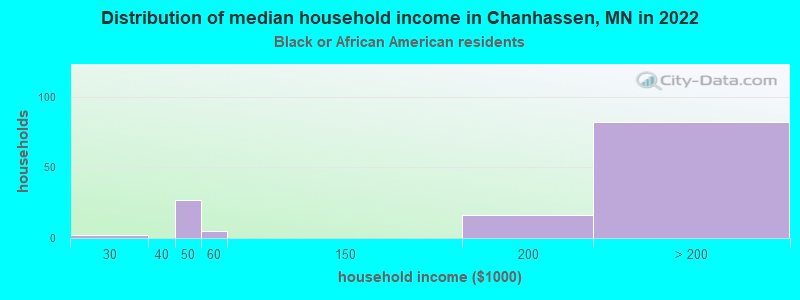
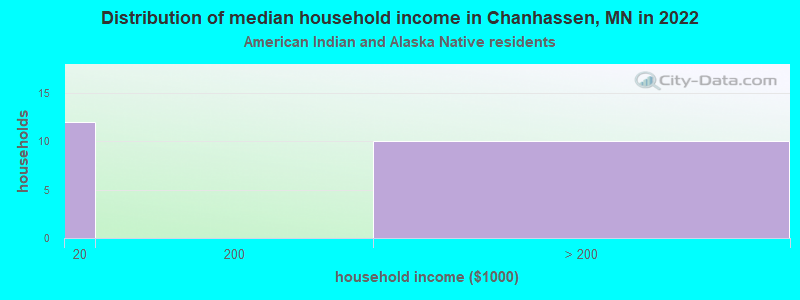
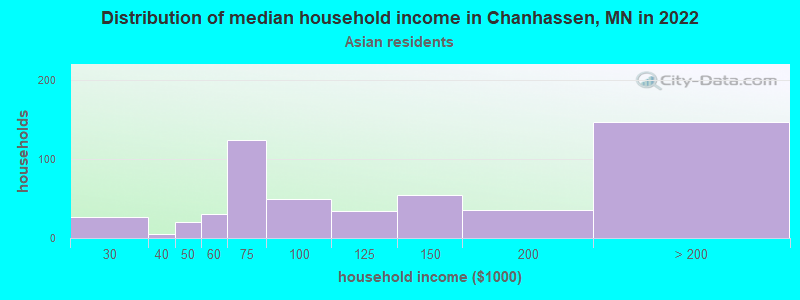
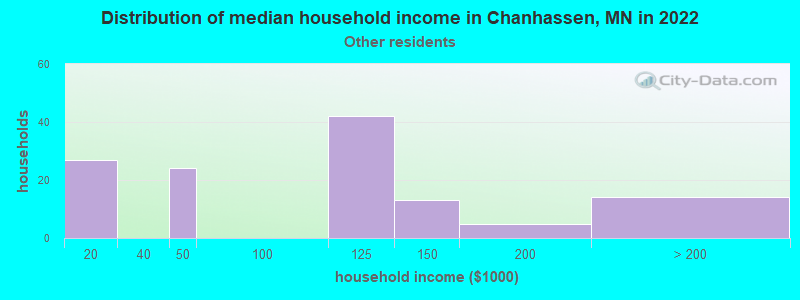
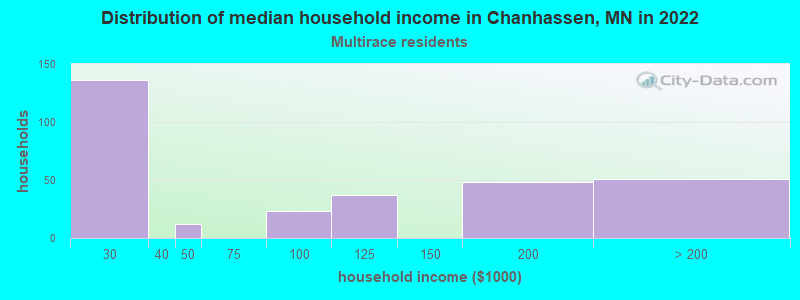
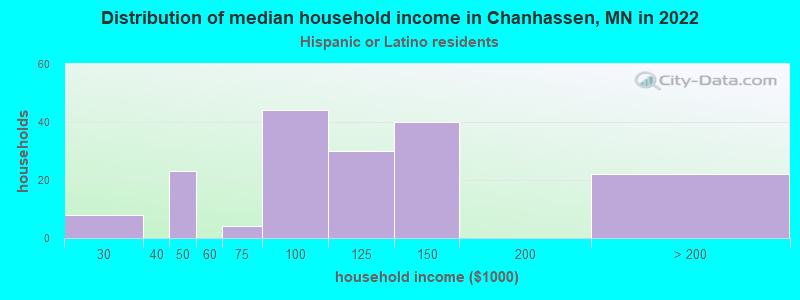
Income and house value in Chanhassen Median household income in 2022 $133,282 White non-Hispanic householdersover $200,000 Black householders$95,433 Asian householders$103,898 Some other race householders$173,356 Hispanic or Latino race householdersMedian 2022 house value $505,344 White Non-Hispanic householders$660,188 Black or African American householders$108,030 American Indian or Alaska Native householders $634,021 Asian householders$409,316 Two or more races householders$357,222 Hispanic or Latino householders
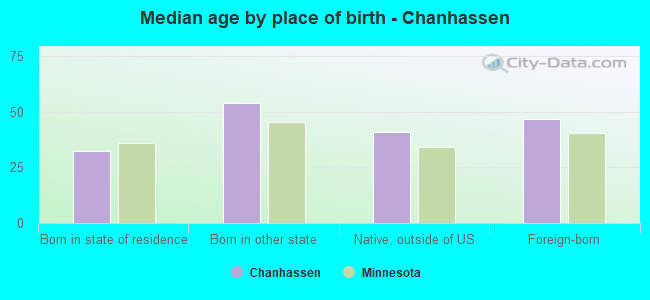
Median age by race in Chanhassen
44.2 Median age for White residents41.8 46.7 59.4 Median age for Black or African American residents61.9 68.5 16.8 Median age for American Indian / Alaska Native residents18.0 18.2 34.1 Median age for Asian residents31.2 35.5 -744,336,568.8 Median age for Native Hawaiian / Pacific Islander residents-666,666,666.0 -666,666,666.0 27.6 Median age for Other race residents32.9 19.7 13.3 Median age for Two or more races residents16.2 12.5 44.0 Median age for White alone residents41.7 46.4 20.6 Median age for Hispanic or Latino residents17.1 22.3
Owner/renter occupied households by race in Chanhassen
House owners and renters - White residents 7,769 87.8% Owner occupied1,075 12.2% Renter occupiedHouse owners and renters - Black or African American residents 55 43.8% Owner occupied71 56.2% Renter occupiedHouse owners and renters - American Indian / Alaska Native residents 21 100.0% Owner occupiedHouse owners and renters - Asian residents 532 99.6% Owner occupied2 0.4% Renter occupiedHouse owners and renters - Other race residents 40 44.5% Owner occupied50 55.5% Renter occupiedHouse owners and renters - Two or more races residents 185 45.2% Owner occupied224 54.8% Renter occupiedHouse owners and renters - White alone residents 7,655 87.8% Owner occupied1,065 12.2% Renter occupiedHouse owners and renters - Hispanic or Latino residents 129 60.6% Owner occupied84 39.4% Renter occupied
Language usage in Chanhassen
English speakers - Total 89.7% of residents of Chanhassen speak English at home.
1.4% of residents speak Spanish at home 302 83.2% Speak English very well61 16.8% Speak English less than very well9.2% of residents speak other language at home 1,649 70.8% Speak English very well681 29.2% Speak English less than very well
English speakers - Born in the United States 93.9% of residents of Chanhassen speak English at home.
1.4% of residents speak Spanish at home 98 89.9% Speak English very well11 10.1% Speak English less than very well7.3% of residents speak other language at home 581 100.0% Speak English very well
English speakers - Native, born elsewhere 92.4% of residents of Chanhassen speak English at home.
13.3% of residents speak Spanish at home 21 100.0% Speak English very well1.9% of residents speak other language at home 3 100.0% Speak English very well
English speakers - Foreign-born 27.8% of residents of Chanhassen speak English at home.
4.9% of residents speak Spanish at home 80 85.1% Speak English very well14 14.9% Speak English less than very well72.2% of residents speak other language at home 884 64.4% Speak English very well488 35.6% Speak English less than very well
White (Caucasian) - Speak only English Native:
99.1% (20,346)Foreign-born:
42.8% (323)
White (Caucasian) - Speak another language Native:
1.0% (214)Foreign-born:
57.2% (432)
Black or African American - Speak another language Native:
58.8% (42)Foreign-born:
100.0% (202)
American Indian / Alaska Native - Speak only English Native:
100.0% (84)Foreign-born:
27.2% (6)
Asian - Speak only English Native:
41.1% (437)Foreign-born:
26.2% (180)
Asian - Speak another language Native:
59.8% (636)Foreign-born:
89.7% (616)
Other race - Speak another language Native:
20.5% (46)Foreign-born:
43.7% (44)
Two or more races - Speak only English Native:
80.0% (1,202)Foreign-born:
20.7% (33)
Two or more races - Speak another language Native:
19.6% (295)Foreign-born:
78.8% (127)
White alone - Speak only English Native:
98.8% (20,139)Foreign-born:
41.5% (336)
White alone - Speak another language Native:
1.3% (255)Foreign-born:
59.3% (480)
Hispanic or Latino - Speak only English Native:
94.3% (776)Foreign-born:
16.7% (22)
Hispanic or Latino - Speak another language Native:
12.0% (99)Foreign-born:
53.8% (71)
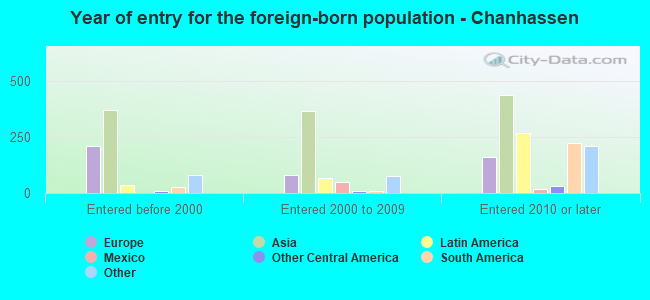
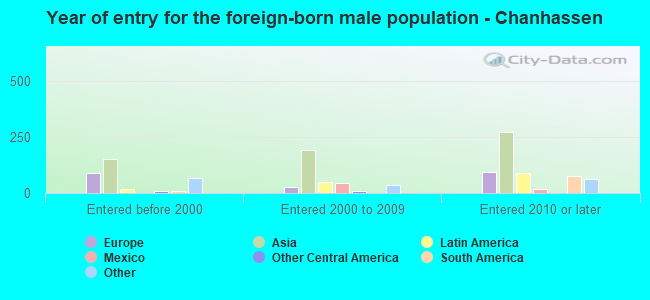
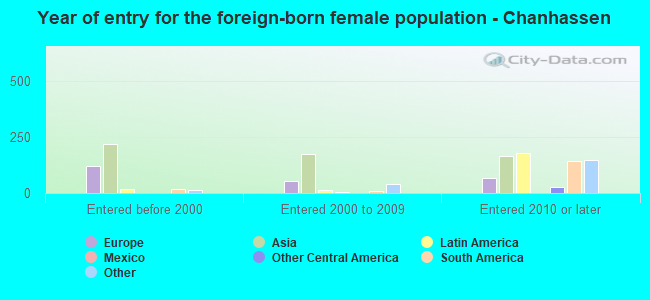
Foreign-born residents in Chanhassen 2,303 residents are foreign born (4.4% Asia , 1.7% Europe , 1.2% Latin America , 0.9% Africa ).
This city:
8.7%Minnesota:
8.5%
Marital status for residents in Chanhassen Marital status - White (Caucasian) population 15 years and over
Males 26.2% Never married63.9% Now married0.4% Separated1.3% Widowed8.3% DivorcedFemales 20.7% Never married59.1% Now married0.3% Separated6.0% Widowed13.9% DivorcedWomen who gave birth in the past 12 months Now married:
95.7% (130)Unmarried:
4.3% (6)
Women who did not give birth in the past 12 months Now married:
49.9% (2,121)Unmarried:
50.1% (2,130)
Marital status - Black or African American population 15 years and over
Males 12.7% Never married53.5% Now married0.0% Separated2.8% Widowed31.0% DivorcedFemales 31.8% Never married45.5% Now married0.0% Separated18.2% Widowed4.5% DivorcedWomen who gave birth in the past 12 months Now married:
100.0% (34)Unmarried:
0.0% (0)
Women who did not give birth in the past 12 months Now married:
0.0% (0)Unmarried:
100.0% (36)
Marital status - American Indian / Alaska Native population 15 years and over
Males 53.1% Never married46.9% Now married0.0% Separated0.0% Widowed0.0% DivorcedFemales 51.6% Never married32.8% Now married0.0% Separated0.0% Widowed15.6% DivorcedWomen who did not give birth in the past 12 months Now married:
17.5% (7)Unmarried:
82.5% (34)
Marital status - Asian population 15 years and over
Males 30.5% Never married59.3% Now married0.9% Separated0.0% Widowed9.3% DivorcedFemales 22.9% Never married61.2% Now married0.0% Separated0.0% Widowed15.9% DivorcedWomen who did not give birth in the past 12 months Now married:
60.3% (284)Unmarried:
39.7% (187)
Marital status - Other race population 15 years and over
Males 13.1% Never married60.6% Now married0.0% Separated17.2% Widowed9.1% DivorcedFemales 28.9% Never married17.8% Now married0.0% Separated6.7% Widowed46.7% DivorcedWomen who did not give birth in the past 12 months Now married:
12.8% (7)Unmarried:
87.2% (45)
Marital status - Two or more races population 15 years and over
Males 51.7% Never married43.8% Now married0.0% Separated0.0% Widowed4.5% DivorcedFemales 66.0% Never married27.5% Now married0.0% Separated0.0% Widowed6.5% DivorcedWomen who gave birth in the past 12 months Now married:
100.0% (25)Unmarried:
0.0% (0)
Women who did not give birth in the past 12 months Now married:
13.5% (39)Unmarried:
86.5% (250)
Marital status - White alone, not Hispanic / Latino population 15 years and over
Males 26.1% Never married63.9% Now married0.4% Separated1.3% Widowed8.3% DivorcedFemales 20.4% Never married59.3% Now married0.2% Separated6.1% Widowed14.0% DivorcedWomen who gave birth in the past 12 months Now married:
95.7% (133)Unmarried:
4.3% (6)
Women who did not give birth in the past 12 months Now married:
49.8% (2,111)Unmarried:
50.2% (2,130)
Marital status - Hispanic or Latino population 15 years and over
Males 41.2% Never married58.8% Now married0.0% Separated0.0% Widowed0.0% DivorcedFemales 47.8% Never married33.6% Now married4.9% Separated0.0% Widowed13.7% DivorcedWomen who did not give birth in the past 12 months Now married:
34.5% (76)Unmarried:
65.5% (144)
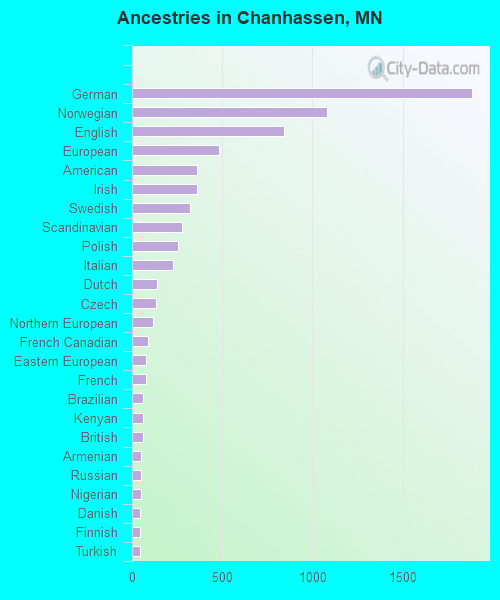
Ancestries in Chanhassen
1,884 19.0% German1,080 10.9% Norwegian842 8.5% English482 4.9% European358 3.6% American358 3.6% Irish321 3.2% Swedish277 2.8% Scandinavian253 2.6% Polish225 2.3% Italian139 1.4% Dutch131 1.3% Czech118 1.2% Northern European86 0.9% French Canadian77 0.8% Eastern European77 0.8% French63 0.6% Brazilian60 0.6% Kenyan60 0.6% British52 0.5% Armenian51 0.5% Russian50 0.5% Nigerian46 0.5% Danish45 0.5% Finnish42 0.4% Turkish40 0.4% Ukrainian37 0.4% Ghanaian29 0.3% African26 0.3% Swiss24 0.2% Austrian24 0.2% Scotch-Irish23 0.2% Iranian22 0.2% Romanian21 0.2% Scottish20 0.2% Greek16 0.2% Hungarian16 0.2% Bulgarian13 0.1% Luxembourger13 0.1% South African12 0.1% Canadian9 0.09% Portuguese9 0.09% Lithuanian9 0.09% Latvian8 0.08% Czechoslovakian6 0.06% Slovene5 0.05% Israeli4 0.04% Welsh
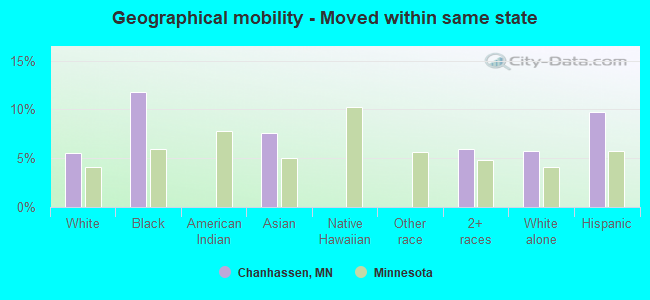
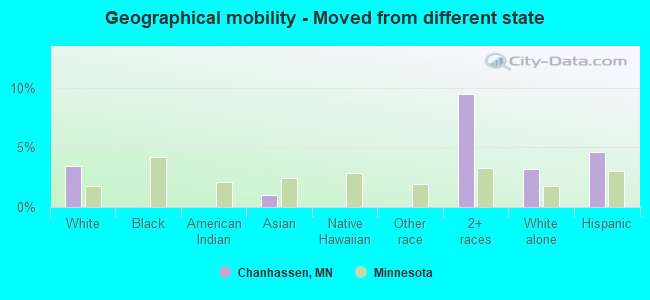
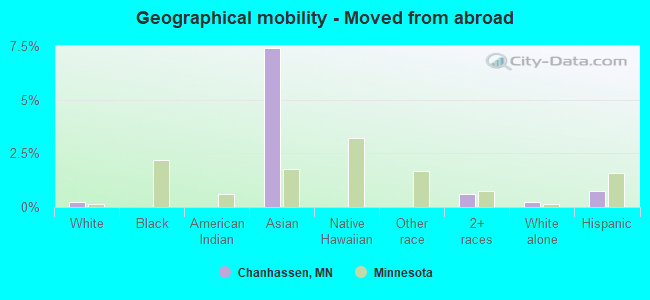
Geographical mobility in Chanhassen Same house 1 year ago 19,849 89.9% White (Caucasian)302 87.1% Black or African American103 100.0% American Indian / Alaska Native1,509 85.0% Asian9 100.0% Native Hawaiian / Pacific Islander255 100.0% Other race1,449 80.3% Two or more races19,664 89.6% White alone, not Hispanic / Latino735 84.5% Hispanic or LatinoMoved within same county 343 1.6% White / Caucasian4 0.3% Asian86 4.8% Two or more races371 1.7% White alone, not Hispanic / LatinoMoved within same state 1,212 5.5% White / Caucasian41 11.8% Black or African American135 7.6% Asian108 6.0% Two or more races1,256 5.7% White alone, not Hispanic / Latino84 9.7% Hispanic or LatinoMoved from different state 760 3.4% White / Caucasian17 1.0% Asian171 9.5% Two or more races701 3.2% White alone, not Hispanic / Latino40 4.6% Hispanic or LatinoMoved from abroad 53 0.2% White132 7.4% Asian11 0.6% Two or more races54 0.2% White alone, not Hispanic / Latino6 0.7% Hispanic or Latino
Children Nativity (place of birth) in Chanhassen
Children under 6 years - Living with two parents Both parents native 1,079 98.7% Native14 1.3% Foreign-bornBoth parents foreign-born 189 100.0% NativeOne native, one foreign-born parent 60 100.0% NativeChildren under 6 years - Living with one parent Native parent 376 100.0% NativeForeign-born parent 25 100.0% NativeChildren 6 to 17 years - Living with two parents Both parents native 3,139 98.6% Native43 1.4% Foreign-bornBoth parents foreign-born 249 57.4% Native184 42.6% Foreign-bornOne native, one foreign-born parent 280 100.0% NativeChildren 6 to 17 years - Living with one parent Native parent 746 100.0% NativeForeign-born parent 61 50.4% Native60 49.6% Foreign-born
Grandparents responsible for own grandchildren in Chanhassen
Grandparents (30 to 59 years) White / Caucasian 8 100.0% Not responsible for grandchildrenOther race 2 100.0% Not responsible for grandchildrenHispanic or Latino 8 100.0% Not responsible for grandchildren
Grandparents (60 years and over) White / Caucasian 64 100.0% Not responsible for grandchildren