Races in Charleston, West Virginia (WV) Detailed Stats
Data:
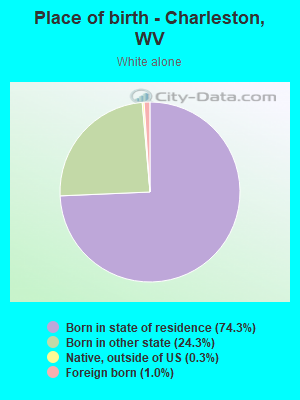
Races - White alone (%)
Races - White alone (% change since 2000)
Races - Black alone (%)
Races - Black alone (% change since 2000)
Races - American Indian alone (%)
Races - American Indian alone (% change since 2000)
Races - Asian alone (%)
Races - Asian alone (% change since 2000)
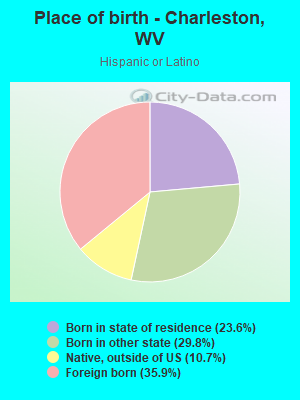
Races - Hispanic (%)
Races - Hispanic (% change since 2000)
Races - Native Hawaiian and Other Pacific Islander alone (%)
Races - Native Hawaiian and Other Pacific Islander alone (% change since 2000)
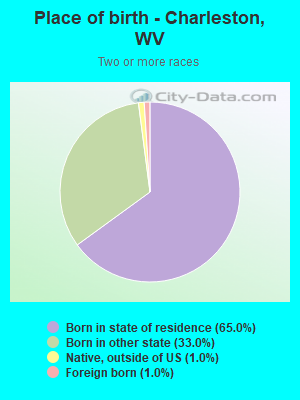
Races - Two or more races(%)
Races - Two or more races(% change since 2000)
Races - Other race alone (%)
Races - Other race alone (% change since 2000)
Racial diversity
Place of birth - Born in state of residence (%)
Place of birth - Born in state of residence (%) - White
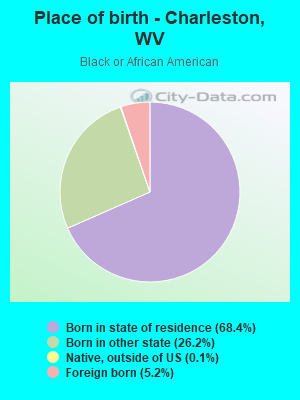
Place of birth - Born in state of residence (%) - Black or African American
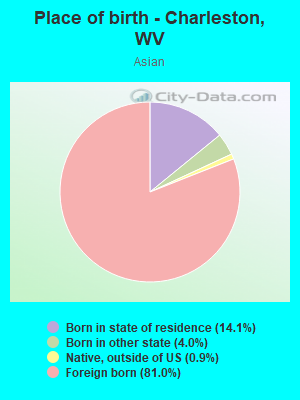
Place of birth - Born in state of residence (%) - Asian
Place of birth - Born in state of residence (%) - Hispanic or Latino
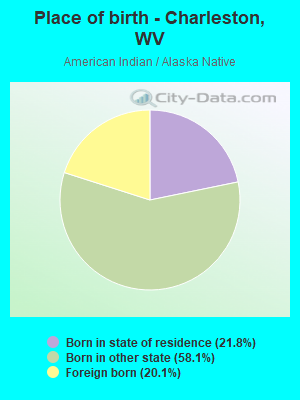
Place of birth - Born in state of residence (%) - American Indian and Alaska Native
Place of birth - Born in state of residence (%) - Multirace
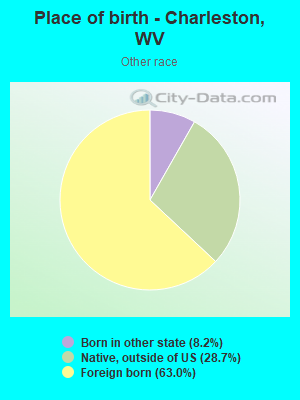
Place of birth - Born in state of residence (%) - Other Race
Place of birth - Born in other state (%)
Place of birth - Born in other state (%) - White
Place of birth - Born in other state (%) - Black or African American
Place of birth - Born in other state (%) - Asian
Place of birth - Born in other state (%) - Hispanic or Latino
Place of birth - Born in other state (%) - American Indian and Alaska Native
Place of birth - Born in other state (%) - Multirace
Place of birth - Born in other state (%) - Other Race
Place of birth - Native, outside of US (%)
Place of birth - Native, outside of US (%) - White
Place of birth - Native, outside of US (%) - Black or African American
Place of birth - Native, outside of US (%) - Asian
Place of birth - Native, outside of US (%) - Hispanic or Latino
Place of birth - Native, outside of US (%) - American Indian and Alaska Native
Place of birth - Native, outside of US (%) - Multirace
Place of birth - Native, outside of US (%) - Other Race
Place of birth - Foreign born (%)
Place of birth - Foreign born (%) - White
Place of birth - Foreign born (%) - Black or African American
Place of birth - Foreign born (%) - Asian
Place of birth - Foreign born (%) - Hispanic or Latino
Place of birth - Foreign born (%) - American Indian and Alaska Native
Place of birth - Foreign born (%) - Multirace
Place of birth - Foreign born (%) - Other Race
Residents speaking English at home (%)
Residents speaking English at home - Born in the United States (%)
Residents speaking English at home - Native, born elsewhere (%)
Residents speaking English at home - Foreign born (%)
Residents speaking Spanish at home (%)
Residents speaking Spanish at home - Born in the United States (%)
Residents speaking Spanish at home - Native, born elsewhere (%)
Residents speaking Spanish at home - Foreign born (%)
Residents speaking other language at home (%)
Residents speaking other language at home - Born in the United States (%)
Residents speaking other language at home - Native, born elsewhere (%)
Residents speaking other language at home - Foreign born (%)
Marital status - Never married (%)
Marital status - Now married (%)
Marital status - Separated (%)
Marital status - Widowed (%)
Marital status - Divorced (%)
Ancestries Reported - Arab (%)
Ancestries Reported - Czech (%)
Ancestries Reported - Danish (%)
Ancestries Reported - Dutch (%)
Ancestries Reported - English (%)
Ancestries Reported - French (%)
Ancestries Reported - French Canadian (%)
Ancestries Reported - German (%)
Ancestries Reported - Greek (%)
Ancestries Reported - Hungarian (%)
Ancestries Reported - Irish (%)
Ancestries Reported - Italian (%)
Ancestries Reported - Lithuanian (%)
Ancestries Reported - Norwegian (%)
Ancestries Reported - Polish (%)
Ancestries Reported - Portuguese (%)
Ancestries Reported - Russian (%)
Ancestries Reported - Scotch-Irish (%)
Ancestries Reported - Scottish (%)
Ancestries Reported - Slovak (%)
Ancestries Reported - Subsaharan African (%)
Ancestries Reported - Swedish (%)
Ancestries Reported - Swiss (%)
Ancestries Reported - Ukrainian (%)
Ancestries Reported - United States (%)
Ancestries Reported - Welsh (%)
Ancestries Reported - West Indian (%)
Ancestries Reported - Other (%)
Geographical mobility - Same house 1 year ago (%)
Geographical mobility - Same house 1 year ago (%) - White
Geographical mobility - Same house 1 year ago (%) - Black or African American
Geographical mobility - Same house 1 year ago (%) - Asian
Geographical mobility - Same house 1 year ago (%) - Hispanic or Latino
Geographical mobility - Same house 1 year ago (%) - American Indian and Alaska Native
Geographical mobility - Same house 1 year ago (%) - Multirace
Geographical mobility - Same house 1 year ago (%) - Other Race
Geographical mobility - Moved within same county (%)
Geographical mobility - Moved within same county (%) - White
Geographical mobility - Moved within same county (%) - Black or African American
Geographical mobility - Moved within same county (%) - Asian
Geographical mobility - Moved within same county (%) - Hispanic or Latino
Geographical mobility - Moved within same county (%) - American Indian and Alaska Native
Geographical mobility - Moved within same county (%) - Multirace
Geographical mobility - Moved within same county (%) - Other Race
Geographical mobility - Moved from different county within same state (%)
Geographical mobility - Moved from different county within same state (%) - White
Geographical mobility - Moved from different county within same state (%) - Black or African American
Geographical mobility - Moved from different county within same state (%) - Asian
Geographical mobility - Moved from different county within same state (%) - Hispanic or Latino
Geographical mobility - Moved from different county within same state (%) - American Indian and Alaska Native
Geographical mobility - Moved from different county within same state (%) - Multirace
Geographical mobility - Moved from different county within same state (%) - Other Race
Geographical mobility - Moved from different state (%)
Geographical mobility - Moved from different state (%) - White
Geographical mobility - Moved from different state (%) - Black or African American
Geographical mobility - Moved from different state (%) - Asian
Geographical mobility - Moved from different state (%) - Hispanic or Latino
Geographical mobility - Moved from different state (%) - American Indian and Alaska Native
Geographical mobility - Moved from different state (%) - Multirace
Geographical mobility - Moved from different state (%) - Other Race
Geographical mobility - Moved from abroad (%)
Geographical mobility - Moved from abroad (%) - White
Geographical mobility - Moved from abroad (%) - Black or African American
Geographical mobility - Moved from abroad (%) - Asian
Geographical mobility - Moved from abroad (%) - Hispanic or Latino
Geographical mobility - Moved from abroad (%) - American Indian and Alaska Native
Geographical mobility - Moved from abroad (%) - Multirace
Geographical mobility - Moved from abroad (%) - Other Race
Place of birth for the foreign-born population - Ireland (%)
Place of birth for the foreign-born population - Denmark (%)
Place of birth for the foreign-born population - Norway (%)
Place of birth for the foreign-born population - Sweden (%)
Place of birth for the foreign-born population - United Kingdom (%)
Place of birth for the foreign-born population - England (%)
Place of birth for the foreign-born population - Scotland (%)
Place of birth for the foreign-born population - Other Northern Europe (%)
Place of birth for the foreign-born population - Austria (%)
Place of birth for the foreign-born population - Belgium (%)
Place of birth for the foreign-born population - France (%)
Place of birth for the foreign-born population - Germany (%)
Place of birth for the foreign-born population - Netherlands (%)
Place of birth for the foreign-born population - Switzerland (%)
Place of birth for the foreign-born population - Other Western Europe (%)
Place of birth for the foreign-born population - Greece (%)
Place of birth for the foreign-born population - Italy (%)
Place of birth for the foreign-born population - Portugal (%)
Place of birth for the foreign-born population - Spain (%)
Place of birth for the foreign-born population - Other Southern Europe (%)
Place of birth for the foreign-born population - Albania (%)
Place of birth for the foreign-born population - Belarus (%)
Place of birth for the foreign-born population - Bosnia and Herzegovina (%)
Place of birth for the foreign-born population - Bulgaria (%)
Place of birth for the foreign-born population - Croatia (%)
Place of birth for the foreign-born population - Czechoslovakia (%)
Place of birth for the foreign-born population - Hungary (%)
Place of birth for the foreign-born population - Latvia (%)
Place of birth for the foreign-born population - Lithuania (%)
Place of birth for the foreign-born population - North Macedonia (Macedonia) (%)
Place of birth for the foreign-born population - Moldova (%)
Place of birth for the foreign-born population - Poland (%)
Place of birth for the foreign-born population - Romania (%)
Place of birth for the foreign-born population - Russia (%)
Place of birth for the foreign-born population - Serbia (%)
Place of birth for the foreign-born population - Ukraine (%)
Place of birth for the foreign-born population - Other Eastern Europe (%)
Place of birth for the foreign-born population - China (%)
Place of birth for the foreign-born population - Hong Kong (%)
Place of birth for the foreign-born population - Taiwan (%)
Place of birth for the foreign-born population - Japan (%)
Place of birth for the foreign-born population - Korea (%)
Place of birth for the foreign-born population - Other Eastern Asia (%)
Place of birth for the foreign-born population - Afghanistan (%)
Place of birth for the foreign-born population - Bangladesh (%)
Place of birth for the foreign-born population - India (%)
Place of birth for the foreign-born population - Iran (%)
Place of birth for the foreign-born population - Kazakhstan (%)
Place of birth for the foreign-born population - Nepal (%)
Place of birth for the foreign-born population - Pakistan (%)
Place of birth for the foreign-born population - Sri Lanka (%)
Place of birth for the foreign-born population - Uzbekistan (%)
Place of birth for the foreign-born population - Other South Central Asia (%)
Place of birth for the foreign-born population - Burma (%)
Place of birth for the foreign-born population - Cambodia (%)
Place of birth for the foreign-born population - Indonesia (%)
Place of birth for the foreign-born population - Laos (%)
Place of birth for the foreign-born population - Malaysia (%)
Place of birth for the foreign-born population - Philippines (%)
Place of birth for the foreign-born population - Singapore (%)
Place of birth for the foreign-born population - Thailand (%)
Place of birth for the foreign-born population - Vietnam (%)
Place of birth for the foreign-born population - Other South Eastern Asia (%)
Place of birth for the foreign-born population - Armenia (%)
Place of birth for the foreign-born population - Iraq (%)
Place of birth for the foreign-born population - Israel (%)
Place of birth for the foreign-born population - Jordan (%)
Place of birth for the foreign-born population - Kuwait (%)
Place of birth for the foreign-born population - Lebanon (%)
Place of birth for the foreign-born population - Saudi Arabia (%)
Place of birth for the foreign-born population - Syria (%)
Place of birth for the foreign-born population - Turkey (%)
Place of birth for the foreign-born population - Yemen (%)
Place of birth for the foreign-born population - Other Western Asia (%)
Place of birth for the foreign-born population - Eritrea (%)
Place of birth for the foreign-born population - Ethiopia (%)
Place of birth for the foreign-born population - Kenya (%)
Place of birth for the foreign-born population - Somalia (%)
Place of birth for the foreign-born population - Uganda (%)
Place of birth for the foreign-born population - Zimbabwe (%)
Place of birth for the foreign-born population - Other Eastern Africa (%)
Place of birth for the foreign-born population - Cameroon (%)
Place of birth for the foreign-born population - Congo (%)
Place of birth for the foreign-born population - Democratic Republic of Congo (Zaire) (%)
Place of birth for the foreign-born population - Other Middle Africa (%)
Place of birth for the foreign-born population - Egypt (%)
Place of birth for the foreign-born population - Morocco (%)
Place of birth for the foreign-born population - Sudan (%)
Place of birth for the foreign-born population - Other Northern Africa (%)
Place of birth for the foreign-born population - South Africa (%)
Place of birth for the foreign-born population - Other Southern Africa (%)
Place of birth for the foreign-born population - Cabo Verde (%)
Place of birth for the foreign-born population - Ghana (%)
Place of birth for the foreign-born population - Liberia (%)
Place of birth for the foreign-born population - Nigeria (%)
Place of birth for the foreign-born population - Senegal (%)
Place of birth for the foreign-born population - Sierra Leone (%)
Place of birth for the foreign-born population - Other Western Africa (%)
Place of birth for the foreign-born population - Australia (%)
Place of birth for the foreign-born population - New Zealand (%)
Place of birth for the foreign-born population - Fiji (%)
Place of birth for the foreign-born population - Micronesia (%)
Place of birth for the foreign-born population - Bahamas (%)
Place of birth for the foreign-born population - Barbados (%)
Place of birth for the foreign-born population - Cuba (%)
Place of birth for the foreign-born population - Dominica (%)
Place of birth for the foreign-born population - Dominican Republic (%)
Place of birth for the foreign-born population - Grenada (%)
Place of birth for the foreign-born population - Haiti (%)
Place of birth for the foreign-born population - Jamaica (%)
Place of birth for the foreign-born population - St. Vincent and the Grenadines (%)
Place of birth for the foreign-born population - Trinidad and Tobago (%)
Place of birth for the foreign-born population - West Indies (%)
Place of birth for the foreign-born population - Other Caribbean (%)
Place of birth for the foreign-born population - Belize (%)
Place of birth for the foreign-born population - Costa Rica (%)
Place of birth for the foreign-born population - El Salvador (%)
Place of birth for the foreign-born population - Guatemala (%)
Place of birth for the foreign-born population - Honduras (%)
Place of birth for the foreign-born population - Mexico (%)
Place of birth for the foreign-born population - Nicaragua (%)
Place of birth for the foreign-born population - Panama (%)
Place of birth for the foreign-born population - Other Central America (%)
Place of birth for the foreign-born population - Argentina (%)
Place of birth for the foreign-born population - Bolivia (%)
Place of birth for the foreign-born population - Brazil (%)
Place of birth for the foreign-born population - Chile (%)
Place of birth for the foreign-born population - Colombia (%)
Place of birth for the foreign-born population - Ecuador (%)
Place of birth for the foreign-born population - Guyana (%)
Place of birth for the foreign-born population - Peru (%)
Place of birth for the foreign-born population - Uruguay (%)
Place of birth for the foreign-born population - Venezuela (%)
Place of birth for the foreign-born population - Other South America (%)
Place of birth for the foreign-born population - Canada (%)
Place of birth for the foreign-born population - Other Northern America (%)
Place of birth for the foreign-born population - Other (%)
Latest news about races in Charleston, WV collected exclusively by city-data.com from local newspapers, TV, and radio stations
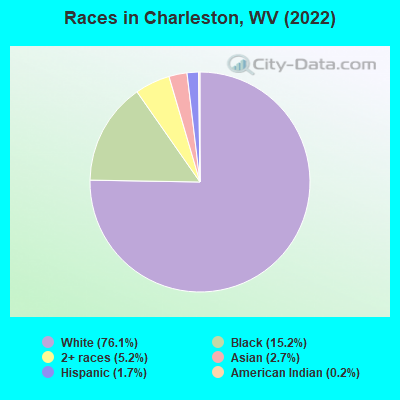
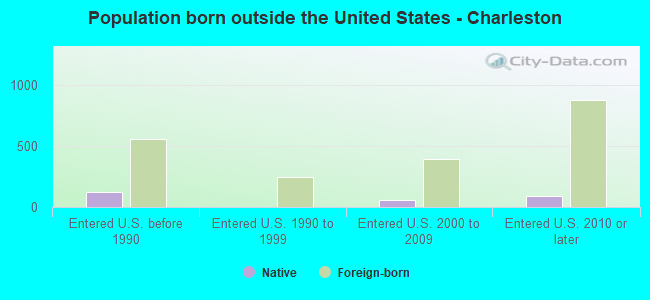
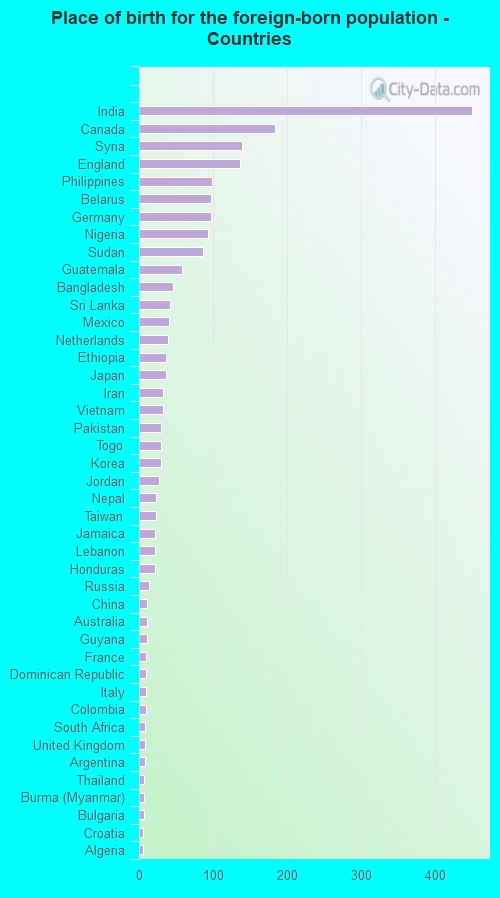
According to 2022 data, the most numerous races in Charleston, WV are White alone (35,939 residents), Two or more races (2,467 residents), and Black alone (7,166 residents). 95.1% of Charleston residents speak English at home. 4.6% of Charleston, WV residents are foreign-born (2.2% born in Asia, 0.9% born in Europe, 0.5% born in Africa), which is 78.1% greater than the foreign-born rate of 1.0% across the entire state of West Virginia.
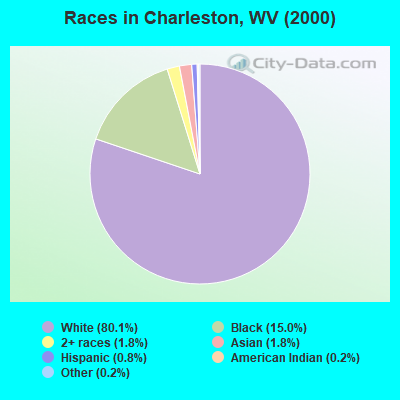
Race distribution in Charleston
2000 2022
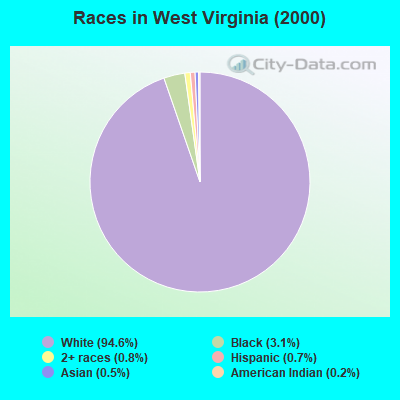
1,709,966 94.6% White alone 56,825 3.1% Black alone 14,983 0.8% Two or more races 12,279 0.7% Hispanic 9,356 0.5% Asian alone 3,456 0.2% American Indian alone 1,144 0.06% Other race alone 335 0.02% Native Hawaiian and Other
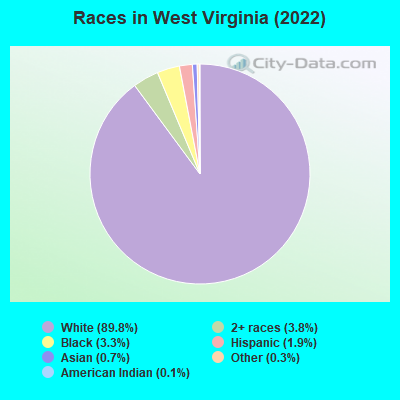
1,594,128 89.8% White alone 66,932 3.8% Two or more races 59,390 3.3% Black alone 34,343 1.9% Hispanic 13,134 0.7% Asian alone 5,238 0.3% Other race alone 1,880 0.1% American Indian alone 111 0.01% Native Hawaiian and Other
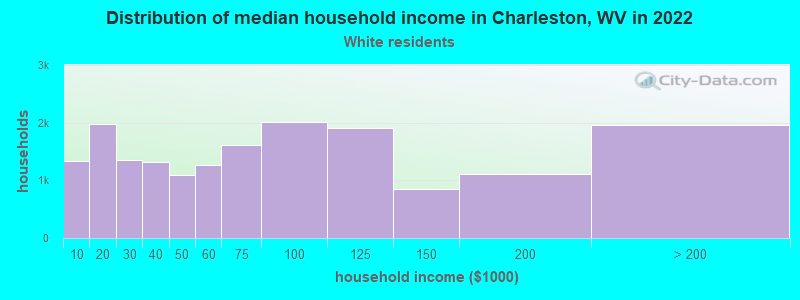
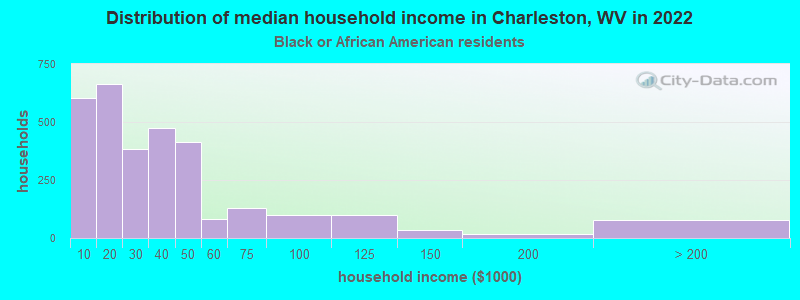
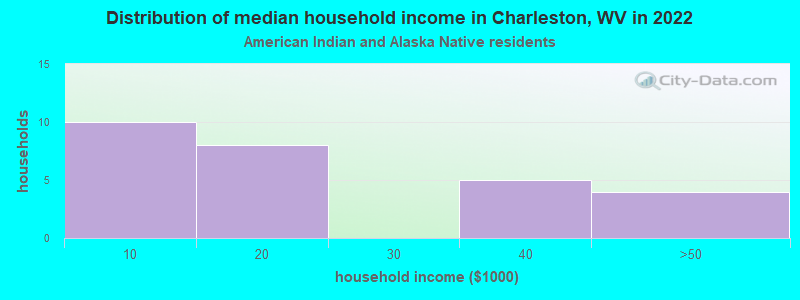
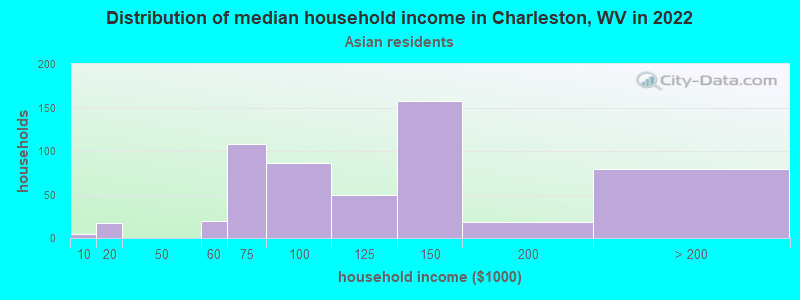
Income and house value in Charleston Median household income in 2022 $66,362 White non-Hispanic householders$28,719 Black householders$129,452 Asian householders$60,295 Two or more races householders$58,337 Hispanic or Latino race householdersMedian 2022 house value $187,315 White Non-Hispanic householders$104,280 Black or African American householders$184,483 American Indian or Alaska Native householders $413,404 Asian householders$364,008 Some other race householders$121,277 Two or more races householders$156,332 Hispanic or Latino householders
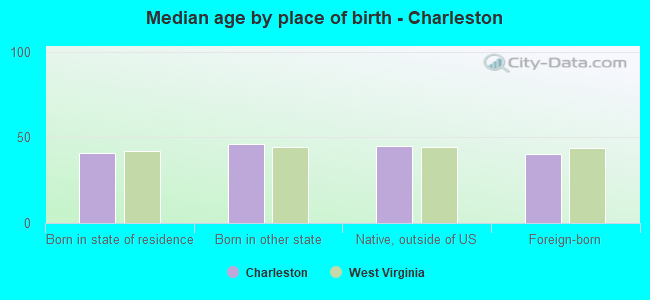
Median age by race in Charleston
45.5 Median age for White residents43.6 47.5 35.5 Median age for Black or African American residents34.8 31.1 57.7 Median age for American Indian / Alaska Native residents72.9 62.8 44.1 Median age for Asian residents42.8 51.1 -827,078,733.5 Median age for Native Hawaiian / Pacific Islander residents-666,666,666.0 -670,599,802.7 28.2 Median age for Other race residents24.5 -712,172,923.1 21.9 Median age for Two or more races residents17.0 25.1 45.5 Median age for White alone residents43.6 47.7 28.9 Median age for Hispanic or Latino residents21.6 40.3
Owner/renter occupied households by race in Charleston
House owners and renters - White residents 11,128 62.0% Owner occupied6,816 38.0% Renter occupiedHouse owners and renters - Black or African American residents 836 27.8% Owner occupied2,172 72.2% Renter occupiedHouse owners and renters - American Indian / Alaska Native residents 7 22.3% Owner occupied25 77.7% Renter occupiedHouse owners and renters - Asian residents 456 80.5% Owner occupied111 19.5% Renter occupiedHouse owners and renters - Other race residents 6 36.6% Owner occupied10 63.4% Renter occupiedHouse owners and renters - Two or more races residents 437 48.6% Owner occupied462 51.4% Renter occupiedHouse owners and renters - White alone residents 11,127 62.3% Owner occupied6,729 37.7% Renter occupiedHouse owners and renters - Hispanic or Latino residents 58 35.6% Owner occupied105 64.4% Renter occupied
Language usage in Charleston
English speakers - Total 95.1% of residents of Charleston speak English at home.
1.3% of residents speak Spanish at home 258 45.0% Speak English very well315 55.0% Speak English less than very well3.7% of residents speak other language at home 1,256 76.0% Speak English very well396 24.0% Speak English less than very well
English speakers - Born in the United States 98.8% of residents of Charleston speak English at home.
1.2% of residents speak Spanish at home 132 96.4% Speak English very well5 3.6% Speak English less than very well0.7% of residents speak other language at home 72 87.8% Speak English very well10 12.2% Speak English less than very well
English speakers - Native, born elsewhere 57.1% of residents of Charleston speak English at home.
58.4% of residents speak Spanish at home 100 75.8% Speak English very well32 24.2% Speak English less than very well
English speakers - Foreign-born 26.9% of residents of Charleston speak English at home.
5.3% of residents speak Spanish at home 20 17.9% Speak English very well92 82.1% Speak English less than very well63.5% of residents speak other language at home 992 73.3% Speak English very well362 26.7% Speak English less than very well
White (Caucasian) - Speak only English Native:
98.7% (33,735)Foreign-born:
50.3% (260)
White (Caucasian) - Speak another language Native:
1.2% (407)Foreign-born:
49.7% (257)
Black or African American - Speak only English Native:
99.2% (5,169)Foreign-born:
27.4% (111)
Black or African American - Speak another language Native:
0.9% (46)Foreign-born:
76.5% (309)
American Indian / Alaska Native - Speak only English Native:
95.2% (66)Foreign-born:
40.6% (9)
Asian - Speak only English Native:
39.9% (101)Foreign-born:
23.4% (244)
Asian - Speak another language Native:
63.3% (160)Foreign-born:
76.4% (796)
Other race - Speak only English Native:
36.7% (11)Foreign-born:
4.1% (2)
Other race - Speak another language Native:
79.4% (23)Foreign-born:
96.8% (52)
Two or more races - Speak another language Native:
3.0% (109)Foreign-born:
100.0% (28)
White alone - Speak only English Native:
98.8% (33,699)Foreign-born:
38.8% (145)
White alone - Speak another language Native:
1.0% (357)Foreign-born:
61.3% (229)
Hispanic or Latino - Speak only English Native:
64.1% (352)Foreign-born:
44.9% (131)
Hispanic or Latino - Speak another language Native:
43.0% (236)Foreign-born:
54.7% (160)
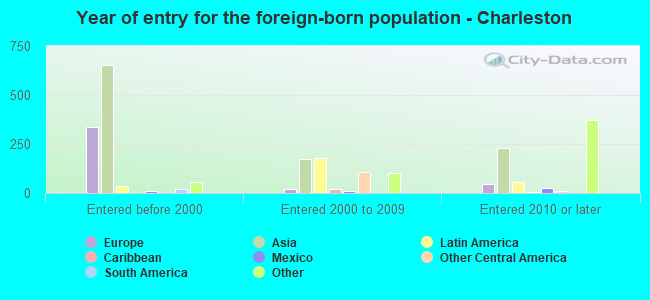
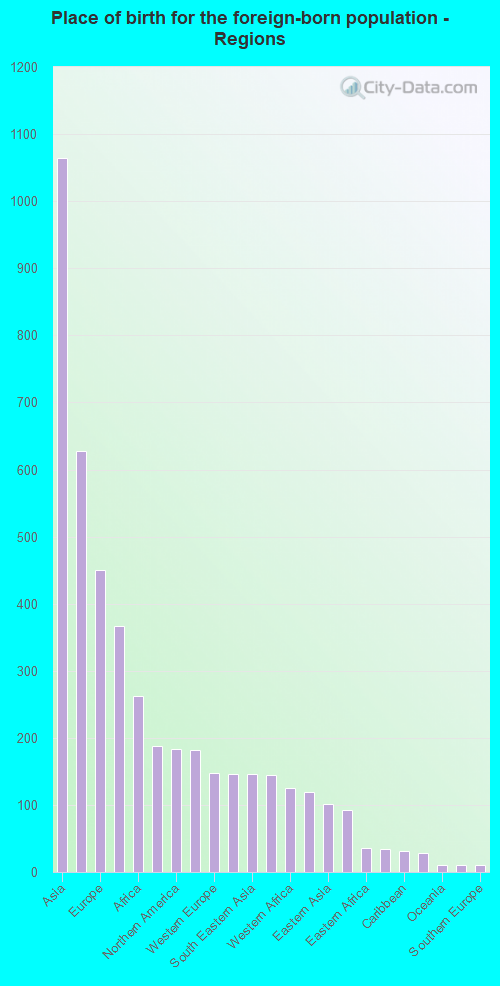
Foreign-born residents in Charleston 2,158 residents are foreign born (2.2% Asia , 0.9% Europe , 0.5% Africa ).
This city:
4.6%West Virginia:
1.6%
Marital status for residents in Charleston Marital status - White (Caucasian) population 15 years and over
Males 32.5% Never married46.1% Now married1.1% Separated3.8% Widowed16.5% DivorcedFemales 26.5% Never married43.9% Now married1.5% Separated10.7% Widowed17.4% DivorcedWomen who gave birth in the past 12 months Now married:
59.8% (179)Unmarried:
40.2% (120)
Women who did not give birth in the past 12 months Now married:
41.6% (3,300)Unmarried:
58.4% (4,630)
Marital status - Black or African American population 15 years and over
Males 56.3% Never married22.1% Now married3.1% Separated3.7% Widowed14.8% DivorcedFemales 53.3% Never married19.5% Now married5.1% Separated8.1% Widowed14.0% DivorcedWomen who gave birth in the past 12 months Now married:
0.0% (0)Unmarried:
100.0% (28)
Women who did not give birth in the past 12 months Now married:
22.4% (363)Unmarried:
77.6% (1,262)
Marital status - American Indian / Alaska Native population 15 years and over
Males 26.8% Never married17.1% Now married0.0% Separated0.0% Widowed56.1% DivorcedFemales 11.1% Never married16.7% Now married0.0% Separated22.2% Widowed50.0% DivorcedWomen who did not give birth in the past 12 months Now married:
0.0% (0)Unmarried:
100.0% (5)
Marital status - Asian population 15 years and over
Males 18.4% Never married76.3% Now married0.0% Separated0.0% Widowed5.3% DivorcedFemales 30.6% Never married56.9% Now married0.7% Separated4.2% Widowed7.6% DivorcedWomen who did not give birth in the past 12 months Now married:
44.2% (174)Unmarried:
55.8% (219)
Marital status - Other race population 15 years and over
Males 48.4% Never married51.6% Now married0.0% Separated0.0% Widowed0.0% DivorcedFemales 100.0% Never married0.0% Now married0.0% Separated0.0% Widowed0.0% DivorcedWomen who did not give birth in the past 12 months Now married:
0.0% (0)Unmarried:
100.0% (15)
Marital status - Two or more races population 15 years and over
Males 46.5% Never married49.5% Now married0.5% Separated0.3% Widowed3.2% DivorcedFemales 54.5% Never married37.3% Now married0.5% Separated1.7% Widowed6.0% DivorcedWomen who gave birth in the past 12 months Now married:
0.0% (0)Unmarried:
100.0% (7)
Women who did not give birth in the past 12 months Now married:
20.6% (176)Unmarried:
79.4% (677)
Marital status - White alone, not Hispanic / Latino population 15 years and over
Males 32.4% Never married46.2% Now married1.1% Separated3.8% Widowed16.5% DivorcedFemales 26.2% Never married44.1% Now married1.5% Separated10.8% Widowed17.4% DivorcedWomen who gave birth in the past 12 months Now married:
59.3% (169)Unmarried:
40.7% (116)
Women who did not give birth in the past 12 months Now married:
42.0% (3,279)Unmarried:
58.0% (4,535)
Marital status - Hispanic or Latino population 15 years and over
Males 36.7% Never married57.3% Now married0.0% Separated0.0% Widowed6.0% DivorcedFemales 49.5% Never married41.4% Now married0.0% Separated1.9% Widowed7.3% DivorcedWomen who gave birth in the past 12 months Now married:
68.8% (11)Unmarried:
31.2% (5)
Women who did not give birth in the past 12 months Now married:
26.6% (65)Unmarried:
73.4% (180)
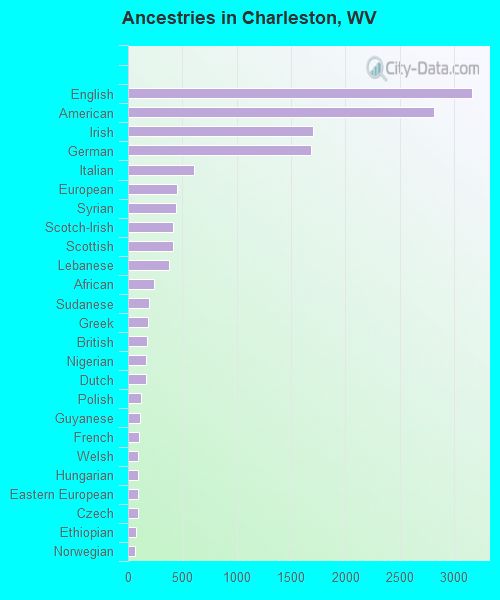
Ancestries in Charleston
3,164 14.7% English2,818 13.1% American1,704 7.9% Irish1,682 7.8% German611 2.8% Italian448 2.1% European438 2.0% Syrian414 1.9% Scotch-Irish410 1.9% Scottish381 1.8% Lebanese242 1.1% African189 0.9% Sudanese181 0.8% Greek175 0.8% British167 0.8% Nigerian165 0.8% Dutch120 0.6% Polish113 0.5% Guyanese103 0.5% French95 0.4% Welsh94 0.4% Hungarian94 0.4% Eastern European88 0.4% Czech77 0.4% Ethiopian69 0.3% Norwegian62 0.3% Scandinavian43 0.2% Northern European38 0.2% Iranian38 0.2% Romanian36 0.2% French Canadian33 0.2% Cypriot31 0.1% Portuguese26 0.1% Jordanian23 0.1% Brazilian19 0.09% Egyptian18 0.08% Swiss17 0.08% Armenian17 0.08% Jamaican15 0.07% Russian15 0.07% Estonian13 0.06% Ghanaian12 0.06% Canadian12 0.06% Haitian11 0.05% Swedish11 0.05% Ukrainian9 0.04% Cajun9 0.04% Pennsylvania German6 0.03% Bulgarian
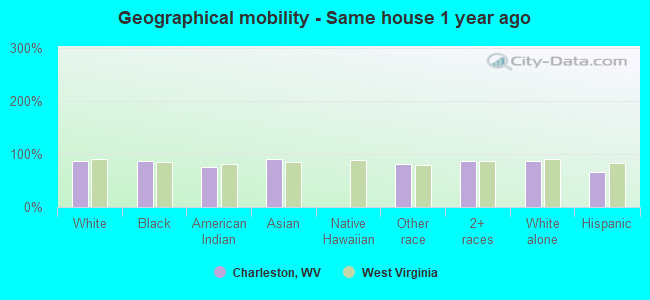
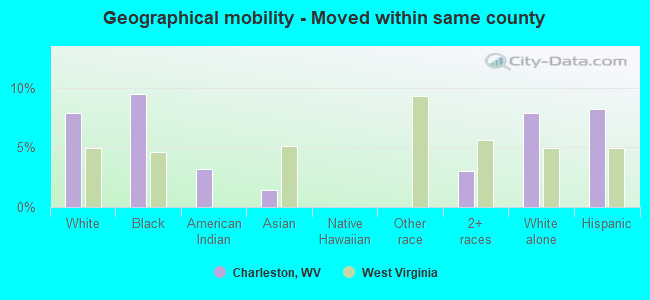
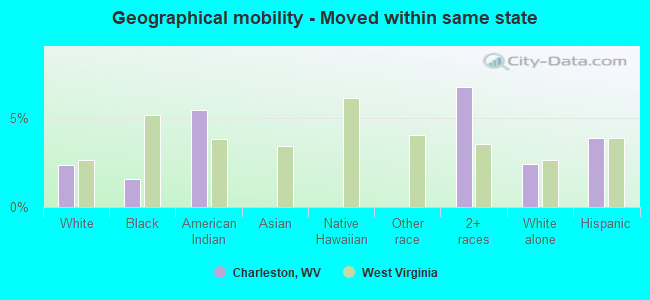
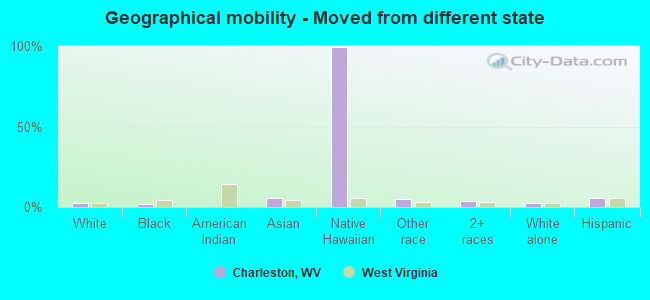
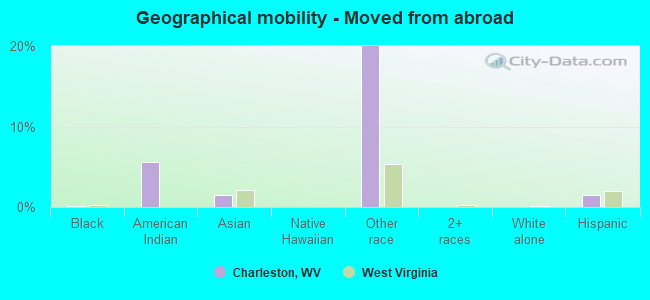
Geographical mobility in Charleston Same house 1 year ago 31,139 86.7% White (Caucasian)6,245 87.6% Black or African American94 74.6% American Indian / Alaska Native1,075 90.9% Asian62 80.9% Other race3,406 87.0% Two or more races31,028 86.9% White alone, not Hispanic / Latino535 66.1% Hispanic or LatinoMoved within same county 2,832 7.9% White / Caucasian675 9.5% Black or African American4 3.2% American Indian / Alaska Native17 1.4% Asian117 3.0% Two or more races2,802 7.8% White alone, not Hispanic / Latino66 8.2% Hispanic or LatinoMoved within same state 849 2.4% White / Caucasian113 1.6% Black or African American7 5.4% American Indian / Alaska Native262 6.7% Two or more races849 2.4% White alone, not Hispanic / Latino31 3.9% Hispanic or LatinoMoved from different state 926 2.6% White / Caucasian125 1.8% Black or African American65 5.5% Asian32 99.3% Native Hawaiian / Pacific Islander4 5.2% Other race144 3.7% Two or more races891 2.5% White alone, not Hispanic / Latino47 5.8% Hispanic or LatinoMoved from abroad 20 0.1% White12 0.2% Black or African American7 5.5% American Indian / Alaska Native18 1.5% Asian15 19.9% Other race12 0.0% White alone, not Hispanic / Latino12 1.5% Hispanic or Latino
Children Nativity (place of birth) in Charleston
Children under 6 years - Living with two parents Both parents native 1,219 100.0% NativeBoth parents foreign-born 99 86.6% Native15 13.4% Foreign-bornOne native, one foreign-born parent 32 100.0% NativeChildren under 6 years - Living with one parent Native parent 1,038 100.0% NativeForeign-born parent 133 100.0% NativeChildren 6 to 17 years - Living with two parents Both parents native 2,616 99.4% Native17 0.6% Foreign-bornBoth parents foreign-born 502 95.4% Native24 4.6% Foreign-bornOne native, one foreign-born parent 165 100.0% NativeChildren 6 to 17 years - Living with one parent Native parent 2,374 98.6% Native33 1.4% Foreign-bornForeign-born parent 47 48.9% Native49 51.1% Foreign-born
Grandparents responsible for own grandchildren in Charleston
Grandparents (30 to 59 years) White / Caucasian 24 19.3% Responsible for grandchildren100 80.7% Not responsible for grandchildrenBlack or African American 19 18.0% Responsible for grandchildren87 82.0% Not responsible for grandchildrenAsian 16 100.0% Responsible for grandchildrenWhite alone, not Hispanic / Latino 24 19.3% Responsible for grandchildren100 80.7% Not responsible for grandchildrenGrandparents (60 years and over) White / Caucasian 83 27.3% Responsible for grandchildren221 72.7% Not responsible for grandchildrenBlack or African American 7 11.0% Responsible for grandchildren58 89.0% Not responsible for grandchildrenAsian 17 62.2% Responsible for grandchildren10 37.8% Not responsible for grandchildrenWhite alone, not Hispanic / Latino 83 28.2% Responsible for grandchildren211 71.8% Not responsible for grandchildren