Races in Checotah, Oklahoma (OK) Detailed Stats
Data:
Races - White alone (%)
Races - White alone (% change since 2000)
Races - Black alone (%)
Races - Black alone (% change since 2000)
Races - American Indian alone (%)
Races - American Indian alone (% change since 2000)
Races - Asian alone (%)
Races - Asian alone (% change since 2000)
Races - Hispanic (%)
Races - Hispanic (% change since 2000)
Races - Native Hawaiian and Other Pacific Islander alone (%)
Races - Native Hawaiian and Other Pacific Islander alone (% change since 2000)
Races - Two or more races(%)
Races - Two or more races(% change since 2000)
Races - Other race alone (%)
Races - Other race alone (% change since 2000)
Racial diversity
Place of birth - Born in state of residence (%)
Place of birth - Born in state of residence (%) - White
Place of birth - Born in state of residence (%) - Black or African American
Place of birth - Born in state of residence (%) - Asian
Place of birth - Born in state of residence (%) - Hispanic or Latino
Place of birth - Born in state of residence (%) - American Indian and Alaska Native
Place of birth - Born in state of residence (%) - Multirace
Place of birth - Born in state of residence (%) - Other Race
Place of birth - Born in other state (%)
Place of birth - Born in other state (%) - White
Place of birth - Born in other state (%) - Black or African American
Place of birth - Born in other state (%) - Asian
Place of birth - Born in other state (%) - Hispanic or Latino
Place of birth - Born in other state (%) - American Indian and Alaska Native
Place of birth - Born in other state (%) - Multirace
Place of birth - Born in other state (%) - Other Race
Place of birth - Native, outside of US (%)
Place of birth - Native, outside of US (%) - White
Place of birth - Native, outside of US (%) - Black or African American
Place of birth - Native, outside of US (%) - Asian
Place of birth - Native, outside of US (%) - Hispanic or Latino
Place of birth - Native, outside of US (%) - American Indian and Alaska Native
Place of birth - Native, outside of US (%) - Multirace
Place of birth - Native, outside of US (%) - Other Race
Place of birth - Foreign born (%)
Place of birth - Foreign born (%) - White
Place of birth - Foreign born (%) - Black or African American
Place of birth - Foreign born (%) - Asian
Place of birth - Foreign born (%) - Hispanic or Latino
Place of birth - Foreign born (%) - American Indian and Alaska Native
Place of birth - Foreign born (%) - Multirace
Place of birth - Foreign born (%) - Other Race
Residents speaking English at home (%)
Residents speaking English at home - Born in the United States (%)
Residents speaking English at home - Native, born elsewhere (%)
Residents speaking English at home - Foreign born (%)
Residents speaking Spanish at home (%)
Residents speaking Spanish at home - Born in the United States (%)
Residents speaking Spanish at home - Native, born elsewhere (%)
Residents speaking Spanish at home - Foreign born (%)
Residents speaking other language at home (%)
Residents speaking other language at home - Born in the United States (%)
Residents speaking other language at home - Native, born elsewhere (%)
Residents speaking other language at home - Foreign born (%)
Marital status - Never married (%)
Marital status - Now married (%)
Marital status - Separated (%)
Marital status - Widowed (%)
Marital status - Divorced (%)
Ancestries Reported - Arab (%)
Ancestries Reported - Czech (%)
Ancestries Reported - Danish (%)
Ancestries Reported - Dutch (%)
Ancestries Reported - English (%)
Ancestries Reported - French (%)
Ancestries Reported - French Canadian (%)
Ancestries Reported - German (%)
Ancestries Reported - Greek (%)
Ancestries Reported - Hungarian (%)
Ancestries Reported - Irish (%)
Ancestries Reported - Italian (%)
Ancestries Reported - Lithuanian (%)
Ancestries Reported - Norwegian (%)
Ancestries Reported - Polish (%)
Ancestries Reported - Portuguese (%)
Ancestries Reported - Russian (%)
Ancestries Reported - Scotch-Irish (%)
Ancestries Reported - Scottish (%)
Ancestries Reported - Slovak (%)
Ancestries Reported - Subsaharan African (%)
Ancestries Reported - Swedish (%)
Ancestries Reported - Swiss (%)
Ancestries Reported - Ukrainian (%)
Ancestries Reported - United States (%)
Ancestries Reported - Welsh (%)
Ancestries Reported - West Indian (%)
Ancestries Reported - Other (%)
Geographical mobility - Same house 1 year ago (%)
Geographical mobility - Same house 1 year ago (%) - White
Geographical mobility - Same house 1 year ago (%) - Black or African American
Geographical mobility - Same house 1 year ago (%) - Asian
Geographical mobility - Same house 1 year ago (%) - Hispanic or Latino
Geographical mobility - Same house 1 year ago (%) - American Indian and Alaska Native
Geographical mobility - Same house 1 year ago (%) - Multirace
Geographical mobility - Same house 1 year ago (%) - Other Race
Geographical mobility - Moved within same county (%)
Geographical mobility - Moved within same county (%) - White
Geographical mobility - Moved within same county (%) - Black or African American
Geographical mobility - Moved within same county (%) - Asian
Geographical mobility - Moved within same county (%) - Hispanic or Latino
Geographical mobility - Moved within same county (%) - American Indian and Alaska Native
Geographical mobility - Moved within same county (%) - Multirace
Geographical mobility - Moved within same county (%) - Other Race
Geographical mobility - Moved from different county within same state (%)
Geographical mobility - Moved from different county within same state (%) - White
Geographical mobility - Moved from different county within same state (%) - Black or African American
Geographical mobility - Moved from different county within same state (%) - Asian
Geographical mobility - Moved from different county within same state (%) - Hispanic or Latino
Geographical mobility - Moved from different county within same state (%) - American Indian and Alaska Native
Geographical mobility - Moved from different county within same state (%) - Multirace
Geographical mobility - Moved from different county within same state (%) - Other Race
Geographical mobility - Moved from different state (%)
Geographical mobility - Moved from different state (%) - White
Geographical mobility - Moved from different state (%) - Black or African American
Geographical mobility - Moved from different state (%) - Asian
Geographical mobility - Moved from different state (%) - Hispanic or Latino
Geographical mobility - Moved from different state (%) - American Indian and Alaska Native
Geographical mobility - Moved from different state (%) - Multirace
Geographical mobility - Moved from different state (%) - Other Race
Geographical mobility - Moved from abroad (%)
Geographical mobility - Moved from abroad (%) - White
Geographical mobility - Moved from abroad (%) - Black or African American
Geographical mobility - Moved from abroad (%) - Asian
Geographical mobility - Moved from abroad (%) - Hispanic or Latino
Geographical mobility - Moved from abroad (%) - American Indian and Alaska Native
Geographical mobility - Moved from abroad (%) - Multirace
Geographical mobility - Moved from abroad (%) - Other Race
Place of birth for the foreign-born population - Ireland (%)
Place of birth for the foreign-born population - Denmark (%)
Place of birth for the foreign-born population - Norway (%)
Place of birth for the foreign-born population - Sweden (%)
Place of birth for the foreign-born population - United Kingdom (%)
Place of birth for the foreign-born population - England (%)
Place of birth for the foreign-born population - Scotland (%)
Place of birth for the foreign-born population - Other Northern Europe (%)
Place of birth for the foreign-born population - Austria (%)
Place of birth for the foreign-born population - Belgium (%)
Place of birth for the foreign-born population - France (%)
Place of birth for the foreign-born population - Germany (%)
Place of birth for the foreign-born population - Netherlands (%)
Place of birth for the foreign-born population - Switzerland (%)
Place of birth for the foreign-born population - Other Western Europe (%)
Place of birth for the foreign-born population - Greece (%)
Place of birth for the foreign-born population - Italy (%)
Place of birth for the foreign-born population - Portugal (%)
Place of birth for the foreign-born population - Spain (%)
Place of birth for the foreign-born population - Other Southern Europe (%)
Place of birth for the foreign-born population - Albania (%)
Place of birth for the foreign-born population - Belarus (%)
Place of birth for the foreign-born population - Bosnia and Herzegovina (%)
Place of birth for the foreign-born population - Bulgaria (%)
Place of birth for the foreign-born population - Croatia (%)
Place of birth for the foreign-born population - Czechoslovakia (%)
Place of birth for the foreign-born population - Hungary (%)
Place of birth for the foreign-born population - Latvia (%)
Place of birth for the foreign-born population - Lithuania (%)
Place of birth for the foreign-born population - North Macedonia (Macedonia) (%)
Place of birth for the foreign-born population - Moldova (%)
Place of birth for the foreign-born population - Poland (%)
Place of birth for the foreign-born population - Romania (%)
Place of birth for the foreign-born population - Russia (%)
Place of birth for the foreign-born population - Serbia (%)
Place of birth for the foreign-born population - Ukraine (%)
Place of birth for the foreign-born population - Other Eastern Europe (%)
Place of birth for the foreign-born population - China (%)
Place of birth for the foreign-born population - Hong Kong (%)
Place of birth for the foreign-born population - Taiwan (%)
Place of birth for the foreign-born population - Japan (%)
Place of birth for the foreign-born population - Korea (%)
Place of birth for the foreign-born population - Other Eastern Asia (%)
Place of birth for the foreign-born population - Afghanistan (%)
Place of birth for the foreign-born population - Bangladesh (%)
Place of birth for the foreign-born population - India (%)
Place of birth for the foreign-born population - Iran (%)
Place of birth for the foreign-born population - Kazakhstan (%)
Place of birth for the foreign-born population - Nepal (%)
Place of birth for the foreign-born population - Pakistan (%)
Place of birth for the foreign-born population - Sri Lanka (%)
Place of birth for the foreign-born population - Uzbekistan (%)
Place of birth for the foreign-born population - Other South Central Asia (%)
Place of birth for the foreign-born population - Burma (%)
Place of birth for the foreign-born population - Cambodia (%)
Place of birth for the foreign-born population - Indonesia (%)
Place of birth for the foreign-born population - Laos (%)
Place of birth for the foreign-born population - Malaysia (%)
Place of birth for the foreign-born population - Philippines (%)
Place of birth for the foreign-born population - Singapore (%)
Place of birth for the foreign-born population - Thailand (%)
Place of birth for the foreign-born population - Vietnam (%)
Place of birth for the foreign-born population - Other South Eastern Asia (%)
Place of birth for the foreign-born population - Armenia (%)
Place of birth for the foreign-born population - Iraq (%)
Place of birth for the foreign-born population - Israel (%)
Place of birth for the foreign-born population - Jordan (%)
Place of birth for the foreign-born population - Kuwait (%)
Place of birth for the foreign-born population - Lebanon (%)
Place of birth for the foreign-born population - Saudi Arabia (%)
Place of birth for the foreign-born population - Syria (%)
Place of birth for the foreign-born population - Turkey (%)
Place of birth for the foreign-born population - Yemen (%)
Place of birth for the foreign-born population - Other Western Asia (%)
Place of birth for the foreign-born population - Eritrea (%)
Place of birth for the foreign-born population - Ethiopia (%)
Place of birth for the foreign-born population - Kenya (%)
Place of birth for the foreign-born population - Somalia (%)
Place of birth for the foreign-born population - Uganda (%)
Place of birth for the foreign-born population - Zimbabwe (%)
Place of birth for the foreign-born population - Other Eastern Africa (%)
Place of birth for the foreign-born population - Cameroon (%)
Place of birth for the foreign-born population - Congo (%)
Place of birth for the foreign-born population - Democratic Republic of Congo (Zaire) (%)
Place of birth for the foreign-born population - Other Middle Africa (%)
Place of birth for the foreign-born population - Egypt (%)
Place of birth for the foreign-born population - Morocco (%)
Place of birth for the foreign-born population - Sudan (%)
Place of birth for the foreign-born population - Other Northern Africa (%)
Place of birth for the foreign-born population - South Africa (%)
Place of birth for the foreign-born population - Other Southern Africa (%)
Place of birth for the foreign-born population - Cabo Verde (%)
Place of birth for the foreign-born population - Ghana (%)
Place of birth for the foreign-born population - Liberia (%)
Place of birth for the foreign-born population - Nigeria (%)
Place of birth for the foreign-born population - Senegal (%)
Place of birth for the foreign-born population - Sierra Leone (%)
Place of birth for the foreign-born population - Other Western Africa (%)
Place of birth for the foreign-born population - Australia (%)
Place of birth for the foreign-born population - New Zealand (%)
Place of birth for the foreign-born population - Fiji (%)
Place of birth for the foreign-born population - Micronesia (%)
Place of birth for the foreign-born population - Bahamas (%)
Place of birth for the foreign-born population - Barbados (%)
Place of birth for the foreign-born population - Cuba (%)
Place of birth for the foreign-born population - Dominica (%)
Place of birth for the foreign-born population - Dominican Republic (%)
Place of birth for the foreign-born population - Grenada (%)
Place of birth for the foreign-born population - Haiti (%)
Place of birth for the foreign-born population - Jamaica (%)
Place of birth for the foreign-born population - St. Vincent and the Grenadines (%)
Place of birth for the foreign-born population - Trinidad and Tobago (%)
Place of birth for the foreign-born population - West Indies (%)
Place of birth for the foreign-born population - Other Caribbean (%)
Place of birth for the foreign-born population - Belize (%)
Place of birth for the foreign-born population - Costa Rica (%)
Place of birth for the foreign-born population - El Salvador (%)
Place of birth for the foreign-born population - Guatemala (%)
Place of birth for the foreign-born population - Honduras (%)
Place of birth for the foreign-born population - Mexico (%)
Place of birth for the foreign-born population - Nicaragua (%)
Place of birth for the foreign-born population - Panama (%)
Place of birth for the foreign-born population - Other Central America (%)
Place of birth for the foreign-born population - Argentina (%)
Place of birth for the foreign-born population - Bolivia (%)
Place of birth for the foreign-born population - Brazil (%)
Place of birth for the foreign-born population - Chile (%)
Place of birth for the foreign-born population - Colombia (%)
Place of birth for the foreign-born population - Ecuador (%)
Place of birth for the foreign-born population - Guyana (%)
Place of birth for the foreign-born population - Peru (%)
Place of birth for the foreign-born population - Uruguay (%)
Place of birth for the foreign-born population - Venezuela (%)
Place of birth for the foreign-born population - Other South America (%)
Place of birth for the foreign-born population - Canada (%)
Place of birth for the foreign-born population - Other Northern America (%)
Place of birth for the foreign-born population - Other (%)
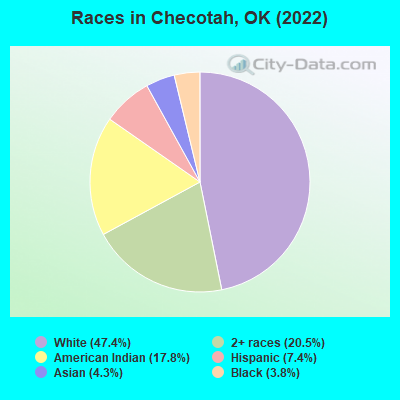
According to 2022 data, the most numerous races in Checotah, OK are White alone (1,463 residents), Hispanic (227 residents), and Two or more races (631 residents). 92.4% of Checotah residents speak English at home. 2.5% of Checotah, OK residents are foreign-born (1.9% born in Latin America, 0.5% born in Asia), which is 143.6% less than the foreign-born rate of 6.0% across the entire state of Oklahoma.
Race distribution in Checotah
2000 2022
2,556,368 74.1% White alone 266,158 7.7% American Indian alone 257,981 7.5% Black alone 179,304 5.2% Hispanic 140,249 4.1% Two or more races 46,172 1.3% Asian alone 2,322 0.07% Other race alone 2,100 0.06% Native Hawaiian and Other
2,517,403 62.6% White alone 486,692 12.1% Hispanic 364,453 9.1% Two or more races 273,650 6.8% American Indian alone 268,543 6.7% Black alone 92,672 2.3% Asian alone 10,786 0.3% Other race alone 5,601 0.1% Native Hawaiian and Other
Income and house value in Checotah Median household income in 2022 $43,092 White non-Hispanic householders$34,950 Black householders$33,788 American Indian and Alaska Native householders$44,125 Two or more races householders$34,091 Hispanic or Latino race householdersMedian 2022 house value $125,377 White Non-Hispanic householders$81,069 Black or African American householders$98,354 American Indian or Alaska Native householders$109,553 Some other race householders$150,209 Two or more races householders$150,209 Hispanic or Latino householders
Median age by race in Checotah
53.4 Median age for White residents57.7 50.9 61.1 Median age for Black or African American residents54.7 66.3 27.4 Median age for American Indian / Alaska Native residents29.5 26.1 29.2 Median age for Asian residents-662,601,625.4 29.9 -725,225,224.5 Median age for Native Hawaiian / Pacific Islander residents-675,324,674.6 -767,251,461.2 33.2 Median age for Other race residents-664,359,860.9 -690,821,255.3 20.2 Median age for Two or more races residents18.6 37.2 52.7 Median age for White alone residents56.8 50.4 9.9 Median age for Hispanic or Latino residents48.7 4.5
Owner/renter occupied households by race in Checotah
House owners and renters - White residents 374 49.9% Owner occupied375 50.1% Renter occupiedHouse owners and renters - Black or African American residents 38 56.3% Owner occupied29 43.7% Renter occupiedHouse owners and renters - American Indian / Alaska Native residents 83 47.0% Owner occupied93 53.0% Renter occupiedHouse owners and renters - Asian residents 8 100.0% Owner occupiedHouse owners and renters - Other race residents 2 100.0% Owner occupiedHouse owners and renters - Two or more races residents 195 90.0% Owner occupied22 10.0% Renter occupiedHouse owners and renters - White alone residents 345 51.1% Owner occupied330 48.9% Renter occupiedHouse owners and renters - Hispanic or Latino residents 39 38.7% Owner occupied62 61.3% Renter occupied
Language usage in Checotah
English speakers - Total 92.4% of residents of Checotah speak English at home.
7.1% of residents speak other language at home 195 96.5% Speak English very well7 3.5% Speak English less than very well
English speakers - Born in the United States 98.6% of residents of Checotah speak English at home.
1.1% of residents speak other language at home 9 100.0% Speak English very well
English speakers - Native, born elsewhere 95.8% of residents of Checotah speak English at home.
English speakers - Foreign-born 78.9% of residents of Checotah speak English at home.
15.8% of residents speak other language at home 5 41.7% Speak English very well7 58.3% Speak English less than very well
White (Caucasian) - Speak only English Native:
100.0% (1,417)Foreign-born:
100.0% (36)
Asian - Speak another language Native:
79.9% (111)Foreign-born:
100.0% (8)
Other race - Speak only English Native:
95.5% (11)Foreign-born:
100.0% (5)
White alone - Speak only English Native:
100.0% (1,364)Foreign-born:
41.5% (4)
Hispanic or Latino - Speak only English Native:
100.0% (94)Foreign-born:
100.0% (61)
Foreign-born residents in Checotah 76 residents are foreign born (1.9% Latin America , 0.5% Asia ).
This city:
2.5%Oklahoma:
6.1%
Marital status for residents in Checotah Marital status - White (Caucasian) population 15 years and over
Males 26.9% Never married39.3% Now married6.1% Separated14.3% Widowed13.5% DivorcedFemales 14.6% Never married35.6% Now married7.7% Separated22.2% Widowed19.9% DivorcedWomen who gave birth in the past 12 months Now married:
100.0% (14)Unmarried:
0.0% (0)
Women who did not give birth in the past 12 months Now married:
44.7% (144)Unmarried:
55.3% (177)
Marital status - Black or African American population 15 years and over
Males 26.3% Never married29.8% Now married0.0% Separated0.0% Widowed43.9% DivorcedFemales 46.0% Never married38.1% Now married0.0% Separated15.9% Widowed0.0% DivorcedMarital status - American Indian / Alaska Native population 15 years and over
Males 52.1% Never married31.6% Now married0.0% Separated3.4% Widowed12.8% DivorcedFemales 30.8% Never married43.6% Now married8.1% Separated5.2% Widowed12.3% DivorcedWomen who did not give birth in the past 12 months Now married:
61.4% (99)Unmarried:
38.6% (62)
Marital status - Asian population 15 years and over
Males 100.0% Never married0.0% Now married0.0% Separated0.0% Widowed0.0% DivorcedFemales 92.9% Never married0.0% Now married0.0% Separated0.0% Widowed7.1% DivorcedWomen who did not give birth in the past 12 months Now married:
0.0% (0)Unmarried:
100.0% (104)
Marital status - Other race population 15 years and over
Males 0.0% Never married100.0% Now married0.0% Separated0.0% Widowed0.0% DivorcedFemales 0.0% Never married100.0% Now married0.0% Separated0.0% Widowed0.0% DivorcedMarital status - Two or more races population 15 years and over
Males 22.2% Never married27.8% Now married0.0% Separated0.0% Widowed50.0% DivorcedFemales 32.3% Never married35.9% Now married0.0% Separated16.1% Widowed15.7% DivorcedWomen who did not give birth in the past 12 months Now married:
42.9% (72)Unmarried:
57.1% (96)
Marital status - White alone, not Hispanic / Latino population 15 years and over
Males 30.0% Never married41.7% Now married6.8% Separated6.4% Widowed15.1% DivorcedFemales 15.0% Never married33.7% Now married7.9% Separated22.8% Widowed20.5% DivorcedWomen who gave birth in the past 12 months Now married:
100.0% (15)Unmarried:
0.0% (0)
Women who did not give birth in the past 12 months Now married:
41.0% (128)Unmarried:
59.0% (183)
Marital status - Hispanic or Latino population 15 years and over
Males 0.0% Never married25.7% Now married0.0% Separated74.3% Widowed0.0% DivorcedFemales 0.0% Never married100.0% Now married0.0% Separated0.0% Widowed0.0% DivorcedWomen who did not give birth in the past 12 months Now married:
100.0% (23)Unmarried:
0.0% (0)
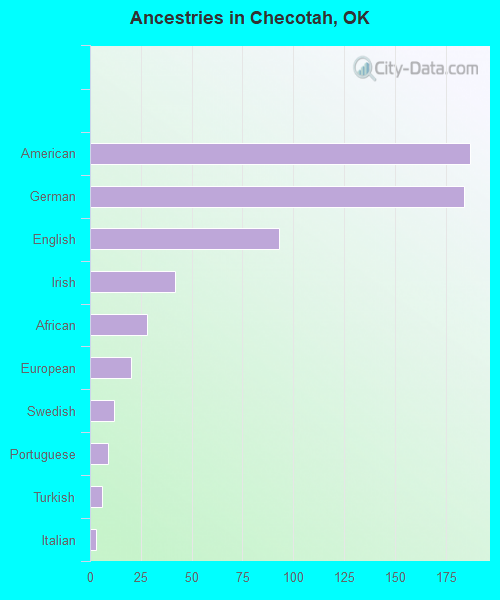
Ancestries in Checotah
187 13.6% American184 13.3% German93 6.7% English42 3.0% Irish28 2.0% African20 1.5% European12 0.9% Swedish9 0.7% Portuguese6 0.4% Turkish3 0.2% Italian
Children Nativity (place of birth) in Checotah
Children under 6 years - Living with two parents Both parents native 89 100.0% NativeChildren under 6 years - Living with one parent Native parent 128 100.0% Native
Children 6 to 17 years - Living with two parents Both parents native 126 100.0% NativeChildren 6 to 17 years - Living with one parent Native parent 237 100.0% Native
Place of birth for residents in Checotah 58 Americas58 Latin America58 Central America13 Asia7 South Eastern Asia5 Western Asia3 Europe3 Western Europe
Grandparents responsible for own grandchildren in Checotah
Grandparents (30 to 59 years) White / Caucasian 14 100.0% Not responsible for grandchildrenAmerican Indian / Alaska Native 17 50.7% Responsible for grandchildren17 49.3% Not responsible for grandchildrenWhite alone, not Hispanic / Latino 16 100.0% Not responsible for grandchildrenGrandparents (60 years and over) White / Caucasian 7 19.8% Responsible for grandchildren27 80.2% Not responsible for grandchildrenWhite alone, not Hispanic / Latino 7 19.1% Responsible for grandchildren28 80.9% Not responsible for grandchildren