Races in Chehalis Village, Washington (WA) Detailed Stats
Ancestries, Foreign-born residents, place of birth

Discuss Chehalis Village, Washington races on our local forum with over 2,400,000 registered users
0.6% of Chehalis Village, WA residents are foreign-born , which is 2495.0% less than the foreign-born rate of 15.0% across the entire state of Washington.
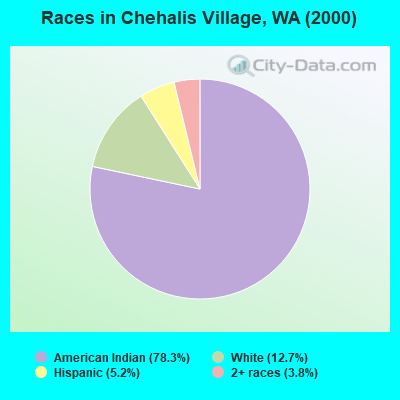
Race distribution in Chehalis Village

- 27178.3%American Indian alone
- 4412.7%White alone
- 185.2%Hispanic
- 133.8%Two or more races
2000
2022
-
- 4,652,49078.9%White alone
- 441,5097.5%Hispanic
- 319,4015.4%Asian alone
- 184,6313.1%Black alone
- 175,9263.0%Two or more races
- 85,3961.4%American Indian alone
- 22,7790.4%Native Hawaiian and Other
Pacific Islander alone - 11,9890.2%Other race alone

-
- 4,941,45663.5%White alone
- 1,093,31314.0%Hispanic
- 755,8329.7%Asian alone
- 523,4486.7%Two or more races
- 299,5373.8%Black alone
- 69,0240.9%American Indian alone
- 52,2310.7%Native Hawaiian and Other
Pacific Islander alone - 50,9450.7%Other race alone

Income and house value in Chehalis Village
- Median household income in 2022
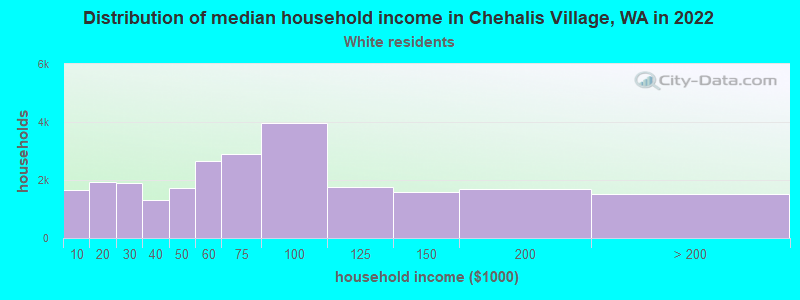
- $60,049White non-Hispanic householders
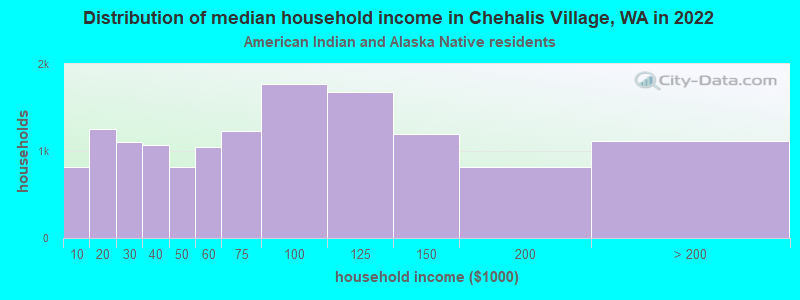
- $52,938American Indian and Alaska Native householders
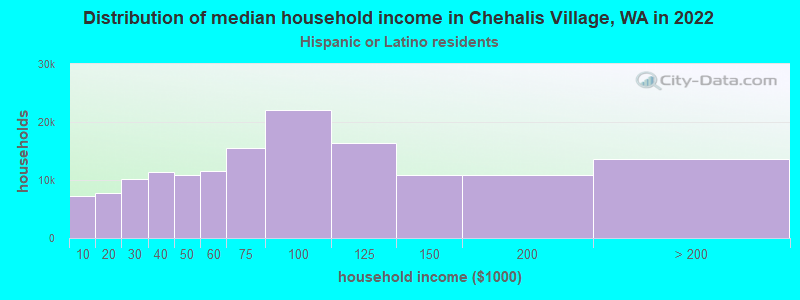
- $64,050Hispanic or Latino race householders
- Median 2022 house value
- $253,339American Indian or Alaska Native householders
Household income for White non-Hispanic householders
Household income for American Indian and Alaska Native householders
Household income for Hispanic or Latino race householders
Foreign-born residents in Chehalis Village
2 residents are foreign born
| This city: | 0.6% |
| Washington: | 10.4% |
Ancestries in Chehalis Village

- 31796.6%Other
- 30.9%French
- 20.6%English
- 20.6%Irish
- 20.6%Norwegian
- 20.6%Swedish

Zip codes: 98568.