Races in Chehalis, Washington (WA) Detailed Stats
Ancestries, Foreign-born residents, place of birth
Settings
X


Recent posts about races in Chehalis, Washington on our local forum with over 2,400,000 registered users:
 | Salmon Creek vs. Fishers Landing (222 replies) |
| Washington Weather - Daily Weather pics and reports! (2559 replies) |
| Is Aberdeen Washington, a lost cause? (77 replies) |
| You won't see the sun for 10 months out of the year they said... (439 replies) |
| Washington housing market pretty crazy. How's your area? (53 replies) |
| Waterfront Property in Washington State (anywhere) (54 replies) |
Latest news about races in Chehalis, WA collected exclusively by city-data.com from local newspapers, TV, and radio stations
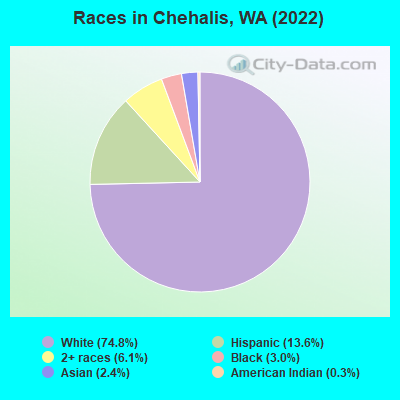
According to 2022 data, the most numerous races in Chehalis, WA are White alone (5,799 residents), Hispanic (1,057 residents), and Asian alone (183 residents). 90.1% of Chehalis residents speak English at home. 5.0% of Chehalis, WA residents are foreign-born (3.9% born in Latin America, 0.9% born in Asia), which is 197.6% less than the foreign-born rate of 15.0% across the entire state of Washington.
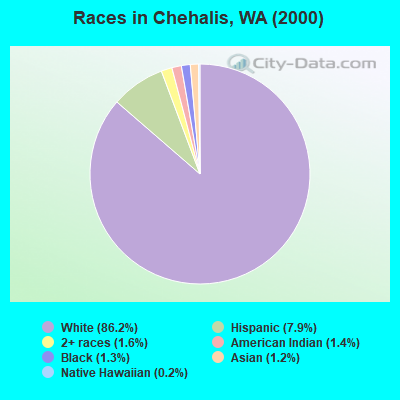
Race distribution in Chehalis
2000
2022

- 6,08686.2%White alone
- 5587.9%Hispanic
- 1111.6%Two or more races
- 1011.4%American Indian alone
- 941.3%Black alone
- 851.2%Asian alone
- 170.2%Native Hawaiian and Other
Pacific Islander alone - 50.07%Other race alone
-
- 5,79974.8%White alone
- 1,05713.6%Hispanic
- 4746.1%Two or more races
- 2363.0%Black alone
- 1832.4%Asian alone
- 260.3%American Indian alone
- 50.06%Other race alone
2000
2022
-
- 4,652,49078.9%White alone
- 441,5097.5%Hispanic
- 319,4015.4%Asian alone
- 184,6313.1%Black alone
- 175,9263.0%Two or more races
- 85,3961.4%American Indian alone
- 22,7790.4%Native Hawaiian and Other
Pacific Islander alone - 11,9890.2%Other race alone

-
- 4,941,45663.5%White alone
- 1,093,31314.0%Hispanic
- 755,8329.7%Asian alone
- 523,4486.7%Two or more races
- 299,5373.8%Black alone
- 69,0240.9%American Indian alone
- 52,2310.7%Native Hawaiian and Other
Pacific Islander alone - 50,9450.7%Other race alone

Income and house value in Chehalis
- Median household income in 2022
- $68,124White non-Hispanic householders
- $41,188Black householders
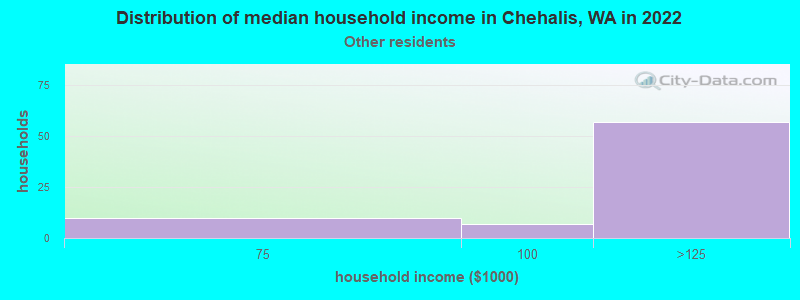
- $108,191Some other race householders
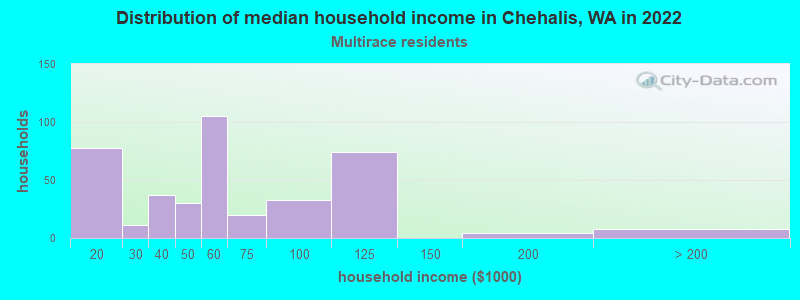
- $55,949Two or more races householders
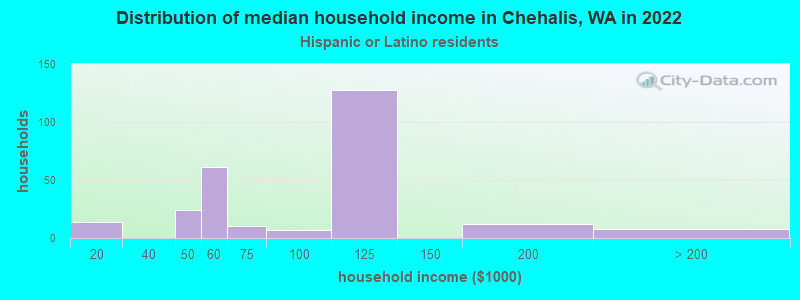
- $64,946Hispanic or Latino race householders
- Median 2022 house value
- $370,702White Non-Hispanic householders
- $464,222Black or African American householders
- $675,233American Indian or Alaska Native householders
- $437,888Two or more races householders
- $548,626Hispanic or Latino householders
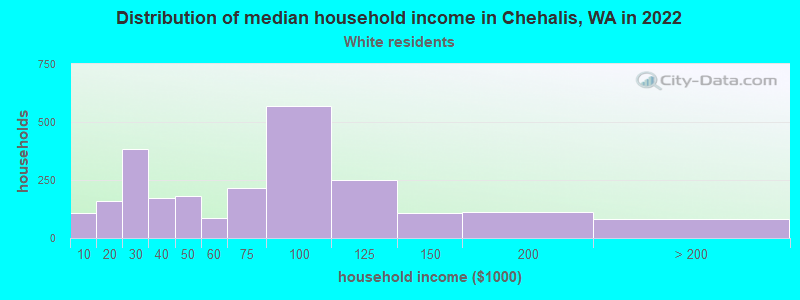
Household income for White non-Hispanic householders
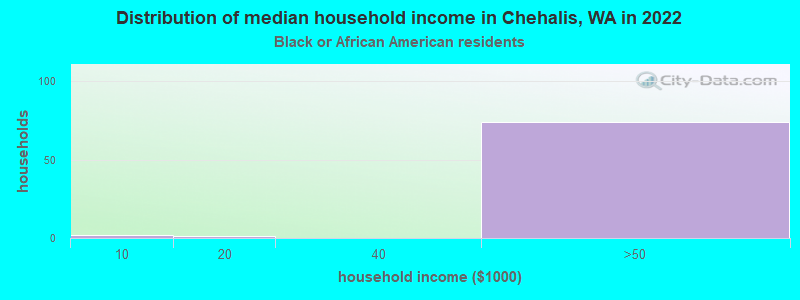
Household income for Black householders
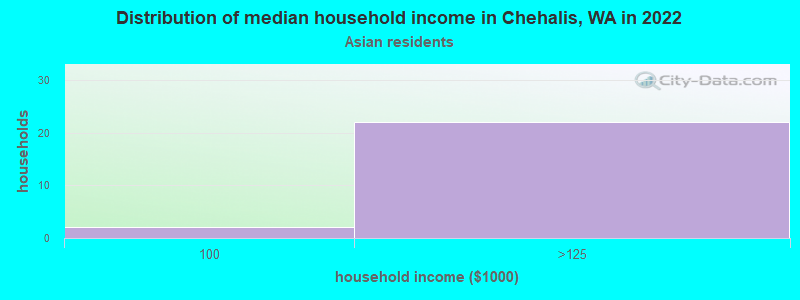
Household income for Asian householders
Household income for Some other race householders
Household income for Two or more races householders
Household income for Hispanic or Latino race householders
Median age by race in Chehalis
- 34.3Median age for White residents
- 34.9Males
- 33.1Females
- 68.9Median age for Black or African American residents
- 67.3Males
- 48.6Females
- 46.7Median age for American Indian / Alaska Native residents
- 49.1Males
- -651,321,397.5Females
- 5.9Median age for Asian residents
- 2.2Males
- 5.3Females
- -440,771,349.4Median age for Native Hawaiian / Pacific Islander residents
- -662,460,567.2Males
- -665,577,341.4Females
- 18.4Median age for Other race residents
- 17.7Males
- -542,372,880.8Females
- 30.8Median age for Two or more races residents
- 28.3Males
- 27.1Females
- 34.9Median age for White alone residents
- 36.2Males
- 34.6Females
- 23.0Median age for Hispanic or Latino residents
- 24.8Males
- 24.9Females
Owner/renter occupied households by race in Chehalis
- House owners and renters - White residents
- 1,35759.3%Owner occupied
- 93040.7%Renter occupied
- House owners and renters - Black or African American residents
- 67100.0%Renter occupied
- House owners and renters - American Indian / Alaska Native residents
- 2100.0%Owner occupied
- House owners and renters - Asian residents
- 25100.0%Owner occupied
- House owners and renters - Other race residents
- 115100.0%Renter occupied
- House owners and renters - Two or more races residents
- 19954.9%Owner occupied
- 16445.1%Renter occupied
- House owners and renters - White alone residents
- 1,33760.1%Owner occupied
- 88939.9%Renter occupied
- House owners and renters - Hispanic or Latino residents
- 13045.9%Owner occupied
- 15354.1%Renter occupied
Language usage in Chehalis
- English speakers - Total
- 90.1% of residents of Chehalis speak English at home.
- 7.9% of residents speak Spanish at home
- 35562.0%Speak English very well
- 21838.0%Speak English less than very well
- 1.8% of residents speak other language at home
- 3929.8%Speak English very well
- 9270.2%Speak English less than very well
- English speakers - Born in the United States
- 97.2% of residents of Chehalis speak English at home.
- 2.0% of residents speak Spanish at home
- 48100.0%Speak English very well
- 0.7% of residents speak other language at home
- 17100.0%Speak English very well
- English speakers - Native, born elsewhere
- 81.6% of residents of Chehalis speak English at home.
- 28.9% of residents speak Spanish at home
- 22100.0%Speak English very well
- English speakers - Foreign-born
- 4.1% of residents of Chehalis speak English at home.
- 72.1% of residents speak Spanish at home
- 7022.0%Speak English very well
- 24878.0%Speak English less than very well
- 27.4% of residents speak other language at home
- 129.9%Speak English very well
- 10990.1%Speak English less than very well
White (Caucasian) - Speak another language
| Native: | 1.0% (55) |
| Foreign-born: | 100.0% (40) |
Black or African American - Speak another language
| Native: | 5.5% (9) |
| Foreign-born: | 97.1% (3) |
Asian - Speak only English
| Native: | 98.3% (32) |
| Foreign-born: | 51.0% (18) |
Other race - Speak another language
| Native: | 67.2% (121) |
| Foreign-born: | 100.0% (103) |
Two or more races - Speak another language
| Native: | 19.7% (154) |
| Foreign-born: | 96.3% (252) |
White alone - Speak another language
| Native: | 0.6% (34) |
| Foreign-born: | 100.0% (53) |
Hispanic or Latino - Speak another language
| Native: | 43.4% (283) |
| Foreign-born: | 96.3% (319) |
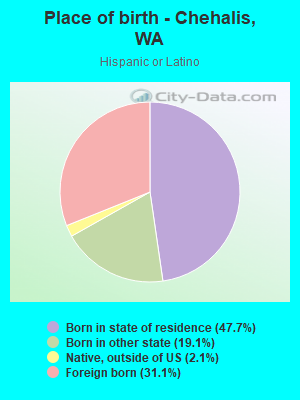
Foreign-born residents in Chehalis
391 residents are foreign born (3.9% Latin America, 0.9% Asia).
| This city: | 5.0% |
| Washington: | 14.9% |
Marital status for residents in Chehalis
Marital status - White (Caucasian) population 15 years and over
- Males
- 40.0%Never married
- 37.7%Now married
- 0.7%Separated
- 7.8%Widowed
- 13.8%Divorced
- Females
- 26.5%Never married
- 42.8%Now married
- 4.2%Separated
- 9.4%Widowed
- 17.1%Divorced
Women who gave birth in the past 12 months
| Now married: | 100.0% (92) |
| Unmarried: | 0.0% (0) |
Women who did not give birth in the past 12 months
| Now married: | 44.8% (585) |
| Unmarried: | 55.2% (722) |
Marital status - Black or African American population 15 years and over
- Males
- 40.6%Never married
- 9.4%Now married
- 46.9%Separated
- 0.0%Widowed
- 3.1%Divorced
- Females
- 87.5%Never married
- 0.0%Now married
- 0.0%Separated
- 12.5%Widowed
- 0.0%Divorced
Women who did not give birth in the past 12 months
| Now married: | 0.0% (0) |
| Unmarried: | 100.0% (14) |
Marital status - American Indian / Alaska Native population 15 years and over
- Males
- 82.4%Never married
- 0.0%Now married
- 0.0%Separated
- 0.0%Widowed
- 17.6%Divorced
- Females
- 0.0%Never married
- 0.0%Now married
- 0.0%Separated
- 0.0%Widowed
- 100.0%Divorced
Marital status - Asian population 15 years and over
- Males
- 0.0%Never married
- 100.0%Now married
- 0.0%Separated
- 0.0%Widowed
- 0.0%Divorced
- Females
- 0.0%Never married
- 24.4%Now married
- 0.0%Separated
- 34.1%Widowed
- 41.5%Divorced
Women who did not give birth in the past 12 months
| Now married: | 100.0% (11) |
| Unmarried: | 0.0% (0) |
Marital status - Other race population 15 years and over
- Males
- 76.5%Never married
- 3.9%Now married
- 19.6%Separated
- 0.0%Widowed
- 0.0%Divorced
- Females
- 100.0%Never married
- 0.0%Now married
- 0.0%Separated
- 0.0%Widowed
- 0.0%Divorced
Women who did not give birth in the past 12 months
| Now married: | 0.0% (0) |
| Unmarried: | 100.0% (16) |
Marital status - Two or more races population 15 years and over
- Males
- 23.8%Never married
- 50.4%Now married
- 0.0%Separated
- 0.0%Widowed
- 25.8%Divorced
- Females
- 44.8%Never married
- 38.1%Now married
- 0.0%Separated
- 5.7%Widowed
- 11.3%Divorced
Women who did not give birth in the past 12 months
| Now married: | 41.0% (93) |
| Unmarried: | 59.0% (134) |
Marital status - White alone, not Hispanic / Latino population 15 years and over
- Males
- 38.5%Never married
- 38.7%Now married
- 0.7%Separated
- 8.1%Widowed
- 14.0%Divorced
- Females
- 25.2%Never married
- 43.0%Now married
- 4.3%Separated
- 9.7%Widowed
- 17.8%Divorced
Women who gave birth in the past 12 months
| Now married: | 100.0% (97) |
| Unmarried: | 0.0% (0) |
Women who did not give birth in the past 12 months
| Now married: | 46.1% (606) |
| Unmarried: | 53.9% (708) |
Marital status - Hispanic or Latino population 15 years and over
- Males
- 50.1%Never married
- 32.2%Now married
- 7.1%Separated
- 0.0%Widowed
- 10.6%Divorced
- Females
- 53.6%Never married
- 45.8%Now married
- 0.0%Separated
- 0.6%Widowed
- 0.0%Divorced
Women who did not give birth in the past 12 months
| Now married: | 39.0% (63) |
| Unmarried: | 61.0% (99) |
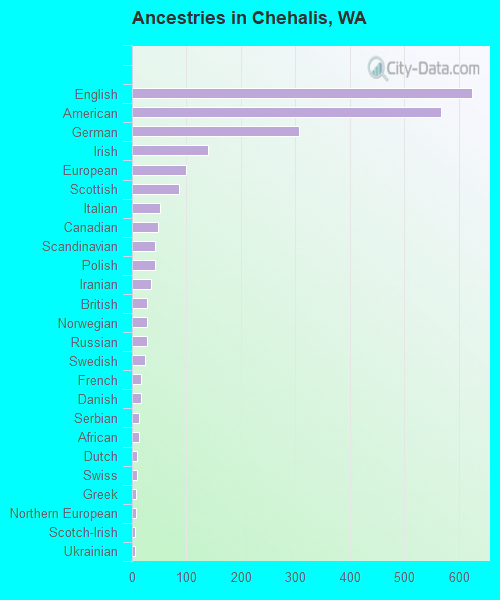
Ancestries in Chehalis

- 62418.4%English
- 56816.8%American
- 3069.0%German
- 1394.1%Irish
- 992.9%European
- 872.6%Scottish
- 521.5%Italian
- 481.4%Canadian
- 431.3%Scandinavian
- 421.2%Polish
- 351.0%Iranian
- 280.8%British
- 280.8%Norwegian
- 280.8%Russian
- 230.7%Swedish
- 170.5%French
- 160.5%Danish
- 120.4%Serbian
- 120.4%African
- 100.3%Dutch
- 100.3%Swiss
- 80.2%Greek
- 70.2%Northern European
- 60.2%Scotch-Irish
- 60.2%Ukrainian
- 50.1%Finnish
- 50.1%French Canadian
- 50.1%Romanian
- 20.06%Kenyan
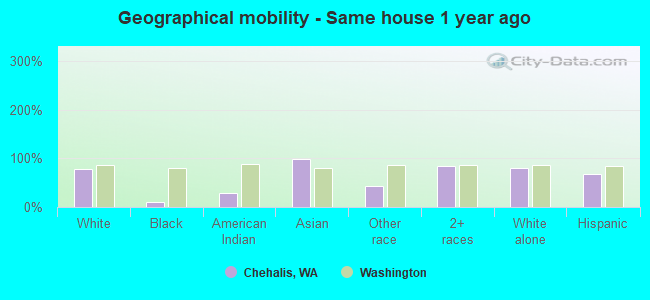
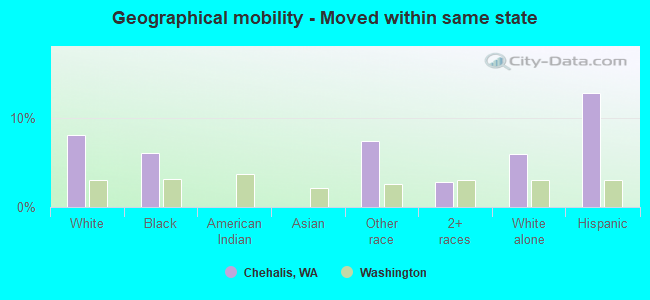
Geographical mobility in Chehalis

- Same house 1 year ago
- 4,58878.1%White (Caucasian)
- 2210.4%Black or African American
- 629.0%American Indian / Alaska Native
- 17098.4%Asian
- 12143.0%Other race
- 1,00985.1%Two or more races
- 4,54979.9%White alone, not Hispanic / Latino
- 70768.4%Hispanic or Latino
-
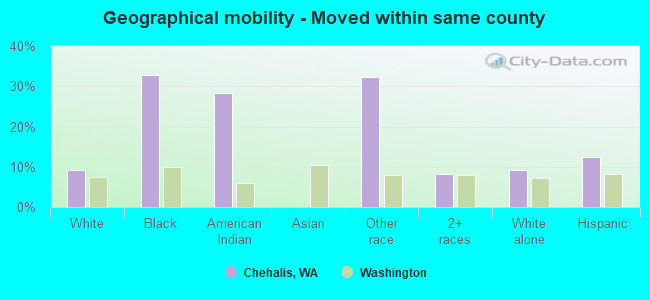
- Moved within same county
- 5379.1%White / Caucasian
- 6932.8%Black or African American
- 628.4%American Indian / Alaska Native
- 9132.3%Other race
- 998.3%Two or more races
- 5309.3%White alone, not Hispanic / Latino
- 12812.4%Hispanic or Latino
-
- Moved within same state
- 4758.1%White / Caucasian
- 136.0%Black or African American
- 217.4%Other race
- 332.8%Two or more races
- 3396.0%White alone, not Hispanic / Latino
- 13212.8%Hispanic or Latino
-
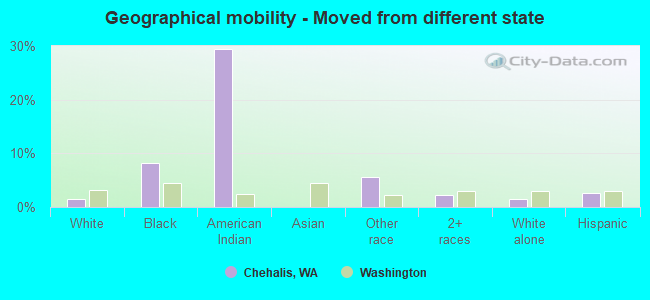
- Moved from different state
- 841.4%White / Caucasian
- 178.2%Black or African American
- 629.5%American Indian / Alaska Native
- 165.6%Other race
- 262.2%Two or more races
- 821.4%White alone, not Hispanic / Latino
- 282.7%Hispanic or Latino
-
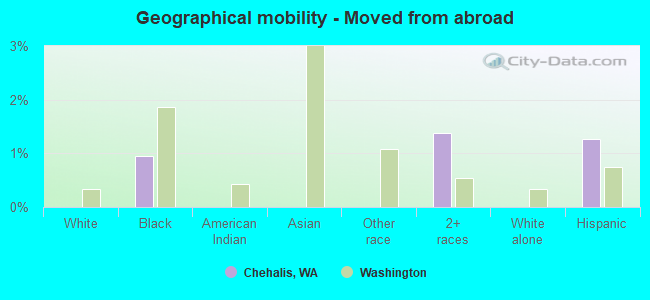
- Moved from abroad
- 20.9%Black or African American
- 161.4%Two or more races
- 131.3%Hispanic or Latino
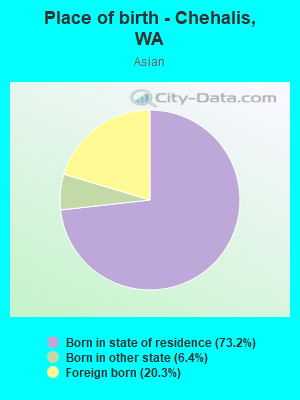
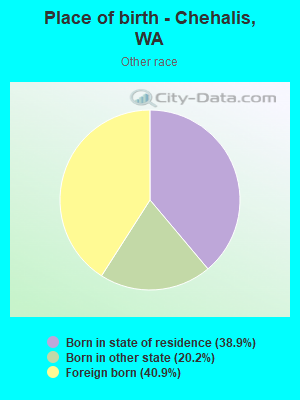
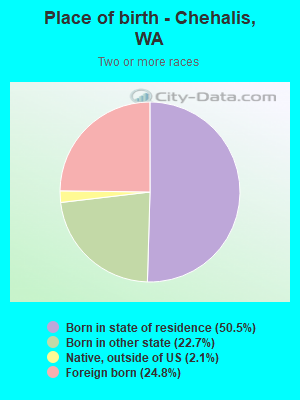
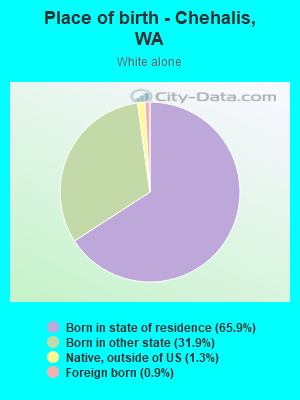
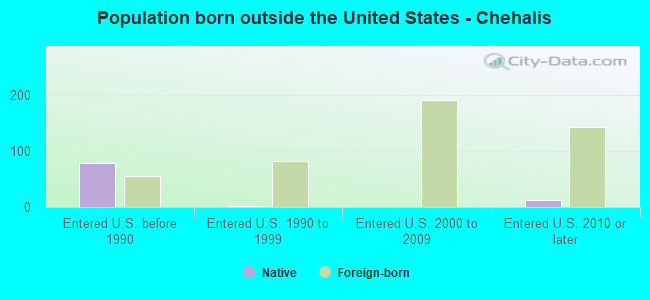
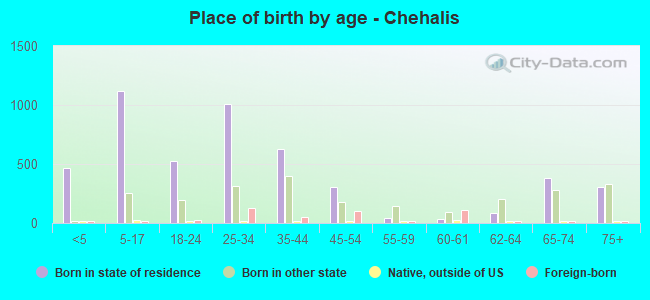
Children Nativity (place of birth) in Chehalis
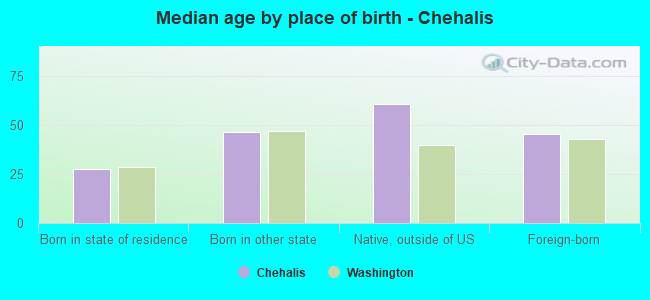
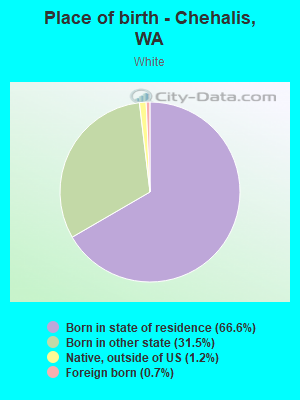
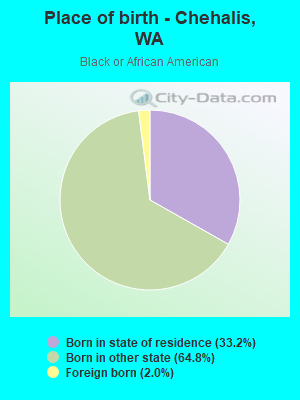
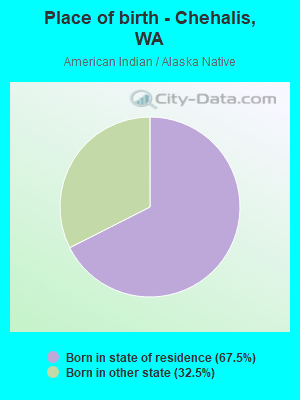
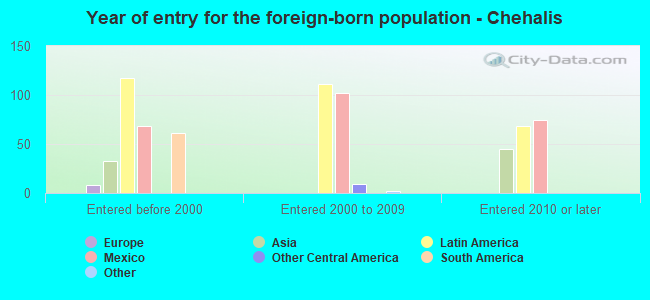
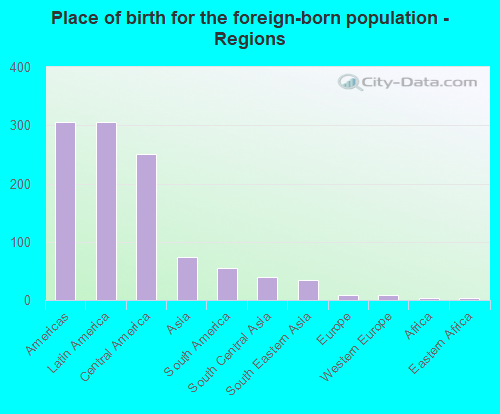
Place of birth for residents in Chehalis
![Place of birth for the foreign-born population - Regions]()
- 305Americas
- 305Latin America
- 250Central America
- 73Asia
- 55South America
- 39South Central Asia
- 34South Eastern Asia
- 9Europe
- 9Western Europe
- 3Africa
- 3Eastern Africa
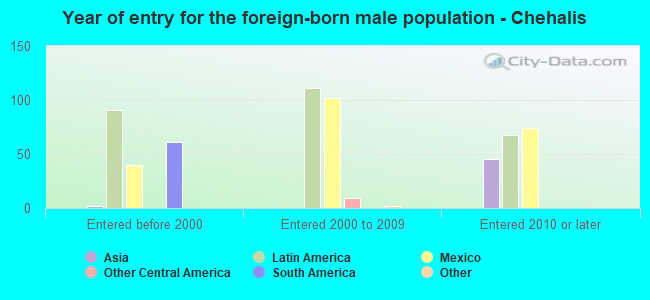
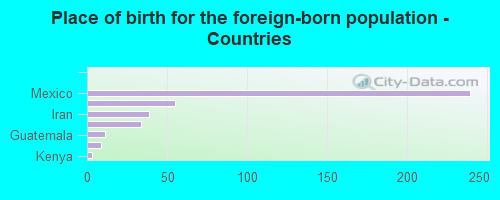
![Place of birth for the foreign-born population - Countries]()
- 239Mexico
- 55Peru
- 39Iran
- 34Philippines
- 11Guatemala
- 9Germany
- 3Kenya
Grandparents responsible for own grandchildren in Chehalis
Zip codes: 98532.