Races in Cherry Hill, Virginia (VA) Detailed Stats
Data:
Races - White alone (%)
Races - White alone (% change since 2000)
Races - Black alone (%)
Races - Black alone (% change since 2000)
Races - American Indian alone (%)
Races - American Indian alone (% change since 2000)
Races - Asian alone (%)
Races - Asian alone (% change since 2000)
Races - Hispanic (%)
Races - Hispanic (% change since 2000)
Races - Native Hawaiian and Other Pacific Islander alone (%)
Races - Native Hawaiian and Other Pacific Islander alone (% change since 2000)
Races - Two or more races(%)
Races - Two or more races(% change since 2000)
Races - Other race alone (%)
Races - Other race alone (% change since 2000)
Racial diversity
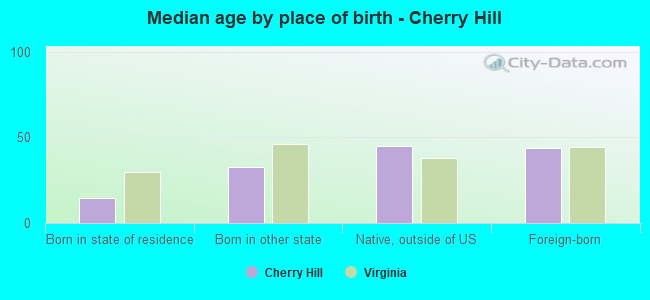
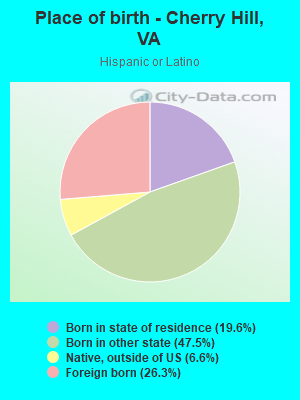
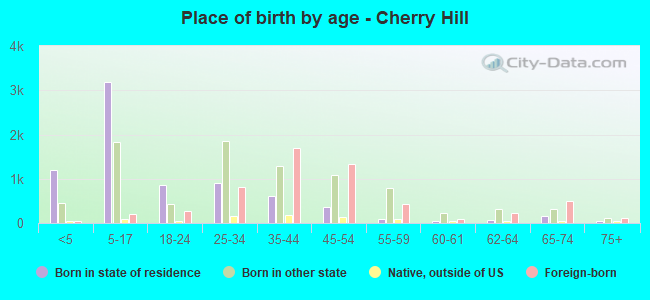
Place of birth - Born in state of residence (%)
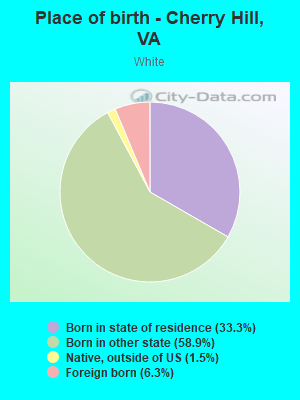
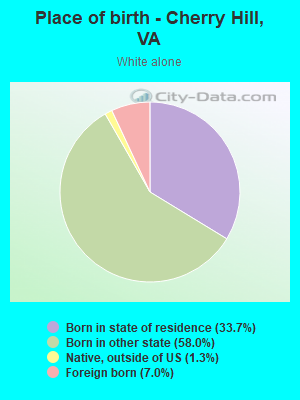
Place of birth - Born in state of residence (%) - White
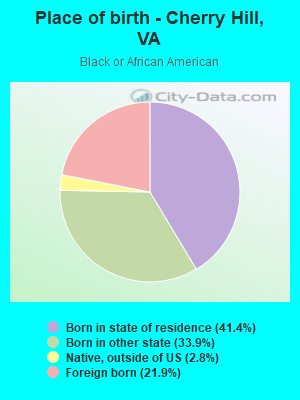
Place of birth - Born in state of residence (%) - Black or African American
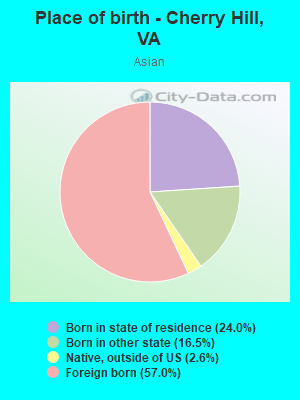
Place of birth - Born in state of residence (%) - Asian
Place of birth - Born in state of residence (%) - Hispanic or Latino
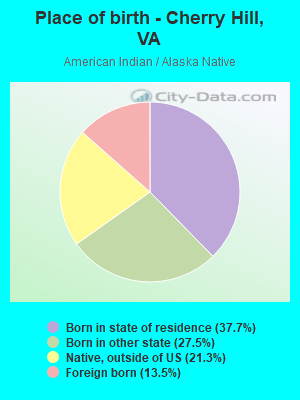
Place of birth - Born in state of residence (%) - American Indian and Alaska Native
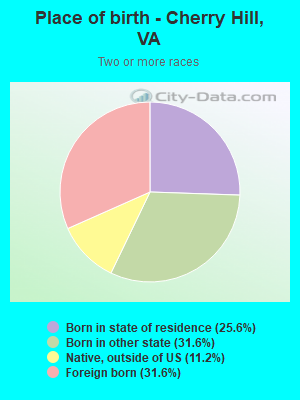
Place of birth - Born in state of residence (%) - Multirace
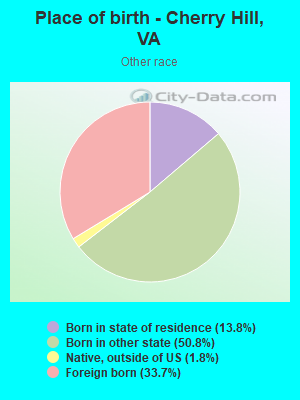
Place of birth - Born in state of residence (%) - Other Race
Place of birth - Born in other state (%)
Place of birth - Born in other state (%) - White
Place of birth - Born in other state (%) - Black or African American
Place of birth - Born in other state (%) - Asian
Place of birth - Born in other state (%) - Hispanic or Latino
Place of birth - Born in other state (%) - American Indian and Alaska Native
Place of birth - Born in other state (%) - Multirace
Place of birth - Born in other state (%) - Other Race
Place of birth - Native, outside of US (%)
Place of birth - Native, outside of US (%) - White
Place of birth - Native, outside of US (%) - Black or African American
Place of birth - Native, outside of US (%) - Asian
Place of birth - Native, outside of US (%) - Hispanic or Latino
Place of birth - Native, outside of US (%) - American Indian and Alaska Native
Place of birth - Native, outside of US (%) - Multirace
Place of birth - Native, outside of US (%) - Other Race
Place of birth - Foreign born (%)
Place of birth - Foreign born (%) - White
Place of birth - Foreign born (%) - Black or African American
Place of birth - Foreign born (%) - Asian
Place of birth - Foreign born (%) - Hispanic or Latino
Place of birth - Foreign born (%) - American Indian and Alaska Native
Place of birth - Foreign born (%) - Multirace
Place of birth - Foreign born (%) - Other Race
Residents speaking English at home (%)
Residents speaking English at home - Born in the United States (%)
Residents speaking English at home - Native, born elsewhere (%)
Residents speaking English at home - Foreign born (%)
Residents speaking Spanish at home (%)
Residents speaking Spanish at home - Born in the United States (%)
Residents speaking Spanish at home - Native, born elsewhere (%)
Residents speaking Spanish at home - Foreign born (%)
Residents speaking other language at home (%)
Residents speaking other language at home - Born in the United States (%)
Residents speaking other language at home - Native, born elsewhere (%)
Residents speaking other language at home - Foreign born (%)
Marital status - Never married (%)
Marital status - Now married (%)
Marital status - Separated (%)
Marital status - Widowed (%)
Marital status - Divorced (%)
Ancestries Reported - Arab (%)
Ancestries Reported - Czech (%)
Ancestries Reported - Danish (%)
Ancestries Reported - Dutch (%)
Ancestries Reported - English (%)
Ancestries Reported - French (%)
Ancestries Reported - French Canadian (%)
Ancestries Reported - German (%)
Ancestries Reported - Greek (%)
Ancestries Reported - Hungarian (%)
Ancestries Reported - Irish (%)
Ancestries Reported - Italian (%)
Ancestries Reported - Lithuanian (%)
Ancestries Reported - Norwegian (%)
Ancestries Reported - Polish (%)
Ancestries Reported - Portuguese (%)
Ancestries Reported - Russian (%)
Ancestries Reported - Scotch-Irish (%)
Ancestries Reported - Scottish (%)
Ancestries Reported - Slovak (%)
Ancestries Reported - Subsaharan African (%)
Ancestries Reported - Swedish (%)
Ancestries Reported - Swiss (%)
Ancestries Reported - Ukrainian (%)
Ancestries Reported - United States (%)
Ancestries Reported - Welsh (%)
Ancestries Reported - West Indian (%)
Ancestries Reported - Other (%)
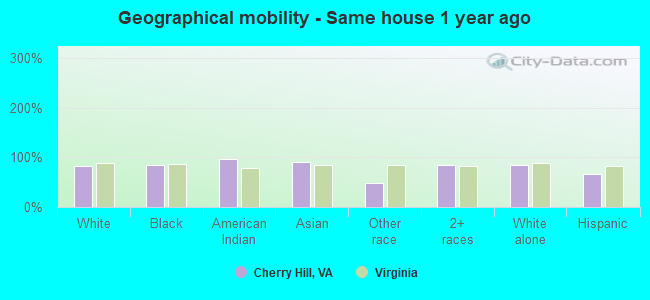
Geographical mobility - Same house 1 year ago (%)
Geographical mobility - Same house 1 year ago (%) - White
Geographical mobility - Same house 1 year ago (%) - Black or African American
Geographical mobility - Same house 1 year ago (%) - Asian
Geographical mobility - Same house 1 year ago (%) - Hispanic or Latino
Geographical mobility - Same house 1 year ago (%) - American Indian and Alaska Native
Geographical mobility - Same house 1 year ago (%) - Multirace
Geographical mobility - Same house 1 year ago (%) - Other Race
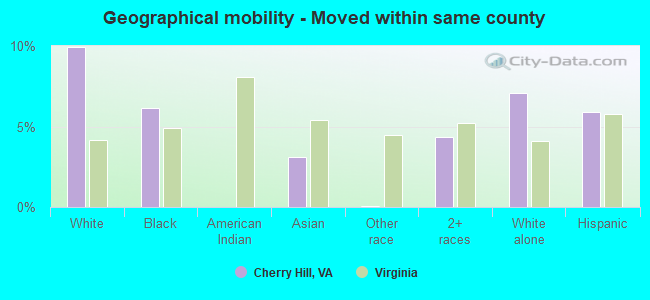
Geographical mobility - Moved within same county (%)
Geographical mobility - Moved within same county (%) - White
Geographical mobility - Moved within same county (%) - Black or African American
Geographical mobility - Moved within same county (%) - Asian
Geographical mobility - Moved within same county (%) - Hispanic or Latino
Geographical mobility - Moved within same county (%) - American Indian and Alaska Native
Geographical mobility - Moved within same county (%) - Multirace
Geographical mobility - Moved within same county (%) - Other Race
Geographical mobility - Moved from different county within same state (%)
Geographical mobility - Moved from different county within same state (%) - White
Geographical mobility - Moved from different county within same state (%) - Black or African American
Geographical mobility - Moved from different county within same state (%) - Asian
Geographical mobility - Moved from different county within same state (%) - Hispanic or Latino
Geographical mobility - Moved from different county within same state (%) - American Indian and Alaska Native
Geographical mobility - Moved from different county within same state (%) - Multirace
Geographical mobility - Moved from different county within same state (%) - Other Race
Geographical mobility - Moved from different state (%)
Geographical mobility - Moved from different state (%) - White
Geographical mobility - Moved from different state (%) - Black or African American
Geographical mobility - Moved from different state (%) - Asian
Geographical mobility - Moved from different state (%) - Hispanic or Latino
Geographical mobility - Moved from different state (%) - American Indian and Alaska Native
Geographical mobility - Moved from different state (%) - Multirace
Geographical mobility - Moved from different state (%) - Other Race
Geographical mobility - Moved from abroad (%)
Geographical mobility - Moved from abroad (%) - White
Geographical mobility - Moved from abroad (%) - Black or African American
Geographical mobility - Moved from abroad (%) - Asian
Geographical mobility - Moved from abroad (%) - Hispanic or Latino
Geographical mobility - Moved from abroad (%) - American Indian and Alaska Native
Geographical mobility - Moved from abroad (%) - Multirace
Geographical mobility - Moved from abroad (%) - Other Race
Place of birth for the foreign-born population - Ireland (%)
Place of birth for the foreign-born population - Denmark (%)
Place of birth for the foreign-born population - Norway (%)
Place of birth for the foreign-born population - Sweden (%)
Place of birth for the foreign-born population - United Kingdom (%)
Place of birth for the foreign-born population - England (%)
Place of birth for the foreign-born population - Scotland (%)
Place of birth for the foreign-born population - Other Northern Europe (%)
Place of birth for the foreign-born population - Austria (%)
Place of birth for the foreign-born population - Belgium (%)
Place of birth for the foreign-born population - France (%)
Place of birth for the foreign-born population - Germany (%)
Place of birth for the foreign-born population - Netherlands (%)
Place of birth for the foreign-born population - Switzerland (%)
Place of birth for the foreign-born population - Other Western Europe (%)
Place of birth for the foreign-born population - Greece (%)
Place of birth for the foreign-born population - Italy (%)
Place of birth for the foreign-born population - Portugal (%)
Place of birth for the foreign-born population - Spain (%)
Place of birth for the foreign-born population - Other Southern Europe (%)
Place of birth for the foreign-born population - Albania (%)
Place of birth for the foreign-born population - Belarus (%)
Place of birth for the foreign-born population - Bosnia and Herzegovina (%)
Place of birth for the foreign-born population - Bulgaria (%)
Place of birth for the foreign-born population - Croatia (%)
Place of birth for the foreign-born population - Czechoslovakia (%)
Place of birth for the foreign-born population - Hungary (%)
Place of birth for the foreign-born population - Latvia (%)
Place of birth for the foreign-born population - Lithuania (%)
Place of birth for the foreign-born population - North Macedonia (Macedonia) (%)
Place of birth for the foreign-born population - Moldova (%)
Place of birth for the foreign-born population - Poland (%)
Place of birth for the foreign-born population - Romania (%)
Place of birth for the foreign-born population - Russia (%)
Place of birth for the foreign-born population - Serbia (%)
Place of birth for the foreign-born population - Ukraine (%)
Place of birth for the foreign-born population - Other Eastern Europe (%)
Place of birth for the foreign-born population - China (%)
Place of birth for the foreign-born population - Hong Kong (%)
Place of birth for the foreign-born population - Taiwan (%)
Place of birth for the foreign-born population - Japan (%)
Place of birth for the foreign-born population - Korea (%)
Place of birth for the foreign-born population - Other Eastern Asia (%)
Place of birth for the foreign-born population - Afghanistan (%)
Place of birth for the foreign-born population - Bangladesh (%)
Place of birth for the foreign-born population - India (%)
Place of birth for the foreign-born population - Iran (%)
Place of birth for the foreign-born population - Kazakhstan (%)
Place of birth for the foreign-born population - Nepal (%)
Place of birth for the foreign-born population - Pakistan (%)
Place of birth for the foreign-born population - Sri Lanka (%)
Place of birth for the foreign-born population - Uzbekistan (%)
Place of birth for the foreign-born population - Other South Central Asia (%)
Place of birth for the foreign-born population - Burma (%)
Place of birth for the foreign-born population - Cambodia (%)
Place of birth for the foreign-born population - Indonesia (%)
Place of birth for the foreign-born population - Laos (%)
Place of birth for the foreign-born population - Malaysia (%)
Place of birth for the foreign-born population - Philippines (%)
Place of birth for the foreign-born population - Singapore (%)
Place of birth for the foreign-born population - Thailand (%)
Place of birth for the foreign-born population - Vietnam (%)
Place of birth for the foreign-born population - Other South Eastern Asia (%)
Place of birth for the foreign-born population - Armenia (%)
Place of birth for the foreign-born population - Iraq (%)
Place of birth for the foreign-born population - Israel (%)
Place of birth for the foreign-born population - Jordan (%)
Place of birth for the foreign-born population - Kuwait (%)
Place of birth for the foreign-born population - Lebanon (%)
Place of birth for the foreign-born population - Saudi Arabia (%)
Place of birth for the foreign-born population - Syria (%)
Place of birth for the foreign-born population - Turkey (%)
Place of birth for the foreign-born population - Yemen (%)
Place of birth for the foreign-born population - Other Western Asia (%)
Place of birth for the foreign-born population - Eritrea (%)
Place of birth for the foreign-born population - Ethiopia (%)
Place of birth for the foreign-born population - Kenya (%)
Place of birth for the foreign-born population - Somalia (%)
Place of birth for the foreign-born population - Uganda (%)
Place of birth for the foreign-born population - Zimbabwe (%)
Place of birth for the foreign-born population - Other Eastern Africa (%)
Place of birth for the foreign-born population - Cameroon (%)
Place of birth for the foreign-born population - Congo (%)
Place of birth for the foreign-born population - Democratic Republic of Congo (Zaire) (%)
Place of birth for the foreign-born population - Other Middle Africa (%)
Place of birth for the foreign-born population - Egypt (%)
Place of birth for the foreign-born population - Morocco (%)
Place of birth for the foreign-born population - Sudan (%)
Place of birth for the foreign-born population - Other Northern Africa (%)
Place of birth for the foreign-born population - South Africa (%)
Place of birth for the foreign-born population - Other Southern Africa (%)
Place of birth for the foreign-born population - Cabo Verde (%)
Place of birth for the foreign-born population - Ghana (%)
Place of birth for the foreign-born population - Liberia (%)
Place of birth for the foreign-born population - Nigeria (%)
Place of birth for the foreign-born population - Senegal (%)
Place of birth for the foreign-born population - Sierra Leone (%)
Place of birth for the foreign-born population - Other Western Africa (%)
Place of birth for the foreign-born population - Australia (%)
Place of birth for the foreign-born population - New Zealand (%)
Place of birth for the foreign-born population - Fiji (%)
Place of birth for the foreign-born population - Micronesia (%)
Place of birth for the foreign-born population - Bahamas (%)
Place of birth for the foreign-born population - Barbados (%)
Place of birth for the foreign-born population - Cuba (%)
Place of birth for the foreign-born population - Dominica (%)
Place of birth for the foreign-born population - Dominican Republic (%)
Place of birth for the foreign-born population - Grenada (%)
Place of birth for the foreign-born population - Haiti (%)
Place of birth for the foreign-born population - Jamaica (%)
Place of birth for the foreign-born population - St. Vincent and the Grenadines (%)
Place of birth for the foreign-born population - Trinidad and Tobago (%)
Place of birth for the foreign-born population - West Indies (%)
Place of birth for the foreign-born population - Other Caribbean (%)
Place of birth for the foreign-born population - Belize (%)
Place of birth for the foreign-born population - Costa Rica (%)
Place of birth for the foreign-born population - El Salvador (%)
Place of birth for the foreign-born population - Guatemala (%)
Place of birth for the foreign-born population - Honduras (%)
Place of birth for the foreign-born population - Mexico (%)
Place of birth for the foreign-born population - Nicaragua (%)
Place of birth for the foreign-born population - Panama (%)
Place of birth for the foreign-born population - Other Central America (%)
Place of birth for the foreign-born population - Argentina (%)
Place of birth for the foreign-born population - Bolivia (%)
Place of birth for the foreign-born population - Brazil (%)
Place of birth for the foreign-born population - Chile (%)
Place of birth for the foreign-born population - Colombia (%)
Place of birth for the foreign-born population - Ecuador (%)
Place of birth for the foreign-born population - Guyana (%)
Place of birth for the foreign-born population - Peru (%)
Place of birth for the foreign-born population - Uruguay (%)
Place of birth for the foreign-born population - Venezuela (%)
Place of birth for the foreign-born population - Other South America (%)
Place of birth for the foreign-born population - Canada (%)
Place of birth for the foreign-born population - Other Northern America (%)
Place of birth for the foreign-born population - Other (%)
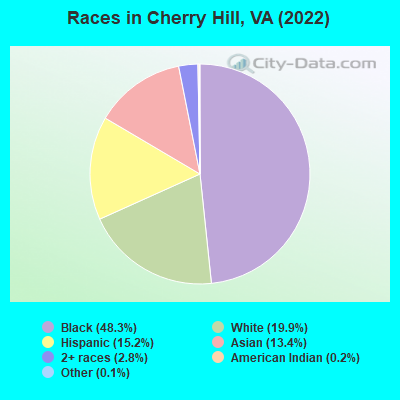
According to 2022 data, the most numerous races in Cherry Hill, VA are White alone (4,534 residents), Black alone (11,004 residents), and Hispanic (3,456 residents). 63.7% of Cherry Hill residents speak English at home.
Race distribution in Cherry Hill 11,004 48.3% Black alone 4,534 19.9% White alone 3,456 15.2% Hispanic 3,049 13.4% Asian alone 639 2.8% Two or more races 41 0.2% American Indian alone 32 0.1% Other race alone
2000 2022
4,965,637 70.2% White alone 1,376,378 19.4% Black alone 329,540 4.7% Hispanic 259,277 3.7% Asian alone 114,022 1.6% Two or more races 18,596 0.3% American Indian alone 11,685 0.2% Other race alone 3,380 0.05% Native Hawaiian and Other
5,095,130 58.7% White alone 1,594,785 18.4% Black alone 905,750 10.4% Hispanic 602,881 6.9% Asian alone 406,047 4.7% Two or more races 60,419 0.7% Other race alone 11,738 0.1% American Indian alone 6,869 0.08% Native Hawaiian and Other
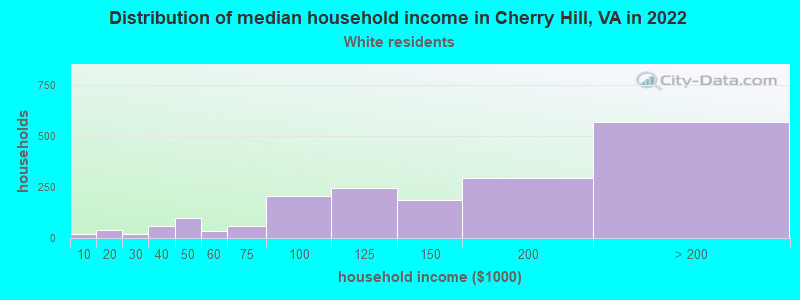
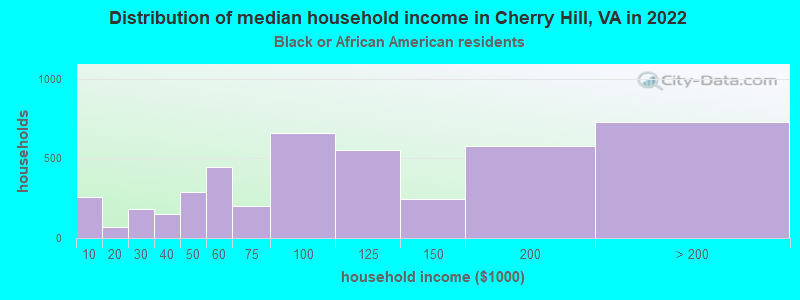
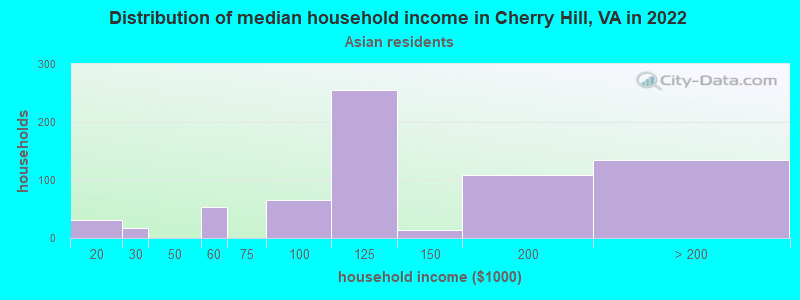
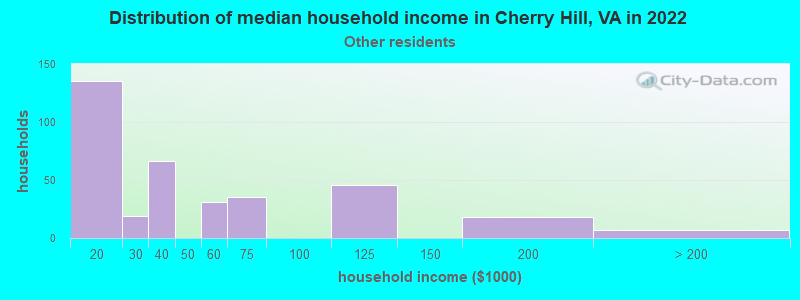
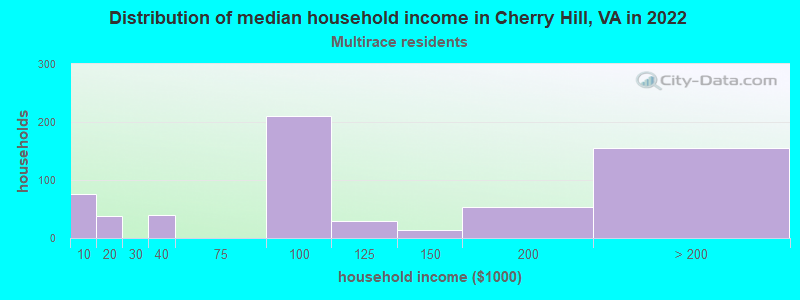
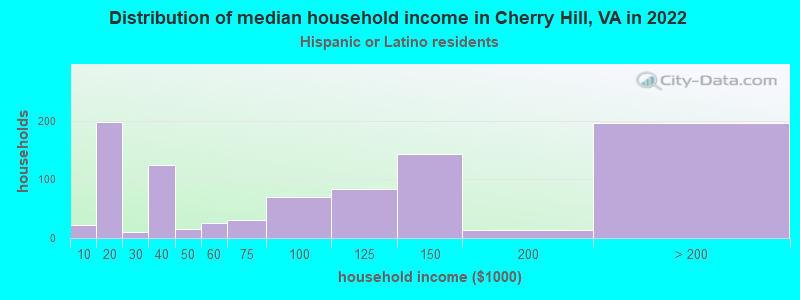
Income and house value in Cherry Hill Median household income in 2022 $161,928 White non-Hispanic householders$99,692 Black householders$135,473 Asian householders$94,551 Two or more races householders$106,491 Hispanic or Latino race householders
Median age by race in Cherry Hill
34.1 Median age for White residents33.9 34.4 32.2 Median age for Black or African American residents32.9 31.2 35.4 Median age for American Indian / Alaska Native residents36.2 37.5 34.6 Median age for Asian residents32.4 36.4 -611,955,419.9 Median age for Native Hawaiian / Pacific Islander residents-541,531,822.5 -714,150,046.8 26.6 Median age for Other race residents29.5 15.2 30.3 Median age for Two or more races residents24.7 41.4 35.4 Median age for White alone residents35.2 35.4 25.1 Median age for Hispanic or Latino residents26.7 23.8
Owner/renter occupied households by race in Cherry Hill
House owners and renters - White residents 1,379 75.1% Owner occupied457 24.9% Renter occupiedHouse owners and renters - Black or African American residents 2,163 52.1% Owner occupied1,986 47.9% Renter occupiedHouse owners and renters - American Indian / Alaska Native residents 63 57.3% Owner occupied47 42.7% Renter occupiedHouse owners and renters - Asian residents 465 69.1% Owner occupied208 30.9% Renter occupiedHouse owners and renters - Other race residents 103 28.9% Owner occupied253 71.1% Renter occupiedHouse owners and renters - Two or more races residents 480 79.8% Owner occupied121 20.2% Renter occupiedHouse owners and renters - White alone residents 1,299 74.6% Owner occupied442 25.4% Renter occupiedHouse owners and renters - Hispanic or Latino residents 491 57.8% Owner occupied358 42.2% Renter occupied
Language usage in Cherry Hill
English speakers - Total 63.7% of residents of Cherry Hill speak English at home.
9.0% of residents speak Spanish at home 1,383 72.9% Speak English very well514 27.1% Speak English less than very well27.9% of residents speak other language at home 4,143 70.6% Speak English very well1,723 29.4% Speak English less than very well
English speakers - Born in the United States 86.5% of residents of Cherry Hill speak English at home.
7.1% of residents speak Spanish at home 546 95.1% Speak English very well28 4.9% Speak English less than very well6.2% of residents speak other language at home 449 89.3% Speak English very well54 10.7% Speak English less than very well
English speakers - Native, born elsewhere 60.0% of residents of Cherry Hill speak English at home.
19.6% of residents speak Spanish at home 93 66.0% Speak English very well48 34.0% Speak English less than very well17.4% of residents speak other language at home 110 88.0% Speak English very well15 12.0% Speak English less than very well
English speakers - Foreign-born 14.0% of residents of Cherry Hill speak English at home.
13.7% of residents speak Spanish at home 424 54.1% Speak English very well360 45.9% Speak English less than very well72.4% of residents speak other language at home 2,591 62.4% Speak English very well1,564 37.6% Speak English less than very well
White (Caucasian) - Speak only English Native:
87.1% (3,707)Foreign-born:
25.6% (79)
White (Caucasian) - Speak another language Native:
10.8% (458)Foreign-born:
75.8% (233)
Black or African American - Speak only English Native:
93.3% (7,489)Foreign-born:
12.1% (301)
Black or African American - Speak another language Native:
6.8% (545)Foreign-born:
89.1% (2,218)
American Indian / Alaska Native - Speak another language Native:
42.4% (73)Foreign-born:
100.0% (22)
Asian - Speak only English Native:
26.6% (346)Foreign-born:
8.3% (146)
Asian - Speak another language Native:
77.4% (1,007)Foreign-born:
91.7% (1,603)
Other race - Speak only English Native:
77.5% (461)Foreign-born:
30.6% (143)
Other race - Speak another language Native:
21.8% (130)Foreign-born:
76.9% (359)
Two or more races - Speak only English Native:
59.1% (701)Foreign-born:
2.3% (15)
Two or more races - Speak another language Native:
44.3% (526)Foreign-born:
96.5% (610)
White alone - Speak only English Native:
94.9% (3,681)Foreign-born:
25.5% (80)
White alone - Speak another language Native:
4.9% (189)Foreign-born:
71.0% (223)
Hispanic or Latino - Speak only English Native:
50.0% (1,058)Foreign-born:
15.7% (149)
Hispanic or Latino - Speak another language Native:
50.6% (1,073)Foreign-born:
87.0% (829)
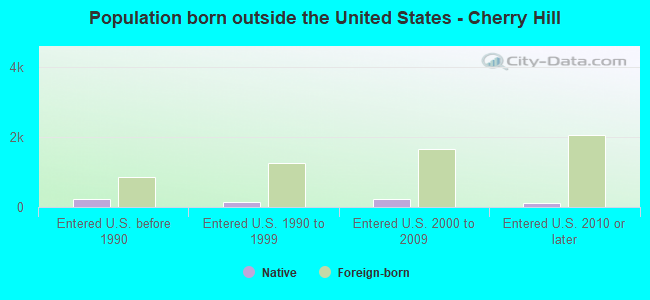
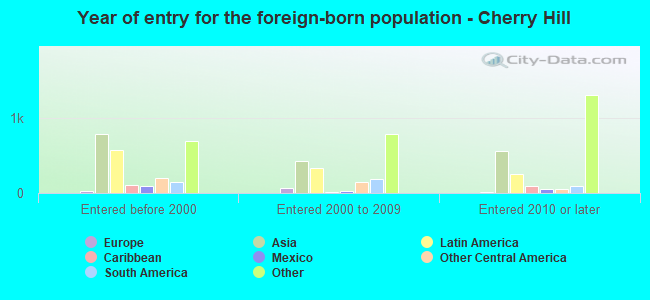
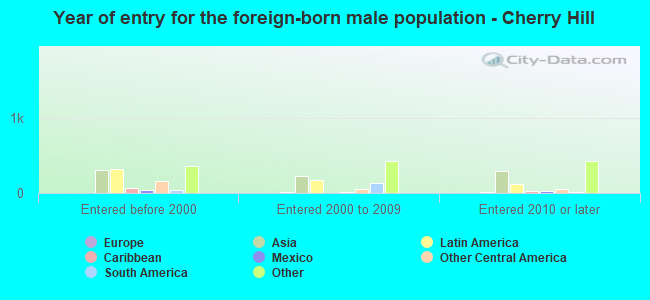
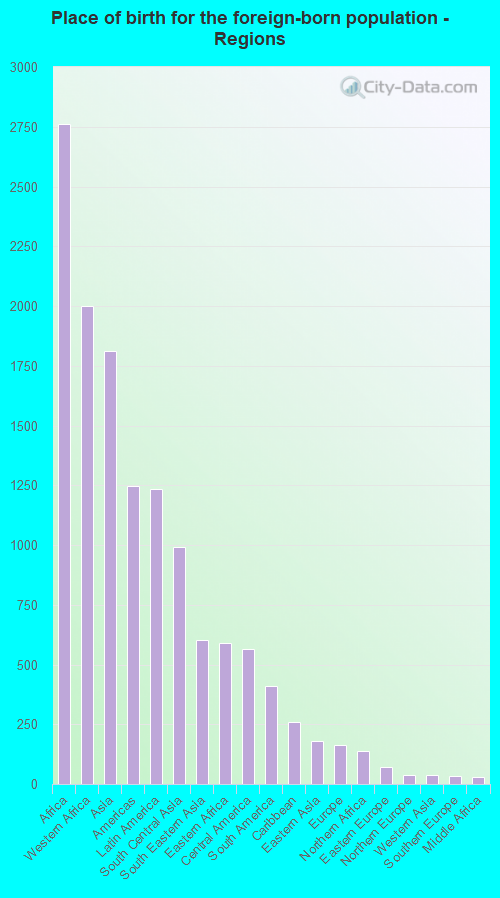
Foreign-born residents in Cherry Hill
Marital status for residents in Cherry Hill Marital status - White (Caucasian) population 15 years and over
Males 27.8% Never married61.3% Now married0.5% Separated0.0% Widowed10.4% DivorcedFemales 24.9% Never married51.7% Now married3.2% Separated3.8% Widowed16.5% DivorcedWomen who gave birth in the past 12 months Now married:
100.0% (58)Unmarried:
0.0% (0)
Women who did not give birth in the past 12 months Now married:
56.4% (725)Unmarried:
43.6% (560)
Marital status - Black or African American population 15 years and over
Males 37.0% Never married47.4% Now married3.4% Separated0.0% Widowed12.2% DivorcedFemales 45.0% Never married33.0% Now married3.9% Separated4.3% Widowed13.9% DivorcedWomen who gave birth in the past 12 months Now married:
91.4% (176)Unmarried:
8.6% (17)
Women who did not give birth in the past 12 months Now married:
33.2% (1,014)Unmarried:
66.8% (2,043)
Marital status - American Indian / Alaska Native population 15 years and over
Males 57.1% Never married42.9% Now married0.0% Separated0.0% Widowed0.0% DivorcedFemales 50.5% Never married49.5% Now married0.0% Separated0.0% Widowed0.0% DivorcedWomen who did not give birth in the past 12 months Now married:
50.0% (45)Unmarried:
50.0% (45)
Marital status - Asian population 15 years and over
Males 38.0% Never married58.5% Now married0.0% Separated2.4% Widowed1.1% DivorcedFemales 27.7% Never married57.7% Now married1.2% Separated1.7% Widowed11.7% DivorcedWomen who gave birth in the past 12 months Now married:
100.0% (41)Unmarried:
0.0% (0)
Women who did not give birth in the past 12 months Now married:
54.1% (485)Unmarried:
45.9% (411)
Marital status - Other race population 15 years and over
Males 14.3% Never married81.0% Now married0.0% Separated0.0% Widowed4.7% DivorcedFemales 19.8% Never married73.8% Now married0.0% Separated0.0% Widowed6.4% DivorcedWomen who did not give birth in the past 12 months Now married:
75.9% (167)Unmarried:
24.1% (53)
Marital status - Two or more races population 15 years and over
Males 37.2% Never married53.1% Now married0.0% Separated2.6% Widowed7.1% DivorcedFemales 31.4% Never married45.1% Now married0.0% Separated5.3% Widowed18.2% DivorcedWomen who gave birth in the past 12 months Now married:
100.0% (60)Unmarried:
0.0% (0)
Women who did not give birth in the past 12 months Now married:
45.7% (195)Unmarried:
54.3% (231)
Marital status - White alone, not Hispanic / Latino population 15 years and over
Males 25.1% Never married64.1% Now married0.0% Separated0.0% Widowed10.8% DivorcedFemales 18.2% Never married55.3% Now married2.3% Separated4.6% Widowed19.7% DivorcedWomen who gave birth in the past 12 months Now married:
100.0% (67)Unmarried:
0.0% (0)
Women who did not give birth in the past 12 months Now married:
62.3% (720)Unmarried:
37.7% (436)
Marital status - Hispanic or Latino population 15 years and over
Males 31.2% Never married56.9% Now married1.1% Separated0.9% Widowed9.8% DivorcedFemales 42.5% Never married41.2% Now married2.6% Separated2.6% Widowed11.2% DivorcedWomen who did not give birth in the past 12 months Now married:
43.1% (385)Unmarried:
56.9% (509)
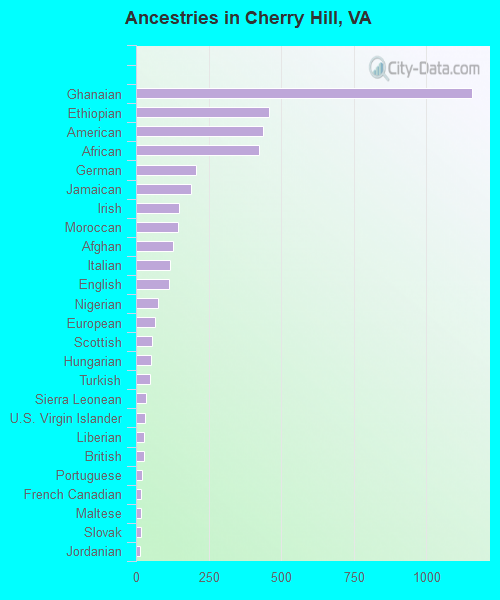
Ancestries in Cherry Hill
1,158 8.5% Ghanaian458 3.4% Ethiopian436 3.2% American423 3.1% African206 1.5% German191 1.4% Jamaican149 1.1% Irish143 1.1% Moroccan129 1.0% Afghan116 0.9% Italian114 0.8% English77 0.6% Nigerian67 0.5% European55 0.4% Scottish50 0.4% Hungarian47 0.3% Turkish35 0.3% Sierra Leonean30 0.2% U.S. Virgin Islander28 0.2% Liberian27 0.2% British22 0.2% Portuguese18 0.1% French Canadian16 0.1% Maltese16 0.1% Slovak14 0.1% Jordanian13 0.10% Yugoslavian10 0.07% Syrian9 0.07% Eastern European8 0.06% Danish7 0.05% Egyptian7 0.05% British West Indian
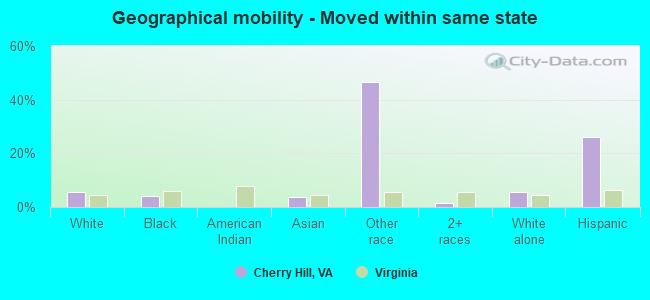
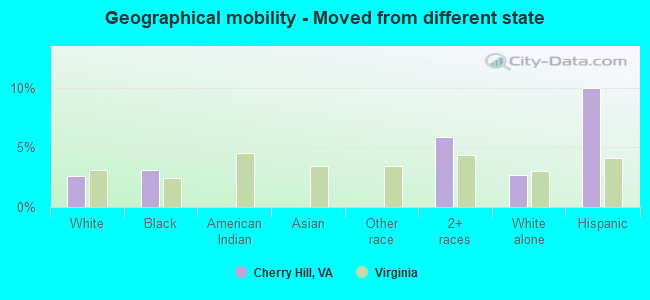
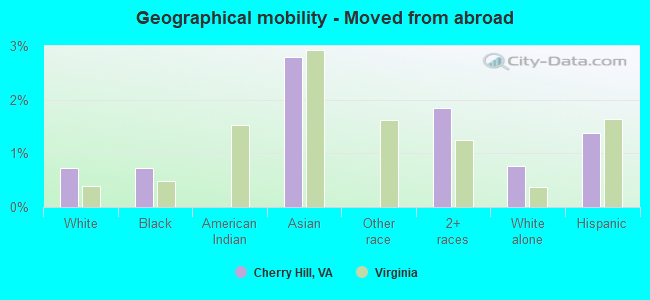
Geographical mobility in Cherry Hill Same house 1 year ago 3,830 81.7% White (Caucasian)9,624 85.2% Black or African American202 96.1% American Indian / Alaska Native2,772 90.8% Asian617 48.9% Other race1,671 85.1% Two or more races3,715 84.1% White alone, not Hispanic / Latino2,274 65.7% Hispanic or LatinoMoved within same county 465 9.9% White / Caucasian692 6.1% Black or African American94 3.1% Asian1 0.1% Other race85 4.4% Two or more races312 7.1% White alone, not Hispanic / Latino205 5.9% Hispanic or LatinoMoved within same state 255 5.5% White / Caucasian471 4.2% Black or African American116 3.8% Asian586 46.5% Other race26 1.3% Two or more races255 5.8% White alone, not Hispanic / Latino898 26.0% Hispanic or LatinoMoved from different state 121 2.6% White / Caucasian354 3.1% Black or African American115 5.9% Two or more races118 2.7% White alone, not Hispanic / Latino346 10.0% Hispanic or LatinoMoved from abroad 34 0.7% White83 0.7% Black or African American85 2.8% Asian36 1.8% Two or more races33 0.8% White alone, not Hispanic / Latino48 1.4% Hispanic or Latino
Children Nativity (place of birth) in Cherry Hill
Children under 6 years - Living with two parents Both parents native 763 100.0% NativeBoth parents foreign-born 305 100.0% NativeOne native, one foreign-born parent 300 100.0% NativeChildren under 6 years - Living with one parent Native parent 319 100.0% NativeForeign-born parent 195 100.0% NativeChildren 6 to 17 years - Living with two parents Both parents native 1,088 100.0% NativeBoth parents foreign-born 834 82.8% Native173 17.2% Foreign-bornOne native, one foreign-born parent 688 100.0% NativeChildren 6 to 17 years - Living with one parent Native parent 1,321 100.0% NativeForeign-born parent 934 49.3% Native962 50.7% Foreign-born
Grandparents responsible for own grandchildren in Cherry Hill
Grandparents (30 to 59 years) White / Caucasian 29 32.4% Responsible for grandchildren59 67.6% Not responsible for grandchildrenBlack or African American 66 51.3% Responsible for grandchildren62 48.7% Not responsible for grandchildrenAsian 8 100.0% Not responsible for grandchildrenTwo or more races 7 100.0% Responsible for grandchildrenWhite alone, not Hispanic / Latino 83 100.0% Not responsible for grandchildrenHispanic or Latino 67 100.0% Responsible for grandchildrenGrandparents (60 years and over) White / Caucasian 41 100.0% Not responsible for grandchildrenBlack or African American 113 53.2% Responsible for grandchildren99 46.8% Not responsible for grandchildrenAsian 6 8.7% Responsible for grandchildren64 91.3% Not responsible for grandchildrenTwo or more races 8 100.0% Not responsible for grandchildrenWhite alone, not Hispanic / Latino 53 100.0% Not responsible for grandchildrenHispanic or Latino 7 100.0% Not responsible for grandchildren