Races in Chesapeake Ranch Estates-Drum Point, Maryland (MD) Detailed Stats
Ancestries, Foreign-born residents, place of birth

Discuss Chesapeake Ranch Estates-Drum Point, Maryland races on our local forum with over 2,400,000 registered users
1.9% of Chesapeake Ranch Estates-Drum Point, MD residents are foreign-born , which is 732.8% less than the foreign-born rate of 16.0% across the entire state of Maryland.
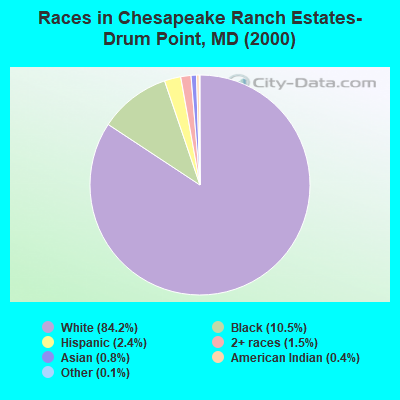
Race distribution in Chesapeake Ranch Estates-Drum Point

- 9,68884.2%White alone
- 1,20310.5%Black alone
- 2802.4%Hispanic
- 1741.5%Two or more races
- 960.8%Asian alone
- 410.4%American Indian alone
- 150.1%Other race alone
- 60.05%Native Hawaiian and Other
Pacific Islander alone
2000
2022
-
- 3,286,54762.1%White alone
- 1,464,73527.7%Black alone
- 227,9164.3%Hispanic
- 209,7384.0%Asian alone
- 82,9461.6%Two or more races
- 13,3120.3%American Indian alone
- 9,3790.2%Other race alone
- 1,9130.04%Native Hawaiian and Other
Pacific Islander alone

-
- 2,906,49247.1%White alone
- 1,800,91429.2%Black alone
- 705,84211.4%Hispanic
- 401,8186.5%Asian alone
- 291,3174.7%Two or more races
- 46,9300.8%Other race alone
- 8,9300.1%American Indian alone
- 2,4170.04%Native Hawaiian and Other
Pacific Islander alone

Income and house value in Chesapeake Ranch Estates-Drum Point
- Median household income in 2022
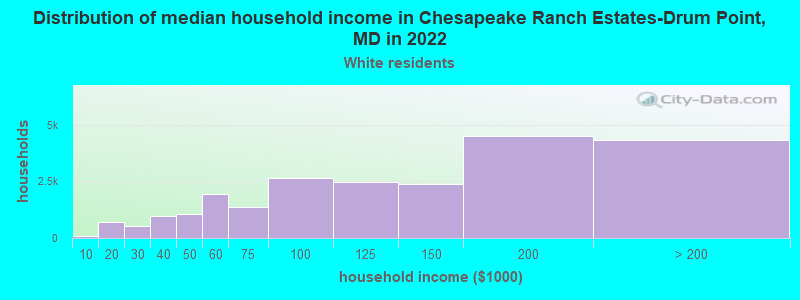
- $99,579White non-Hispanic householders
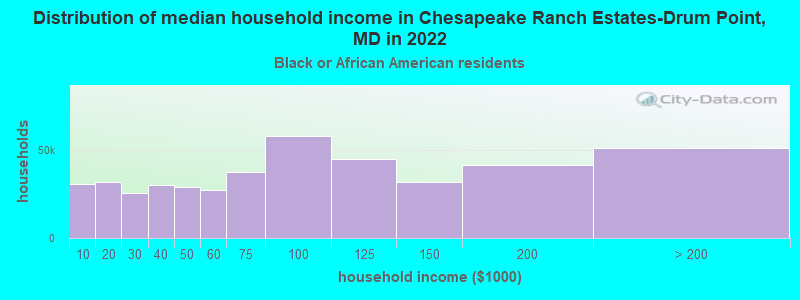
- $93,167Black householders
- $94,532Some other race householders
- over $200,000Two or more races householders
- over $200,000Hispanic or Latino race householders
- Median 2022 house value
- $325,834White Non-Hispanic householders
- $311,444Black or African American householders
- $353,329American Indian or Alaska Native householders
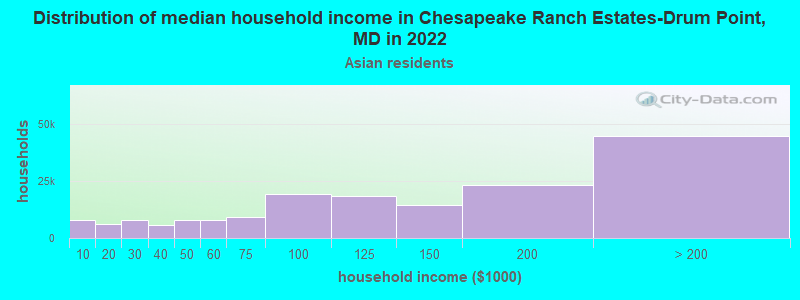
- $25,694Asian householders
- $396,243Some other race householders
- $256,196Two or more races householders
- $372,602Hispanic or Latino householders
Household income for White non-Hispanic householders
Household income for Black householders
Household income for American Indian and Alaska Native householders

Household income for Asian householders
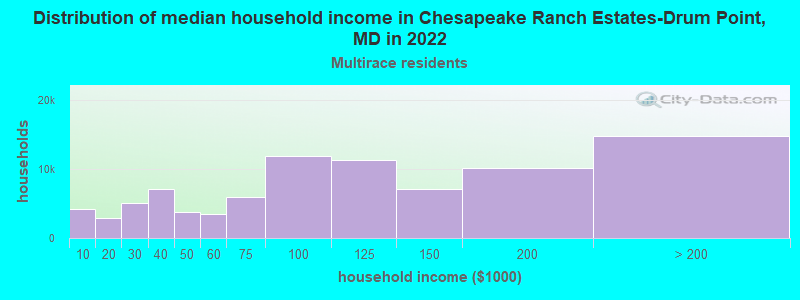
Household income for Two or more races householders
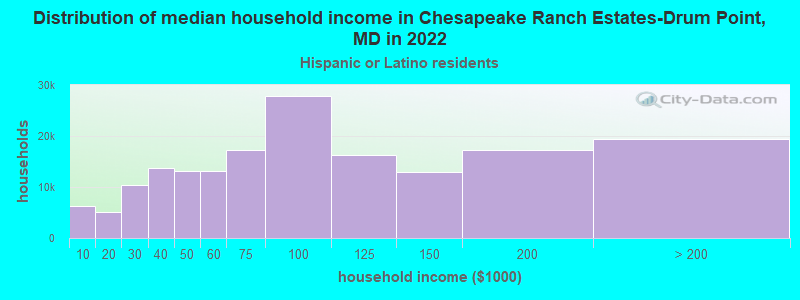
Household income for Hispanic or Latino race householders
Foreign-born residents in Chesapeake Ranch Estates-Drum Point
221 residents are foreign born
| This city: | 1.9% |
| Maryland: | 9.8% |
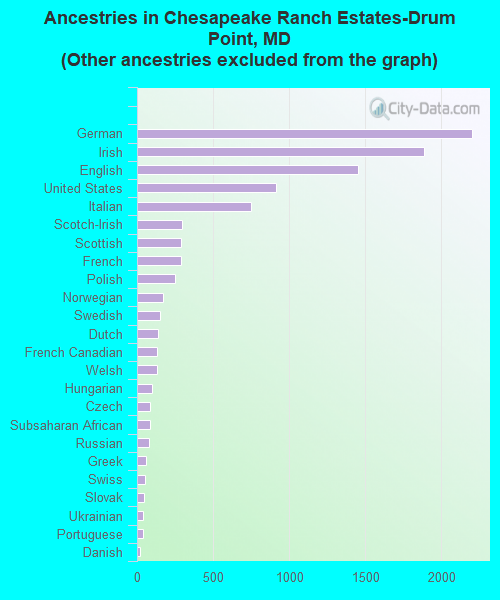
Ancestries in Chesapeake Ranch Estates-Drum Point

- 2,51320.6%Other
- 2,20318.1%German
- 1,88915.5%Irish
- 1,45411.9%English
- 9137.5%United States
- 7486.1%Italian
- 2972.4%Scotch-Irish
- 2892.4%Scottish
- 2882.4%French
- 2482.0%Polish
- 1681.4%Norwegian
- 1511.2%Swedish
- 1351.1%Dutch
- 1341.1%French Canadian
- 1301.1%Welsh
- 990.8%Hungarian
- 860.7%Czech
- 850.7%Subsaharan African
- 760.6%Russian
- 560.5%Greek
- 500.4%Swiss
- 440.4%Slovak
- 410.3%Ukrainian
- 390.3%Portuguese
- 220.2%Danish
- 200.2%Arab
- 180.1%Lithuanian
Zip codes: 20657.