Races in Chili, New York (NY) Detailed Stats
Ancestries, Foreign-born residents, place of birth
6.5% of Chili, NY residents are foreign-born (3.1% born in Europe, 1.6% born in Asia, 1.0% born in Latin America), which is 235.9% less than the foreign-born rate of 22.0% across the entire state of New York.
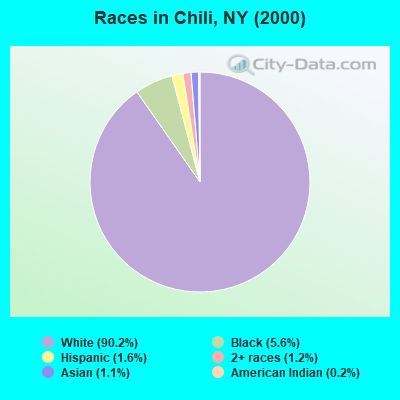
Race distribution in Chili

- 24,92690.2%White alone
- 1,5465.6%Black alone
- 4561.6%Hispanic
- 3201.2%Two or more races
- 3081.1%Asian alone
- 590.2%American Indian alone
- 170.06%Other race alone
- 60.02%Native Hawaiian and Other
Pacific Islander alone
2000
2022
-
- 11,760,98162.0%White alone
- 2,867,58315.1%Hispanic
- 2,812,62314.8%Black alone
- 1,035,9265.5%Asian alone
- 366,1161.9%Two or more races
- 75,4990.4%Other race alone
- 52,4990.3%American Indian alone
- 5,2300.03%Native Hawaiian and Other
Pacific Islander alone

-
- 10,408,93352.9%White alone
- 3,867,29919.7%Hispanic
- 2,633,84013.4%Black alone
- 1,776,2869.0%Asian alone
- 732,6703.7%Two or more races
- 216,1101.1%Other race alone
- 35,0820.2%American Indian alone
- 6,9310.04%Native Hawaiian and Other
Pacific Islander alone

Income and house value in Chili
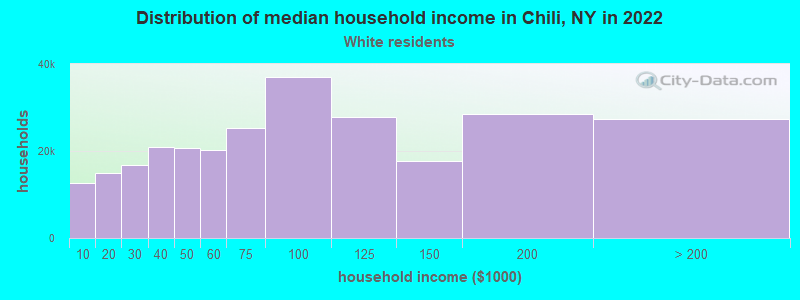
- Median household income in 2022
- $86,729White non-Hispanic householders
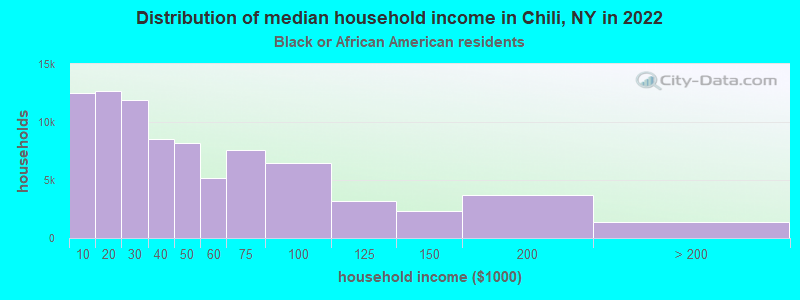
- $68,476Black householders
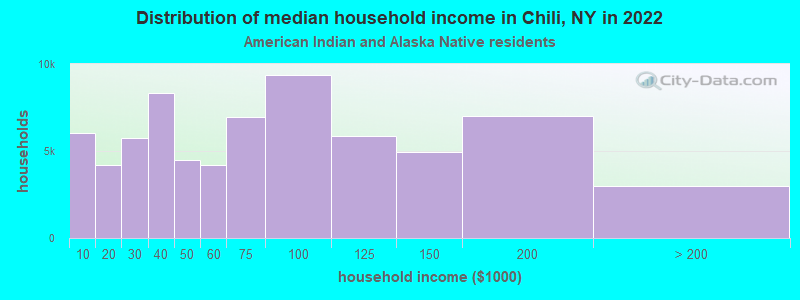
- $115,169American Indian and Alaska Native householders
- $93,764Asian householders
- $79,521Some other race householders
- $68,114Two or more races householders
- $79,707Hispanic or Latino race householders
- Median 2022 house value
- $207,028White Non-Hispanic householders
- $211,307Black or African American householders
- $315,636American Indian or Alaska Native householders
- $187,466Asian householders
- $229,238Some other race householders
- $218,642Two or more races householders
- $205,397Hispanic or Latino householders
Household income for White non-Hispanic householders
Household income for Black householders
Household income for American Indian and Alaska Native householders
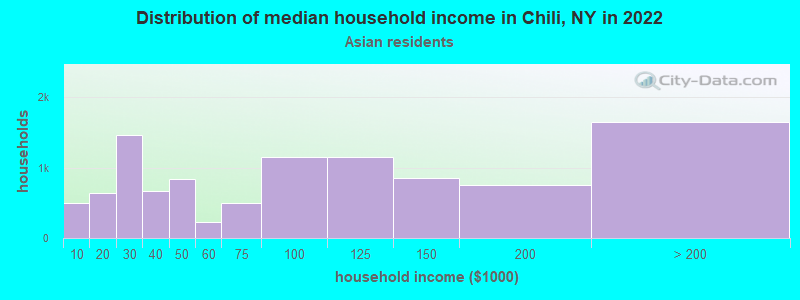
Household income for Asian householders
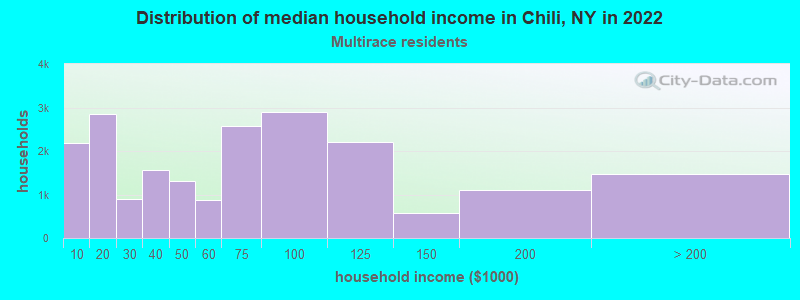
Household income for Two or more races householders
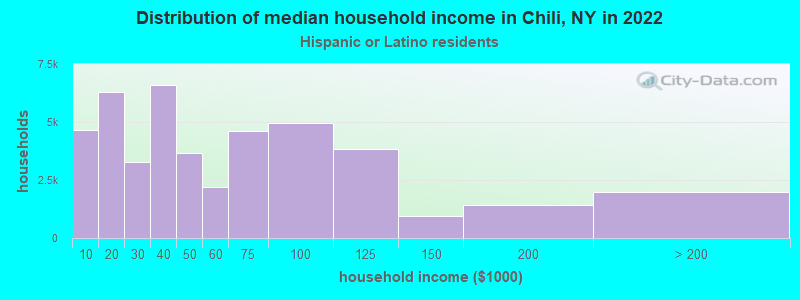
Household income for Hispanic or Latino race householders
Foreign-born residents in Chili
1,810 residents are foreign born (3.1% Europe, 1.6% Asia, 1.0% Latin America).
| This city: | 6.5% |
| New York: | 20.4% |
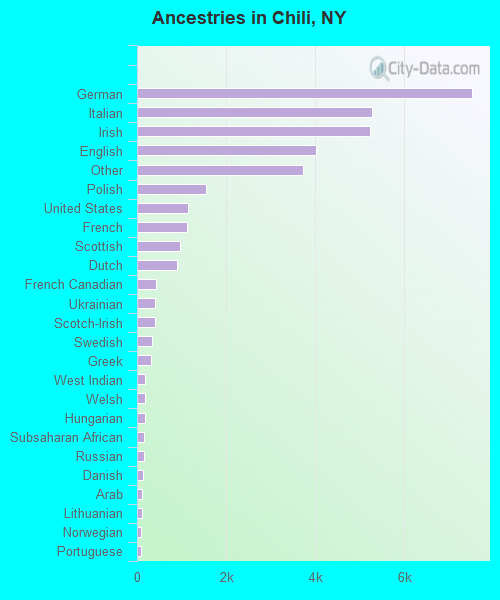
Ancestries in Chili

- 7,52221.6%German
- 5,27115.1%Italian
- 5,22315.0%Irish
- 4,00711.5%English
- 3,71510.6%Other
- 1,5374.4%Polish
- 1,1513.3%United States
- 1,1133.2%French
- 9582.7%Scottish
- 8872.5%Dutch
- 4161.2%French Canadian
- 4131.2%Ukrainian
- 4011.1%Scotch-Irish
- 3270.9%Swedish
- 3180.9%Greek
- 1880.5%West Indian
- 1860.5%Welsh
- 1790.5%Hungarian
- 1530.4%Subsaharan African
- 1520.4%Russian
- 1380.4%Danish
- 1220.3%Arab
- 1160.3%Lithuanian
- 920.3%Norwegian
- 920.3%Portuguese
- 780.2%Slovak
- 770.2%Swiss
- 560.2%Czech
Zip codes: 14624.