Races in Chippewa Lake, Ohio (OH) Detailed Stats
Ancestries, Foreign-born residents, place of birth

Data:
1.3% of Chippewa Lake, OH residents are foreign-born , which is 199.3% less than the foreign-born rate of 4.0% across the entire state of Ohio.
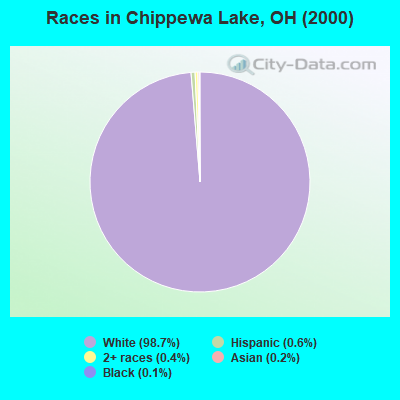
Race distribution in Chippewa Lake

- 81298.7%White alone
- 50.6%Hispanic
- 30.4%Two or more races
- 20.2%Asian alone
- 10.1%Black alone
2000
2022
-
- 9,538,11184.0%White alone
- 1,290,66211.4%Black alone
- 217,1231.9%Hispanic
- 137,7701.2%Two or more races
- 131,6701.2%Asian alone
- 21,9850.2%American Indian alone
- 13,4830.1%Other race alone
- 2,3360.02%Native Hawaiian and Other
Pacific Islander alone
-
- 8,948,79376.1%White alone
- 1,401,40311.9%Black alone
- 529,2914.5%Two or more races
- 517,2324.4%Hispanic
- 293,3872.5%Asian alone
- 52,8050.4%Other race alone
- 9,7850.08%American Indian alone
- 3,3620.03%Native Hawaiian and Other
Pacific Islander alone
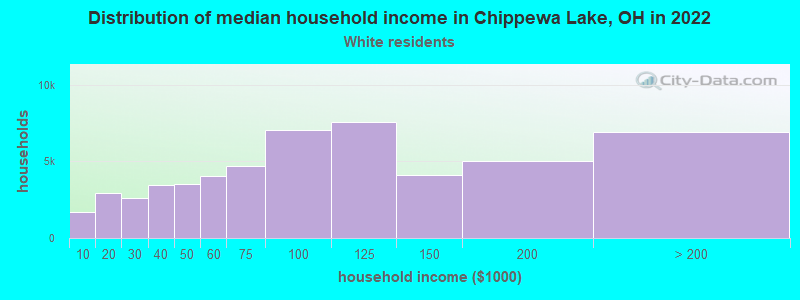
Income and house value in Chippewa Lake
- Median household income in 2022
- $69,052White non-Hispanic householders
- Median 2022 house value
- $183,135White Non-Hispanic householders
Household income for White non-Hispanic householders

Foreign-born residents in Chippewa Lake
11 residents are foreign born
Ancestries in Chippewa Lake

- 28128.6%German
- 13613.9%Irish
- 13013.3%English
- 909.2%Other
- 606.1%Italian
- 464.7%Polish
- 424.3%United States
- 343.5%French
- 242.4%Scottish
- 202.0%Czech
- 181.8%French Canadian
- 181.8%Scotch-Irish
- 161.6%Swedish
- 111.1%Hungarian
- 111.1%Ukrainian
- 90.9%Slovak
- 90.9%Welsh
- 80.8%Swiss
- 60.6%Dutch
- 40.4%Russian
- 20.2%Danish
- 20.2%Greek
- 20.2%Lithuanian
- 20.2%Norwegian