Races in Cinco Ranch, Texas (TX) Detailed Stats
Data:
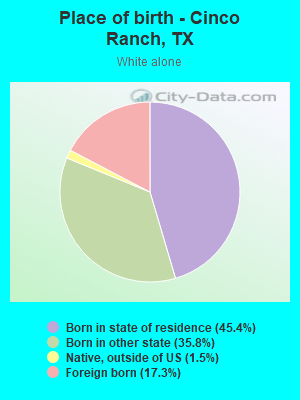
Races - White alone (%)
Races - White alone (% change since 2000)
Races - Black alone (%)
Races - Black alone (% change since 2000)
Races - American Indian alone (%)
Races - American Indian alone (% change since 2000)
Races - Asian alone (%)
Races - Asian alone (% change since 2000)
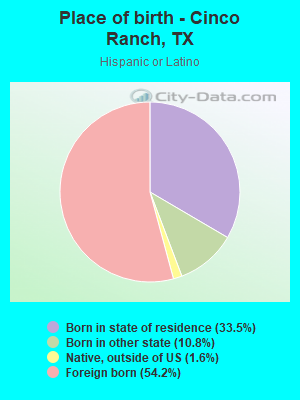
Races - Hispanic (%)
Races - Hispanic (% change since 2000)
Races - Native Hawaiian and Other Pacific Islander alone (%)
Races - Native Hawaiian and Other Pacific Islander alone (% change since 2000)
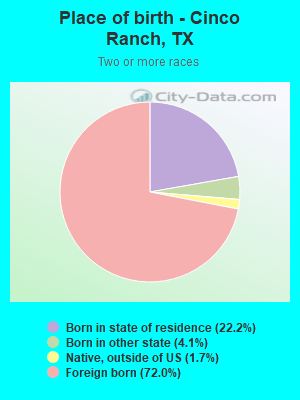
Races - Two or more races(%)
Races - Two or more races(% change since 2000)
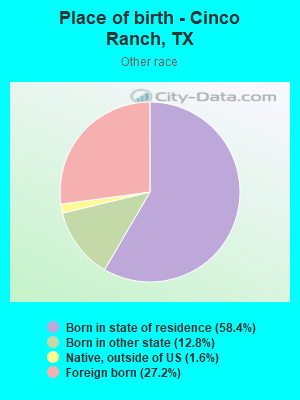
Races - Other race alone (%)
Races - Other race alone (% change since 2000)
Racial diversity
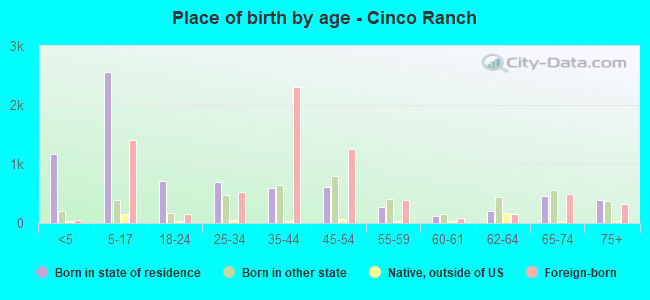
Place of birth - Born in state of residence (%)
Place of birth - Born in state of residence (%) - White
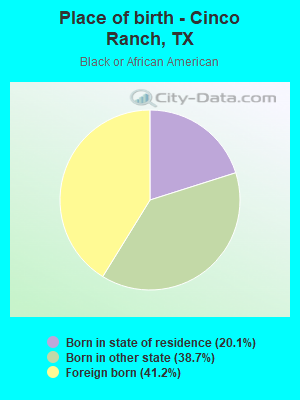
Place of birth - Born in state of residence (%) - Black or African American
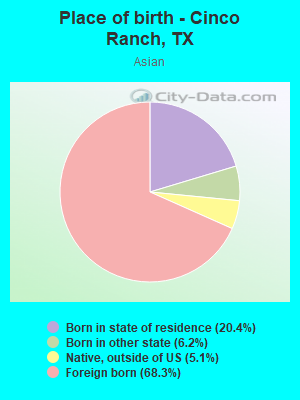
Place of birth - Born in state of residence (%) - Asian
Place of birth - Born in state of residence (%) - Hispanic or Latino
Place of birth - Born in state of residence (%) - American Indian and Alaska Native
Place of birth - Born in state of residence (%) - Multirace
Place of birth - Born in state of residence (%) - Other Race
Place of birth - Born in other state (%)
Place of birth - Born in other state (%) - White
Place of birth - Born in other state (%) - Black or African American
Place of birth - Born in other state (%) - Asian
Place of birth - Born in other state (%) - Hispanic or Latino
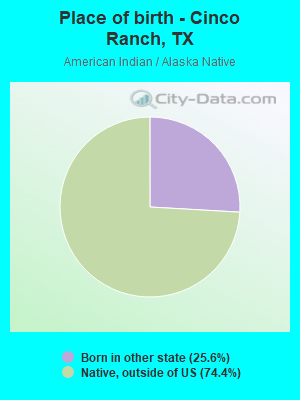
Place of birth - Born in other state (%) - American Indian and Alaska Native
Place of birth - Born in other state (%) - Multirace
Place of birth - Born in other state (%) - Other Race
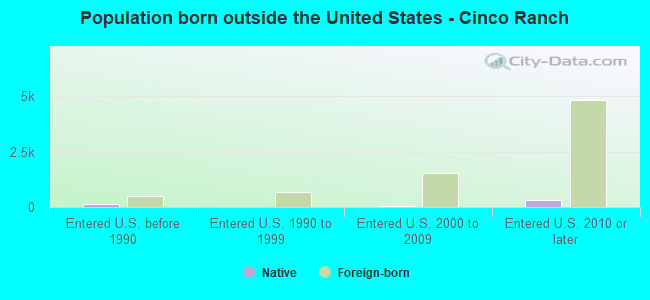
Place of birth - Native, outside of US (%)
Place of birth - Native, outside of US (%) - White
Place of birth - Native, outside of US (%) - Black or African American
Place of birth - Native, outside of US (%) - Asian
Place of birth - Native, outside of US (%) - Hispanic or Latino
Place of birth - Native, outside of US (%) - American Indian and Alaska Native
Place of birth - Native, outside of US (%) - Multirace
Place of birth - Native, outside of US (%) - Other Race
Place of birth - Foreign born (%)
Place of birth - Foreign born (%) - White
Place of birth - Foreign born (%) - Black or African American
Place of birth - Foreign born (%) - Asian
Place of birth - Foreign born (%) - Hispanic or Latino
Place of birth - Foreign born (%) - American Indian and Alaska Native
Place of birth - Foreign born (%) - Multirace
Place of birth - Foreign born (%) - Other Race
Residents speaking English at home (%)
Residents speaking English at home - Born in the United States (%)
Residents speaking English at home - Native, born elsewhere (%)
Residents speaking English at home - Foreign born (%)
Residents speaking Spanish at home (%)
Residents speaking Spanish at home - Born in the United States (%)
Residents speaking Spanish at home - Native, born elsewhere (%)
Residents speaking Spanish at home - Foreign born (%)
Residents speaking other language at home (%)
Residents speaking other language at home - Born in the United States (%)
Residents speaking other language at home - Native, born elsewhere (%)
Residents speaking other language at home - Foreign born (%)
Marital status - Never married (%)
Marital status - Now married (%)
Marital status - Separated (%)
Marital status - Widowed (%)
Marital status - Divorced (%)
Ancestries Reported - Arab (%)
Ancestries Reported - Czech (%)
Ancestries Reported - Danish (%)
Ancestries Reported - Dutch (%)
Ancestries Reported - English (%)
Ancestries Reported - French (%)
Ancestries Reported - French Canadian (%)
Ancestries Reported - German (%)
Ancestries Reported - Greek (%)
Ancestries Reported - Hungarian (%)
Ancestries Reported - Irish (%)
Ancestries Reported - Italian (%)
Ancestries Reported - Lithuanian (%)
Ancestries Reported - Norwegian (%)
Ancestries Reported - Polish (%)
Ancestries Reported - Portuguese (%)
Ancestries Reported - Russian (%)
Ancestries Reported - Scotch-Irish (%)
Ancestries Reported - Scottish (%)
Ancestries Reported - Slovak (%)
Ancestries Reported - Subsaharan African (%)
Ancestries Reported - Swedish (%)
Ancestries Reported - Swiss (%)
Ancestries Reported - Ukrainian (%)
Ancestries Reported - United States (%)
Ancestries Reported - Welsh (%)
Ancestries Reported - West Indian (%)
Ancestries Reported - Other (%)
Geographical mobility - Same house 1 year ago (%)
Geographical mobility - Same house 1 year ago (%) - White
Geographical mobility - Same house 1 year ago (%) - Black or African American
Geographical mobility - Same house 1 year ago (%) - Asian
Geographical mobility - Same house 1 year ago (%) - Hispanic or Latino
Geographical mobility - Same house 1 year ago (%) - American Indian and Alaska Native
Geographical mobility - Same house 1 year ago (%) - Multirace
Geographical mobility - Same house 1 year ago (%) - Other Race
Geographical mobility - Moved within same county (%)
Geographical mobility - Moved within same county (%) - White
Geographical mobility - Moved within same county (%) - Black or African American
Geographical mobility - Moved within same county (%) - Asian
Geographical mobility - Moved within same county (%) - Hispanic or Latino
Geographical mobility - Moved within same county (%) - American Indian and Alaska Native
Geographical mobility - Moved within same county (%) - Multirace
Geographical mobility - Moved within same county (%) - Other Race
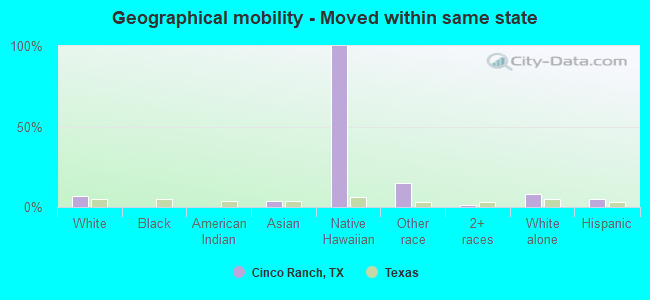
Geographical mobility - Moved from different county within same state (%)
Geographical mobility - Moved from different county within same state (%) - White
Geographical mobility - Moved from different county within same state (%) - Black or African American
Geographical mobility - Moved from different county within same state (%) - Asian
Geographical mobility - Moved from different county within same state (%) - Hispanic or Latino
Geographical mobility - Moved from different county within same state (%) - American Indian and Alaska Native
Geographical mobility - Moved from different county within same state (%) - Multirace
Geographical mobility - Moved from different county within same state (%) - Other Race
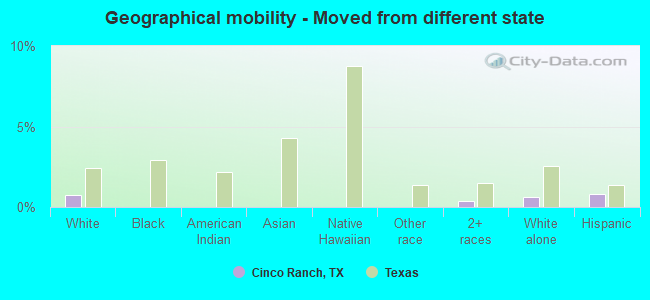
Geographical mobility - Moved from different state (%)
Geographical mobility - Moved from different state (%) - White
Geographical mobility - Moved from different state (%) - Black or African American
Geographical mobility - Moved from different state (%) - Asian
Geographical mobility - Moved from different state (%) - Hispanic or Latino
Geographical mobility - Moved from different state (%) - American Indian and Alaska Native
Geographical mobility - Moved from different state (%) - Multirace
Geographical mobility - Moved from different state (%) - Other Race
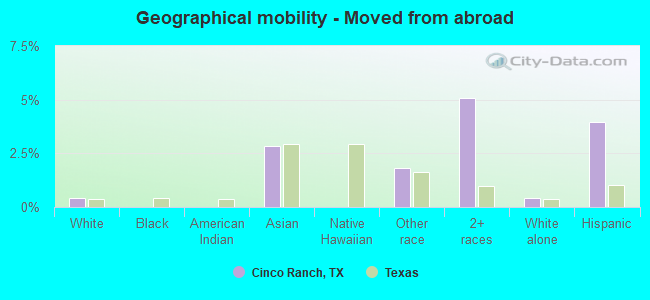
Geographical mobility - Moved from abroad (%)
Geographical mobility - Moved from abroad (%) - White
Geographical mobility - Moved from abroad (%) - Black or African American
Geographical mobility - Moved from abroad (%) - Asian
Geographical mobility - Moved from abroad (%) - Hispanic or Latino
Geographical mobility - Moved from abroad (%) - American Indian and Alaska Native
Geographical mobility - Moved from abroad (%) - Multirace
Geographical mobility - Moved from abroad (%) - Other Race
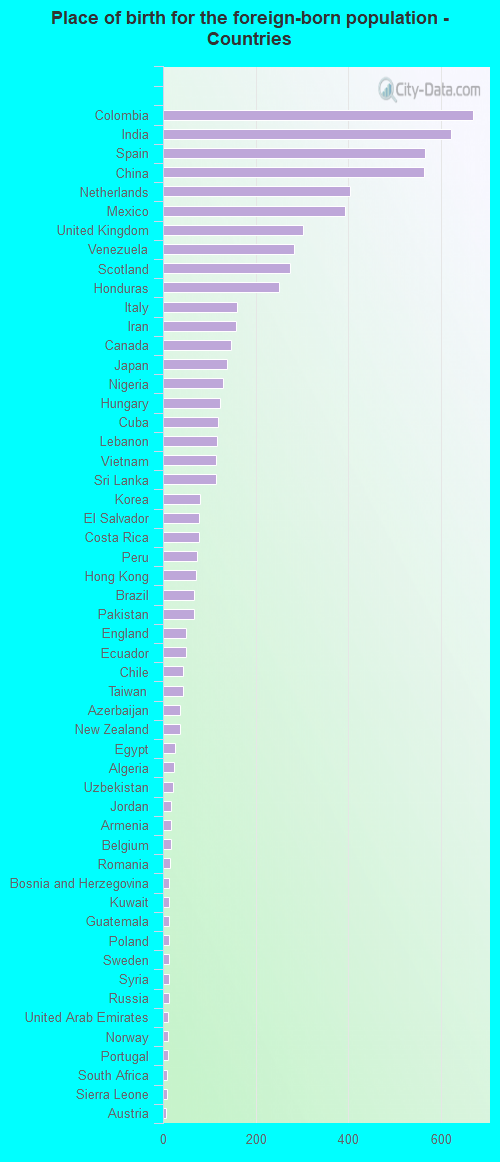
Place of birth for the foreign-born population - Ireland (%)
Place of birth for the foreign-born population - Denmark (%)
Place of birth for the foreign-born population - Norway (%)
Place of birth for the foreign-born population - Sweden (%)
Place of birth for the foreign-born population - United Kingdom (%)
Place of birth for the foreign-born population - England (%)
Place of birth for the foreign-born population - Scotland (%)
Place of birth for the foreign-born population - Other Northern Europe (%)
Place of birth for the foreign-born population - Austria (%)
Place of birth for the foreign-born population - Belgium (%)
Place of birth for the foreign-born population - France (%)
Place of birth for the foreign-born population - Germany (%)
Place of birth for the foreign-born population - Netherlands (%)
Place of birth for the foreign-born population - Switzerland (%)
Place of birth for the foreign-born population - Other Western Europe (%)
Place of birth for the foreign-born population - Greece (%)
Place of birth for the foreign-born population - Italy (%)
Place of birth for the foreign-born population - Portugal (%)
Place of birth for the foreign-born population - Spain (%)
Place of birth for the foreign-born population - Other Southern Europe (%)
Place of birth for the foreign-born population - Albania (%)
Place of birth for the foreign-born population - Belarus (%)
Place of birth for the foreign-born population - Bosnia and Herzegovina (%)
Place of birth for the foreign-born population - Bulgaria (%)
Place of birth for the foreign-born population - Croatia (%)
Place of birth for the foreign-born population - Czechoslovakia (%)
Place of birth for the foreign-born population - Hungary (%)
Place of birth for the foreign-born population - Latvia (%)
Place of birth for the foreign-born population - Lithuania (%)
Place of birth for the foreign-born population - North Macedonia (Macedonia) (%)
Place of birth for the foreign-born population - Moldova (%)
Place of birth for the foreign-born population - Poland (%)
Place of birth for the foreign-born population - Romania (%)
Place of birth for the foreign-born population - Russia (%)
Place of birth for the foreign-born population - Serbia (%)
Place of birth for the foreign-born population - Ukraine (%)
Place of birth for the foreign-born population - Other Eastern Europe (%)
Place of birth for the foreign-born population - China (%)
Place of birth for the foreign-born population - Hong Kong (%)
Place of birth for the foreign-born population - Taiwan (%)
Place of birth for the foreign-born population - Japan (%)
Place of birth for the foreign-born population - Korea (%)
Place of birth for the foreign-born population - Other Eastern Asia (%)
Place of birth for the foreign-born population - Afghanistan (%)
Place of birth for the foreign-born population - Bangladesh (%)
Place of birth for the foreign-born population - India (%)
Place of birth for the foreign-born population - Iran (%)
Place of birth for the foreign-born population - Kazakhstan (%)
Place of birth for the foreign-born population - Nepal (%)
Place of birth for the foreign-born population - Pakistan (%)
Place of birth for the foreign-born population - Sri Lanka (%)
Place of birth for the foreign-born population - Uzbekistan (%)
Place of birth for the foreign-born population - Other South Central Asia (%)
Place of birth for the foreign-born population - Burma (%)
Place of birth for the foreign-born population - Cambodia (%)
Place of birth for the foreign-born population - Indonesia (%)
Place of birth for the foreign-born population - Laos (%)
Place of birth for the foreign-born population - Malaysia (%)
Place of birth for the foreign-born population - Philippines (%)
Place of birth for the foreign-born population - Singapore (%)
Place of birth for the foreign-born population - Thailand (%)
Place of birth for the foreign-born population - Vietnam (%)
Place of birth for the foreign-born population - Other South Eastern Asia (%)
Place of birth for the foreign-born population - Armenia (%)
Place of birth for the foreign-born population - Iraq (%)
Place of birth for the foreign-born population - Israel (%)
Place of birth for the foreign-born population - Jordan (%)
Place of birth for the foreign-born population - Kuwait (%)
Place of birth for the foreign-born population - Lebanon (%)
Place of birth for the foreign-born population - Saudi Arabia (%)
Place of birth for the foreign-born population - Syria (%)
Place of birth for the foreign-born population - Turkey (%)
Place of birth for the foreign-born population - Yemen (%)
Place of birth for the foreign-born population - Other Western Asia (%)
Place of birth for the foreign-born population - Eritrea (%)
Place of birth for the foreign-born population - Ethiopia (%)
Place of birth for the foreign-born population - Kenya (%)
Place of birth for the foreign-born population - Somalia (%)
Place of birth for the foreign-born population - Uganda (%)
Place of birth for the foreign-born population - Zimbabwe (%)
Place of birth for the foreign-born population - Other Eastern Africa (%)
Place of birth for the foreign-born population - Cameroon (%)
Place of birth for the foreign-born population - Congo (%)
Place of birth for the foreign-born population - Democratic Republic of Congo (Zaire) (%)
Place of birth for the foreign-born population - Other Middle Africa (%)
Place of birth for the foreign-born population - Egypt (%)
Place of birth for the foreign-born population - Morocco (%)
Place of birth for the foreign-born population - Sudan (%)
Place of birth for the foreign-born population - Other Northern Africa (%)
Place of birth for the foreign-born population - South Africa (%)
Place of birth for the foreign-born population - Other Southern Africa (%)
Place of birth for the foreign-born population - Cabo Verde (%)
Place of birth for the foreign-born population - Ghana (%)
Place of birth for the foreign-born population - Liberia (%)
Place of birth for the foreign-born population - Nigeria (%)
Place of birth for the foreign-born population - Senegal (%)
Place of birth for the foreign-born population - Sierra Leone (%)
Place of birth for the foreign-born population - Other Western Africa (%)
Place of birth for the foreign-born population - Australia (%)
Place of birth for the foreign-born population - New Zealand (%)
Place of birth for the foreign-born population - Fiji (%)
Place of birth for the foreign-born population - Micronesia (%)
Place of birth for the foreign-born population - Bahamas (%)
Place of birth for the foreign-born population - Barbados (%)
Place of birth for the foreign-born population - Cuba (%)
Place of birth for the foreign-born population - Dominica (%)
Place of birth for the foreign-born population - Dominican Republic (%)
Place of birth for the foreign-born population - Grenada (%)
Place of birth for the foreign-born population - Haiti (%)
Place of birth for the foreign-born population - Jamaica (%)
Place of birth for the foreign-born population - St. Vincent and the Grenadines (%)
Place of birth for the foreign-born population - Trinidad and Tobago (%)
Place of birth for the foreign-born population - West Indies (%)
Place of birth for the foreign-born population - Other Caribbean (%)
Place of birth for the foreign-born population - Belize (%)
Place of birth for the foreign-born population - Costa Rica (%)
Place of birth for the foreign-born population - El Salvador (%)
Place of birth for the foreign-born population - Guatemala (%)
Place of birth for the foreign-born population - Honduras (%)
Place of birth for the foreign-born population - Mexico (%)
Place of birth for the foreign-born population - Nicaragua (%)
Place of birth for the foreign-born population - Panama (%)
Place of birth for the foreign-born population - Other Central America (%)
Place of birth for the foreign-born population - Argentina (%)
Place of birth for the foreign-born population - Bolivia (%)
Place of birth for the foreign-born population - Brazil (%)
Place of birth for the foreign-born population - Chile (%)
Place of birth for the foreign-born population - Colombia (%)
Place of birth for the foreign-born population - Ecuador (%)
Place of birth for the foreign-born population - Guyana (%)
Place of birth for the foreign-born population - Peru (%)
Place of birth for the foreign-born population - Uruguay (%)
Place of birth for the foreign-born population - Venezuela (%)
Place of birth for the foreign-born population - Other South America (%)
Place of birth for the foreign-born population - Canada (%)
Place of birth for the foreign-born population - Other Northern America (%)
Place of birth for the foreign-born population - Other (%)
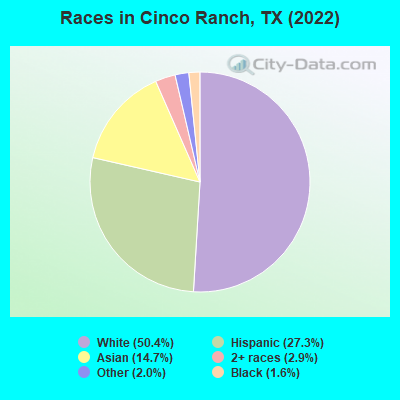
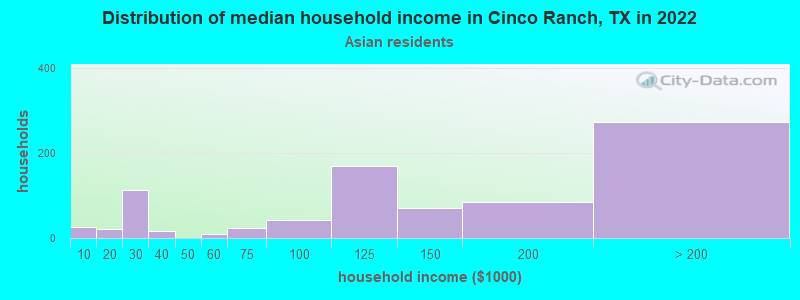
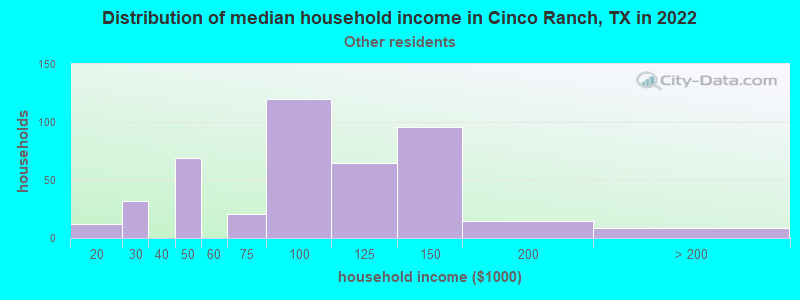
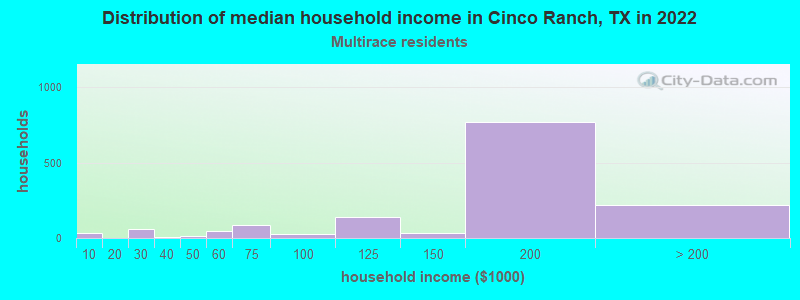
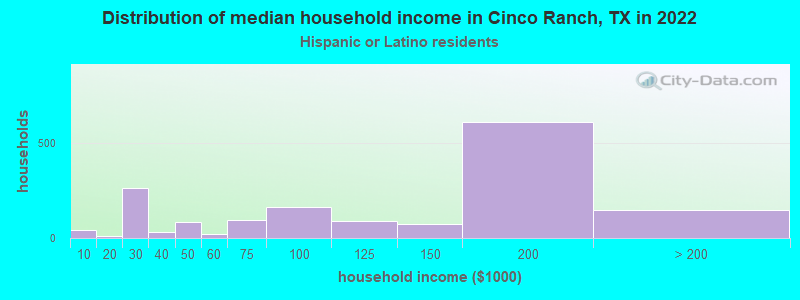
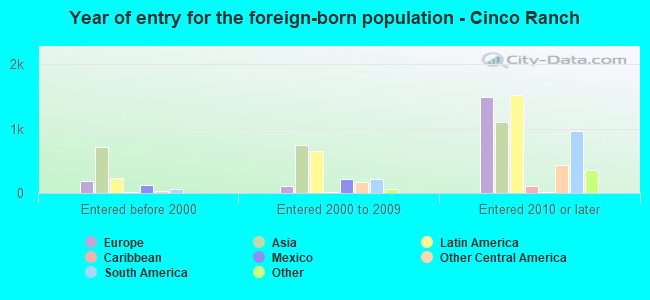
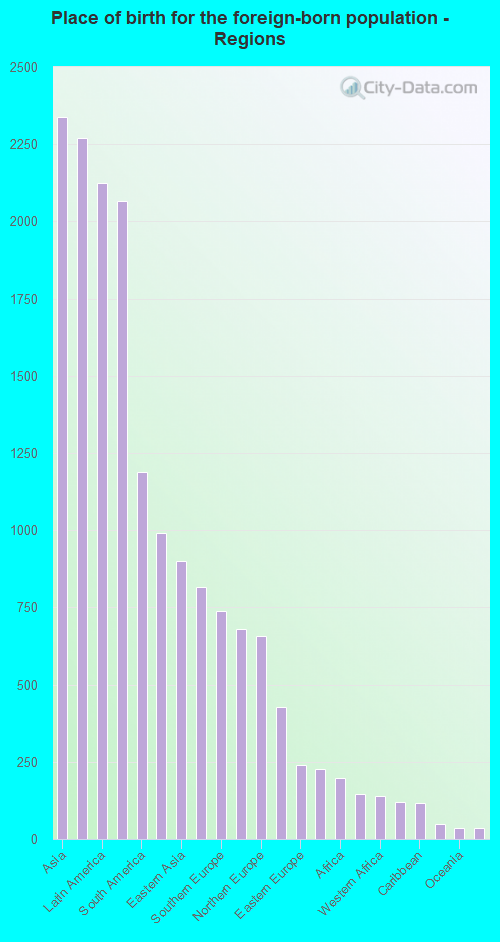
According to 2022 data, the most numerous races in Cinco Ranch, TX are Hispanic (5,498 residents), White alone (10,152 residents), and Black alone (322 residents). 61.5% of Cinco Ranch residents speak English at home. 34.3% of Cinco Ranch, TX residents are foreign-born (12.0% born in Asia, 10.9% born in Latin America, 10.6% born in Europe), which is 50.5% greater than the foreign-born rate of 17.0% across the entire state of Texas.
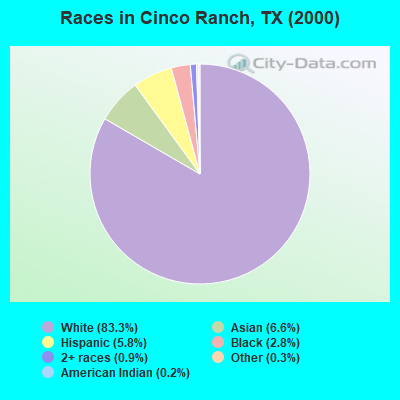
Race distribution in Cinco Ranch
2000 2022
10,933,313 52.4% White alone 6,669,666 32.0% Hispanic 2,364,255 11.3% Black alone 554,445 2.7% Asian alone 230,567 1.1% Two or more races 68,859 0.3% American Indian alone 19,958 0.10% Other race alone 10,757 0.05% Native Hawaiian and Other
12,070,642 40.2% Hispanic 11,683,430 38.9% White alone 3,508,706 11.7% Black alone 1,608,173 5.4% Asian alone 956,560 3.2% Two or more races 125,763 0.4% Other race alone 47,023 0.2% American Indian alone 29,275 0.10% Native Hawaiian and Other
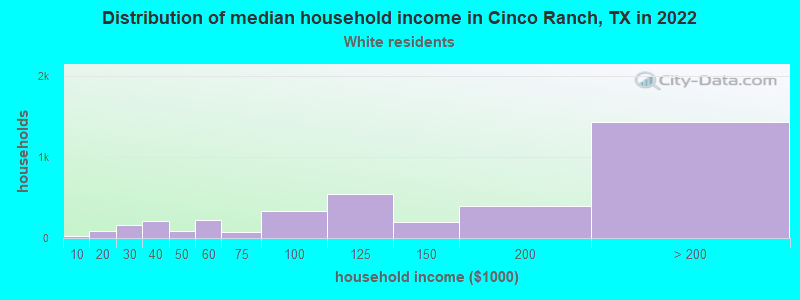
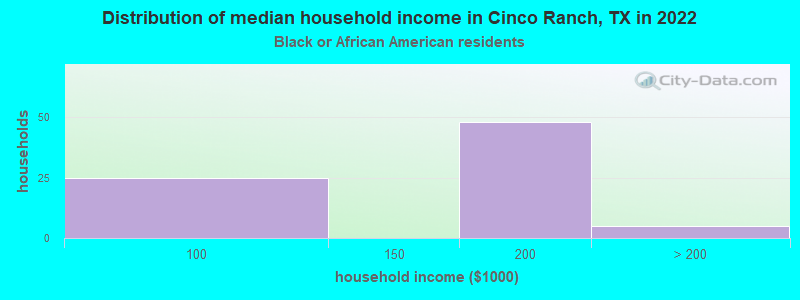
Income and house value in Cinco Ranch Median household income in 2022 $150,535 White non-Hispanic householders$156,820 Black householders$136,060 Asian householders$106,475 Some other race householders$161,412 Two or more races householders$140,293 Hispanic or Latino race householdersMedian 2022 house value $454,979 White Non-Hispanic householders$692,310 Black or African American householders $452,462 Asian householders$801,020 Native Hawaiian and other Pacific Islander householders$343,294 Some other race householders$371,902 Two or more races householders$448,113 Hispanic or Latino householders
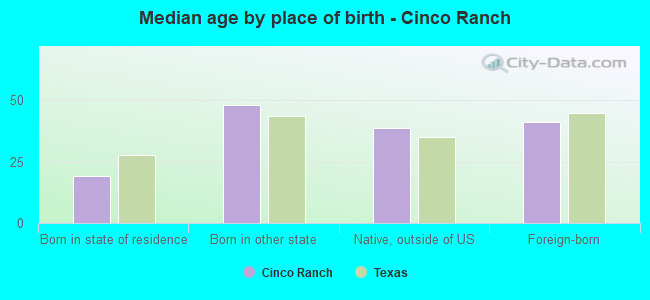
Median age by race in Cinco Ranch
41.1 Median age for White residents42.2 41.0 17.0 Median age for Black or African American residents45.6 16.7 -823,170,730.9 Median age for American Indian / Alaska Native residents-811,501,596.6 -762,172,283.9 42.1 Median age for Asian residents42.1 42.1 -581,560,283.1 Median age for Native Hawaiian / Pacific Islander residents-612,729,233.5 -577,777,777.2 21.7 Median age for Other race residents38.9 17.7 39.9 Median age for Two or more races residents39.3 42.4 44.8 Median age for White alone residents44.8 44.9 35.9 Median age for Hispanic or Latino residents36.9 35.5
Owner/renter occupied households by race in Cinco Ranch
House owners and renters - White residents 3,068 81.0% Owner occupied721 19.0% Renter occupiedHouse owners and renters - Black or African American residents 10 13.4% Owner occupied64 86.6% Renter occupiedHouse owners and renters - Asian residents 754 86.3% Owner occupied120 13.7% Renter occupiedHouse owners and renters - Other race residents 97 20.6% Owner occupied375 79.4% Renter occupiedHouse owners and renters - Two or more races residents 498 32.2% Owner occupied1,050 67.8% Renter occupiedHouse owners and renters - White alone residents 3,230 84.6% Owner occupied588 15.4% Renter occupiedHouse owners and renters - Hispanic or Latino residents 359 22.9% Owner occupied1,212 77.1% Renter occupied
Language usage in Cinco Ranch
English speakers - Total 61.5% of residents of Cinco Ranch speak English at home.
20.3% of residents speak Spanish at home 2,153 56.7% Speak English very well1,644 43.3% Speak English less than very well18.2% of residents speak other language at home 2,197 64.6% Speak English very well1,203 35.4% Speak English less than very well
English speakers - Born in the United States 92.6% of residents of Cinco Ranch speak English at home.
5.5% of residents speak Spanish at home 205 84.0% Speak English very well39 16.0% Speak English less than very well1.8% of residents speak other language at home 34 42.5% Speak English very well46 57.5% Speak English less than very well
English speakers - Native, born elsewhere 80.0% of residents of Cinco Ranch speak English at home.
3.7% of residents speak Spanish at home 3 17.6% Speak English very well14 82.4% Speak English less than very well18.1% of residents speak other language at home 82 100.0% Speak English very well
English speakers - Foreign-born 20.8% of residents of Cinco Ranch speak English at home.
37.8% of residents speak Spanish at home 1,196 44.4% Speak English very well1,495 55.6% Speak English less than very well40.3% of residents speak other language at home 1,748 61.0% Speak English very well1,119 39.0% Speak English less than very well
White (Caucasian) - Speak only English Native:
100.0% (7,424)Foreign-born:
46.2% (743)
White (Caucasian) - Speak another language Native:
3.0% (224)Foreign-born:
59.6% (959)
Black or African American - Speak only English Native:
100.0% (177)Foreign-born:
64.4% (77)
Asian - Speak only English Native:
33.4% (245)Foreign-born:
10.8% (220)
Asian - Speak another language Native:
66.4% (488)Foreign-born:
89.2% (1,819)
Other race - Speak only English Native:
73.4% (903)Foreign-born:
51.8% (273)
Other race - Speak another language Native:
18.9% (232)Foreign-born:
53.1% (280)
Two or more races - Speak only English Native:
53.1% (717)Foreign-born:
4.1% (151)
Two or more races - Speak another language Native:
47.8% (646)Foreign-born:
90.2% (3,311)
White alone - Speak only English Native:
97.0% (7,606)Foreign-born:
46.8% (803)
White alone - Speak another language Native:
3.1% (239)Foreign-born:
53.8% (922)
Hispanic or Latino - Speak only English Native:
56.6% (1,094)Foreign-born:
13.7% (411)
Hispanic or Latino - Speak another language Native:
41.8% (808)Foreign-born:
88.3% (2,640)
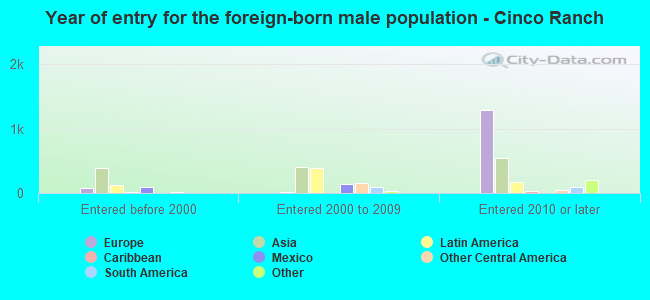
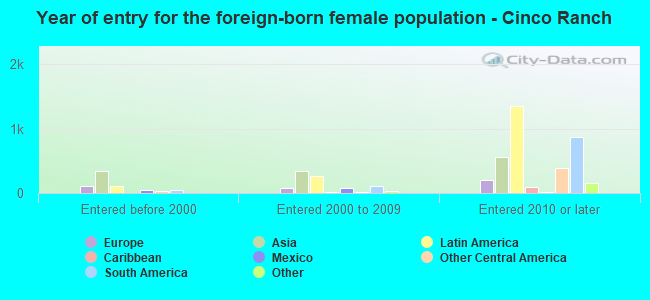
Foreign-born residents in Cinco Ranch 6,911 residents are foreign born (12.0% Asia , 10.9% Latin America , 10.6% Europe ).
This city:
34.3%Texas:
17.1%
Marital status for residents in Cinco Ranch Marital status - White (Caucasian) population 15 years and over
Males 21.7% Never married73.2% Now married0.1% Separated1.7% Widowed3.2% DivorcedFemales 15.8% Never married74.1% Now married0.0% Separated3.0% Widowed7.1% DivorcedWomen who gave birth in the past 12 months Now married:
100.0% (50)Unmarried:
0.0% (0)
Women who did not give birth in the past 12 months Now married:
67.4% (1,235)Unmarried:
32.6% (598)
Marital status - Black or African American population 15 years and over
Males 12.7% Never married87.3% Now married0.0% Separated0.0% Widowed0.0% DivorcedFemales 35.2% Never married64.8% Now married0.0% Separated0.0% Widowed0.0% DivorcedWomen who did not give birth in the past 12 months Now married:
64.8% (70)Unmarried:
35.2% (38)
Marital status - American Indian / Alaska Native population 15 years and over
Males 100.0% Never married0.0% Now married0.0% Separated0.0% Widowed0.0% DivorcedFemales 0.0% Never married100.0% Now married0.0% Separated0.0% Widowed0.0% DivorcedMarital status - Asian population 15 years and over
Males 13.3% Never married84.0% Now married0.0% Separated0.0% Widowed2.7% DivorcedFemales 18.2% Never married69.3% Now married1.4% Separated7.3% Widowed3.8% DivorcedWomen who gave birth in the past 12 months Now married:
100.0% (14)Unmarried:
0.0% (0)
Women who did not give birth in the past 12 months Now married:
70.7% (557)Unmarried:
29.3% (231)
Marital status - Other race population 15 years and over
Males 27.5% Never married60.3% Now married0.0% Separated10.2% Widowed1.9% DivorcedFemales 51.6% Never married36.5% Now married8.3% Separated2.2% Widowed1.3% DivorcedWomen who gave birth in the past 12 months Now married:
100.0% (170)Unmarried:
0.0% (0)
Women who did not give birth in the past 12 months Now married:
30.8% (241)Unmarried:
69.2% (542)
Marital status - Two or more races population 15 years and over
Males 8.6% Never married90.2% Now married0.0% Separated1.2% Widowed0.0% DivorcedFemales 21.1% Never married70.0% Now married1.2% Separated0.3% Widowed7.4% DivorcedWomen who did not give birth in the past 12 months Now married:
73.6% (1,228)Unmarried:
26.4% (441)
Marital status - White alone, not Hispanic / Latino population 15 years and over
Males 22.2% Never married73.2% Now married0.1% Separated1.0% Widowed3.6% DivorcedFemales 13.5% Never married75.6% Now married0.0% Separated3.4% Widowed7.5% DivorcedWomen who gave birth in the past 12 months Now married:
100.0% (61)Unmarried:
0.0% (0)
Women who did not give birth in the past 12 months Now married:
69.7% (1,309)Unmarried:
30.3% (570)
Marital status - Hispanic or Latino population 15 years and over
Males 15.9% Never married78.6% Now married0.0% Separated5.0% Widowed0.5% DivorcedFemales 30.1% Never married60.9% Now married3.4% Separated0.9% Widowed4.7% DivorcedWomen who gave birth in the past 12 months Now married:
100.0% (68)Unmarried:
0.0% (0)
Women who did not give birth in the past 12 months Now married:
63.0% (1,171)Unmarried:
37.0% (688)
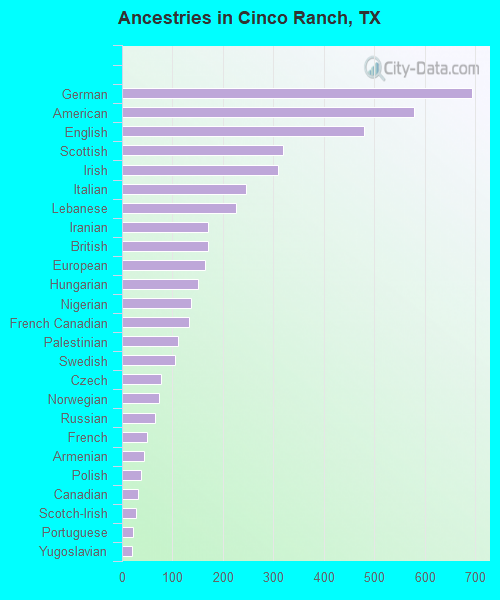
Ancestries in Cinco Ranch
693 6.9% German578 5.8% American480 4.8% English319 3.2% Scottish310 3.1% Irish246 2.5% Italian227 2.3% Lebanese171 1.7% Iranian170 1.7% British164 1.6% European150 1.5% Hungarian137 1.4% Nigerian133 1.3% French Canadian111 1.1% Palestinian106 1.1% Swedish78 0.8% Czech73 0.7% Norwegian65 0.6% Russian49 0.5% French43 0.4% Armenian37 0.4% Polish31 0.3% Canadian28 0.3% Scotch-Irish22 0.2% Portuguese20 0.2% Yugoslavian19 0.2% Slavic18 0.2% Dutch17 0.2% Jordanian17 0.2% Welsh16 0.2% Ukrainian14 0.1% Romanian13 0.1% Danish7 0.07% Austrian6 0.06% Serbian6 0.06% African
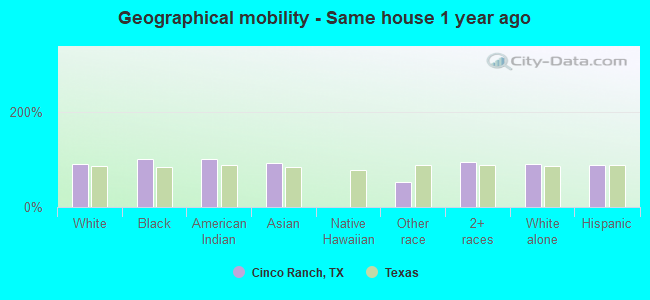
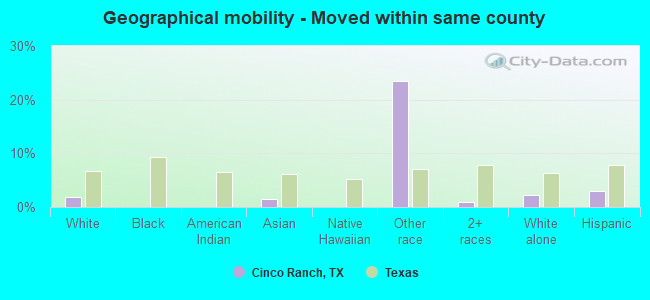
Geographical mobility in Cinco Ranch Same house 1 year ago 8,974 90.5% White (Caucasian)331 100.0% Black or African American14 100.0% American Indian / Alaska Native2,716 91.8% Asian939 52.1% Other race4,377 94.4% Two or more races9,119 90.1% White alone, not Hispanic / Latino4,711 87.1% Hispanic or LatinoMoved within same county 192 1.9% White / Caucasian44 1.5% Asian422 23.4% Other race46 1.0% Two or more races226 2.2% White alone, not Hispanic / Latino156 2.9% Hispanic or LatinoMoved within same state 736 7.4% White / Caucasian114 3.9% Asian13 100.0% Native Hawaiian / Pacific Islander278 15.4% Other race33 0.7% Two or more races797 7.9% White alone, not Hispanic / Latino275 5.1% Hispanic or LatinoMoved from different state 72 0.7% White / Caucasian17 0.4% Two or more races60 0.6% White alone, not Hispanic / Latino45 0.8% Hispanic or LatinoMoved from abroad 40 0.4% White84 2.9% Asian33 1.8% Other race235 5.1% Two or more races43 0.4% White alone, not Hispanic / Latino214 4.0% Hispanic or Latino
Children Nativity (place of birth) in Cinco Ranch
Children under 6 years - Living with two parents Both parents native 823 100.0% NativeBoth parents foreign-born 412 58.7% Native290 41.3% Foreign-bornOne native, one foreign-born parent 171 100.0% NativeChildren under 6 years - Living with one parent Native parent 31 100.0% NativeForeign-born parent 82 100.0% NativeChildren 6 to 17 years - Living with two parents Both parents native 1,642 97.4% Native44 2.6% Foreign-bornBoth parents foreign-born 436 33.2% Native875 66.8% Foreign-bornOne native, one foreign-born parent 469 100.0% NativeChildren 6 to 17 years - Living with one parent Native parent 125 100.0% NativeForeign-born parent 136 51.2% Native129 48.8% Foreign-born
Grandparents responsible for own grandchildren in Cinco Ranch
Grandparents (30 to 59 years) White / Caucasian 19 100.0% Responsible for grandchildrenWhite alone, not Hispanic / Latino 11 100.0% Responsible for grandchildrenGrandparents (60 years and over) White / Caucasian 3 6.5% Responsible for grandchildren50 93.5% Not responsible for grandchildrenWhite alone, not Hispanic / Latino 5 9.9% Responsible for grandchildren45 90.1% Not responsible for grandchildren