Races in Clarendon, Vermont (VT) Detailed Stats
Ancestries, Foreign-born residents, place of birth

Recent posts about races in Clarendon, Vermont on our local forum with over 2,400,000 registered users:
 | Moving to Vermont (11 replies) |
| Rutland or bust (7 replies) |
| Springfield/Claremont/Rutland area and jobs/affordability? (4 replies) |
| Just took a job in Rutland (26 replies) |
| Rutland and Burlington (8 replies) |
| Moving to Castleton area (3 replies) |
1.6% of Clarendon, VT residents are foreign-born , which is 149.9% less than the foreign-born rate of 4.0% across the entire state of Vermont.
Race distribution in Clarendon

- 2,74897.8%White alone
- 160.6%Asian alone
- 150.5%Two or more races
- 140.5%Hispanic
- 80.3%Black alone
- 60.2%American Indian alone
- 40.1%Other race alone

2000
2022
-
- 585,43196.2%White alone
- 6,8091.1%Two or more races
- 5,5040.9%Hispanic
- 5,1600.8%Asian alone
- 2,9210.5%Black alone
- 2,3250.4%American Indian alone
- 5570.09%Other race alone
- 1200.02%Native Hawaiian and Other
Pacific Islander alone

-
- 583,54690.2%White alone
- 27,3404.2%Two or more races
- 14,7702.3%Hispanic
- 11,5121.8%Asian alone
- 6,2641.0%Black alone
- 2,5210.4%Other race alone
- 1,0520.2%American Indian alone
- 590.01%Native Hawaiian and Other
Pacific Islander alone

Income and house value in Clarendon
- Median household income in 2022
- $75,217White non-Hispanic householders
- $77,053Asian householders
- $26,493Two or more races householders
- $124,224Hispanic or Latino race householders
- Median 2022 house value
- $241,681White Non-Hispanic householders
- $175,640Asian householders
- $128,803Two or more races householders
- $819,655Hispanic or Latino householders
Household income for White non-Hispanic householders

Household income for American Indian and Alaska Native householders

Household income for Asian householders

Household income for Two or more races householders

Household income for Hispanic or Latino race householders

Foreign-born residents in Clarendon
45 residents are foreign born
| This city: | 1.6% |
| Vermont: | 3.8% |
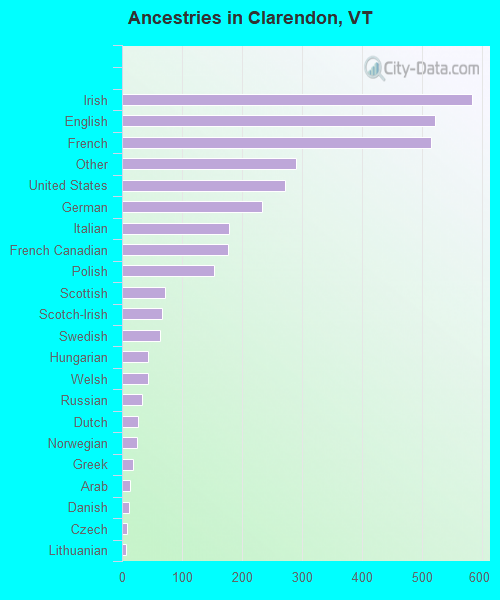
Ancestries in Clarendon

- 58217.3%Irish
- 52115.5%English
- 51415.3%French
- 2908.6%Other
- 2718.1%United States
- 2336.9%German
- 1785.3%Italian
- 1775.3%French Canadian
- 1534.5%Polish
- 712.1%Scottish
- 672.0%Scotch-Irish
- 631.9%Swedish
- 431.3%Hungarian
- 431.3%Welsh
- 331.0%Russian
- 260.8%Dutch
- 250.7%Norwegian
- 190.6%Greek
- 130.4%Arab
- 110.3%Danish
- 90.3%Czech
- 70.2%Lithuanian
- 50.1%Portuguese
- 40.1%Ukrainian
- 30.09%Slovak
- 20.06%Swiss
Zip codes: 05759.