Races in Clark, New Jersey (NJ) Detailed Stats
Ancestries, Foreign-born residents, place of birth

Recent posts about races in Clark, New Jersey on our local forum with over 2,400,000 registered users:
 | Buying a home--best neighborhoods (9 replies) |
| Asian Indian moving to Hackensack area (10 replies) |
| First house in Lnden. Please help !! (5 replies) |
| Clark, West Orange, East Brunswick or Monroe (14 replies) |
| Live in Clark, work in Hackettstown (12 replies) |
| Scotch Plains/Fanwood or Clark to Buy House? (8 replies) |
Latest news about races in Clark, NJ collected exclusively by city-data.com from local newspapers, TV, and radio stations
11.1% of Clark, NJ residents are foreign-born (6.6% born in Europe, 2.2% born in Asia, 1.8% born in Latin America), which is 107.1% less than the foreign-born rate of 23.0% across the entire state of New Jersey.
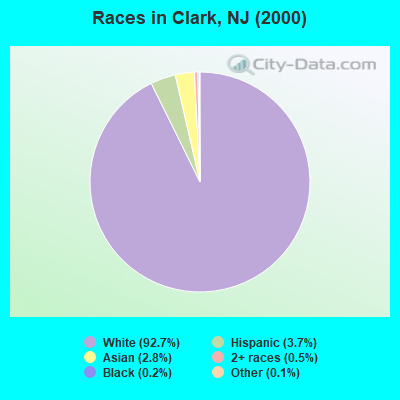
Race distribution in Clark

- 13,53492.7%White alone
- 5353.7%Hispanic
- 4022.8%Asian alone
- 740.5%Two or more races
- 350.2%Black alone
- 160.1%Other race alone
- 10.01%American Indian alone
2000
2022
-
- 5,557,20966.0%White alone
- 1,117,19113.3%Hispanic
- 1,096,17113.0%Black alone
- 477,0125.7%Asian alone
- 133,6891.6%Two or more races
- 19,5650.2%Other race alone
- 11,3380.1%American Indian alone
- 2,1750.03%Native Hawaiian and Other
Pacific Islander alone

-
- 4,766,47651.5%White alone
- 2,028,47021.9%Hispanic
- 1,111,63212.0%Black alone
- 923,54610.0%Asian alone
- 332,2373.6%Two or more races
- 89,8471.0%Other race alone
- 8,5570.09%American Indian alone
- 9340.01%Native Hawaiian and Other
Pacific Islander alone

Income and house value in Clark
- Median household income in 2022
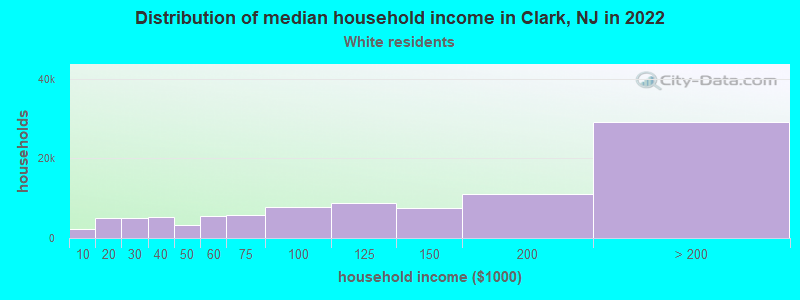
- $130,024White non-Hispanic householders
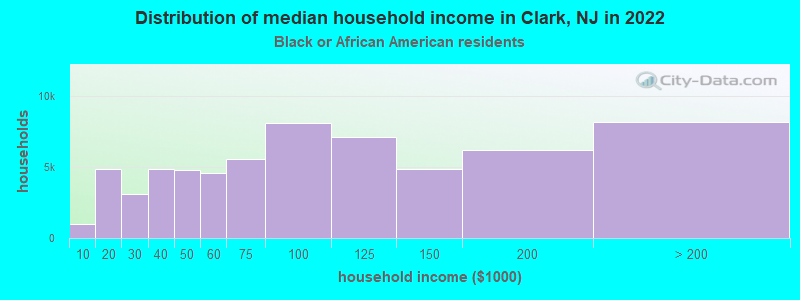
- $126,147Black householders
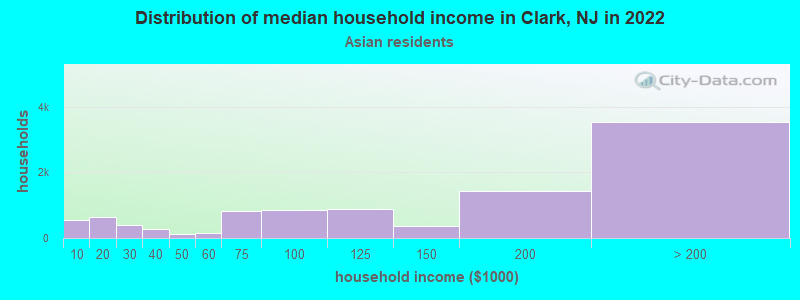
- $126,440Asian householders
- $72,894Some other race householders
- $143,566Two or more races householders
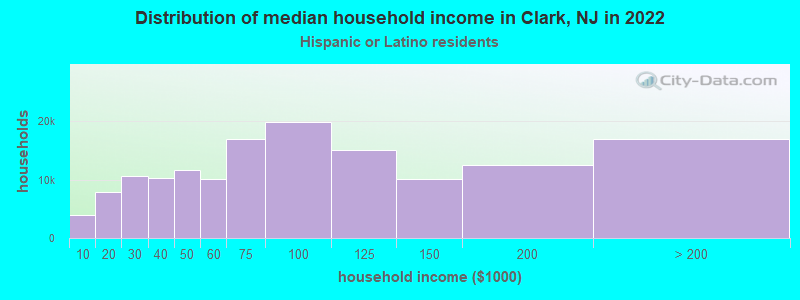
- $192,592Hispanic or Latino race householders
- Median 2022 house value
- $586,041White Non-Hispanic householders
- $626,243Asian householders
- $505,905Some other race householders
- $364,252Two or more races householders
- $661,050Hispanic or Latino householders
Household income for White non-Hispanic householders
Household income for Black householders
Household income for Asian householders
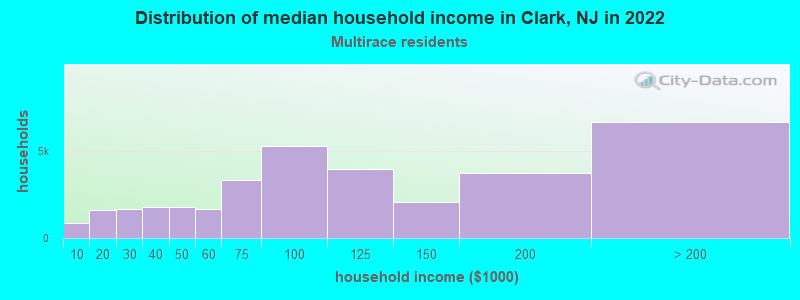
Household income for Two or more races householders
Household income for Hispanic or Latino race householders
Foreign-born residents in Clark
1,621 residents are foreign born (6.6% Europe, 2.2% Asia, 1.8% Latin America).
| This city: | 11.1% |
| New Jersey: | 17.5% |
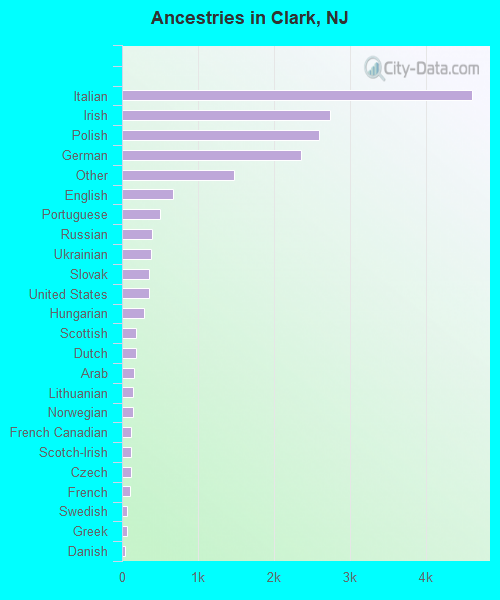
Ancestries in Clark

- 4,59925.2%Italian
- 2,73715.0%Irish
- 2,58814.2%Polish
- 2,36012.9%German
- 1,4718.1%Other
- 6763.7%English
- 5002.7%Portuguese
- 4012.2%Russian
- 3762.1%Ukrainian
- 3562.0%Slovak
- 3501.9%United States
- 2911.6%Hungarian
- 1901.0%Scottish
- 1871.0%Dutch
- 1540.8%Arab
- 1500.8%Lithuanian
- 1460.8%Norwegian
- 1210.7%French Canadian
- 1200.7%Scotch-Irish
- 1130.6%Czech
- 1080.6%French
- 690.4%Swedish
- 640.4%Greek
- 440.2%Danish
- 410.2%Swiss
- 210.1%Welsh
- 110.06%West Indian
- 30.02%Subsaharan African
Zip codes: 07066.