Races in Clarksburg, West Virginia (WV) Detailed Stats
Data:
Races - White alone (%)
Races - White alone (% change since 2000)
Races - Black alone (%)
Races - Black alone (% change since 2000)
Races - American Indian alone (%)
Races - American Indian alone (% change since 2000)
Races - Asian alone (%)
Races - Asian alone (% change since 2000)
Races - Hispanic (%)
Races - Hispanic (% change since 2000)
Races - Native Hawaiian and Other Pacific Islander alone (%)
Races - Native Hawaiian and Other Pacific Islander alone (% change since 2000)
Races - Two or more races(%)
Races - Two or more races(% change since 2000)
Races - Other race alone (%)
Races - Other race alone (% change since 2000)
Racial diversity
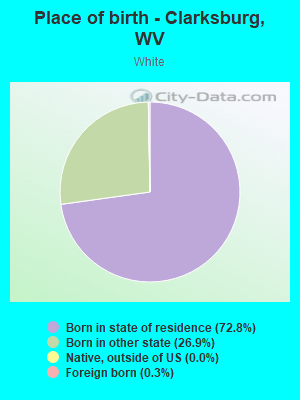
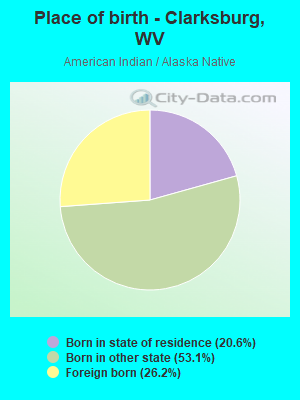
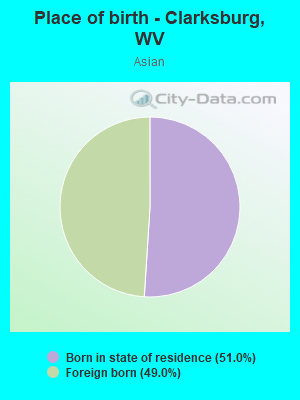
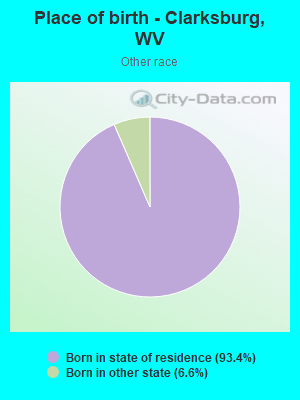
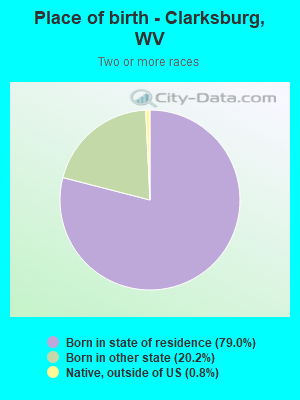
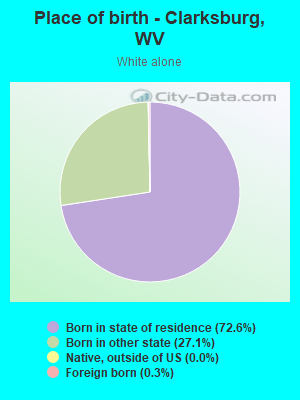
Place of birth - Born in state of residence (%)
Place of birth - Born in state of residence (%) - White
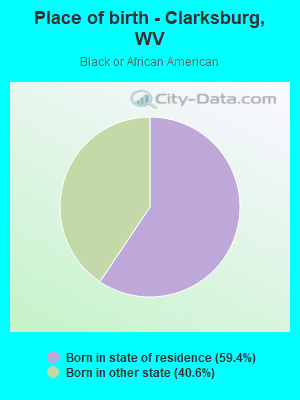
Place of birth - Born in state of residence (%) - Black or African American
Place of birth - Born in state of residence (%) - Asian
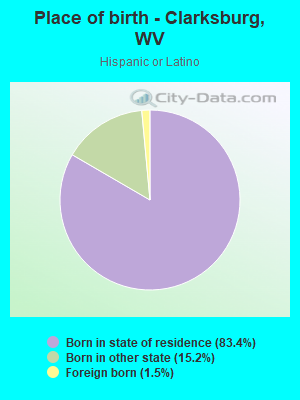
Place of birth - Born in state of residence (%) - Hispanic or Latino
Place of birth - Born in state of residence (%) - American Indian and Alaska Native
Place of birth - Born in state of residence (%) - Multirace
Place of birth - Born in state of residence (%) - Other Race
Place of birth - Born in other state (%)
Place of birth - Born in other state (%) - White
Place of birth - Born in other state (%) - Black or African American
Place of birth - Born in other state (%) - Asian
Place of birth - Born in other state (%) - Hispanic or Latino
Place of birth - Born in other state (%) - American Indian and Alaska Native
Place of birth - Born in other state (%) - Multirace
Place of birth - Born in other state (%) - Other Race
Place of birth - Native, outside of US (%)
Place of birth - Native, outside of US (%) - White
Place of birth - Native, outside of US (%) - Black or African American
Place of birth - Native, outside of US (%) - Asian
Place of birth - Native, outside of US (%) - Hispanic or Latino
Place of birth - Native, outside of US (%) - American Indian and Alaska Native
Place of birth - Native, outside of US (%) - Multirace
Place of birth - Native, outside of US (%) - Other Race
Place of birth - Foreign born (%)
Place of birth - Foreign born (%) - White
Place of birth - Foreign born (%) - Black or African American
Place of birth - Foreign born (%) - Asian
Place of birth - Foreign born (%) - Hispanic or Latino
Place of birth - Foreign born (%) - American Indian and Alaska Native
Place of birth - Foreign born (%) - Multirace
Place of birth - Foreign born (%) - Other Race
Residents speaking English at home (%)
Residents speaking English at home - Born in the United States (%)
Residents speaking English at home - Native, born elsewhere (%)
Residents speaking English at home - Foreign born (%)
Residents speaking Spanish at home (%)
Residents speaking Spanish at home - Born in the United States (%)
Residents speaking Spanish at home - Native, born elsewhere (%)
Residents speaking Spanish at home - Foreign born (%)
Residents speaking other language at home (%)
Residents speaking other language at home - Born in the United States (%)
Residents speaking other language at home - Native, born elsewhere (%)
Residents speaking other language at home - Foreign born (%)
Marital status - Never married (%)
Marital status - Now married (%)
Marital status - Separated (%)
Marital status - Widowed (%)
Marital status - Divorced (%)
Ancestries Reported - Arab (%)
Ancestries Reported - Czech (%)
Ancestries Reported - Danish (%)
Ancestries Reported - Dutch (%)
Ancestries Reported - English (%)
Ancestries Reported - French (%)
Ancestries Reported - French Canadian (%)
Ancestries Reported - German (%)
Ancestries Reported - Greek (%)
Ancestries Reported - Hungarian (%)
Ancestries Reported - Irish (%)
Ancestries Reported - Italian (%)
Ancestries Reported - Lithuanian (%)
Ancestries Reported - Norwegian (%)
Ancestries Reported - Polish (%)
Ancestries Reported - Portuguese (%)
Ancestries Reported - Russian (%)
Ancestries Reported - Scotch-Irish (%)
Ancestries Reported - Scottish (%)
Ancestries Reported - Slovak (%)
Ancestries Reported - Subsaharan African (%)
Ancestries Reported - Swedish (%)
Ancestries Reported - Swiss (%)
Ancestries Reported - Ukrainian (%)
Ancestries Reported - United States (%)
Ancestries Reported - Welsh (%)
Ancestries Reported - West Indian (%)
Ancestries Reported - Other (%)
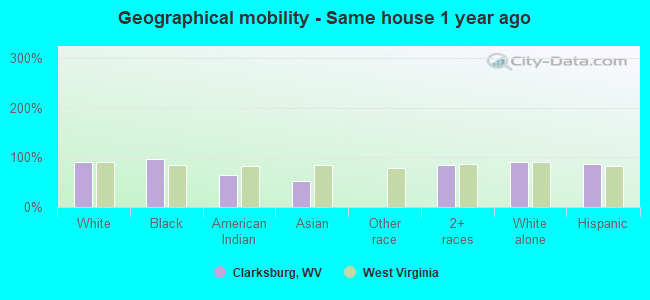
Geographical mobility - Same house 1 year ago (%)
Geographical mobility - Same house 1 year ago (%) - White
Geographical mobility - Same house 1 year ago (%) - Black or African American
Geographical mobility - Same house 1 year ago (%) - Asian
Geographical mobility - Same house 1 year ago (%) - Hispanic or Latino
Geographical mobility - Same house 1 year ago (%) - American Indian and Alaska Native
Geographical mobility - Same house 1 year ago (%) - Multirace
Geographical mobility - Same house 1 year ago (%) - Other Race
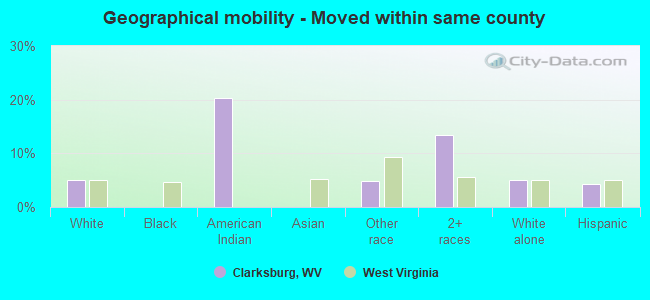
Geographical mobility - Moved within same county (%)
Geographical mobility - Moved within same county (%) - White
Geographical mobility - Moved within same county (%) - Black or African American
Geographical mobility - Moved within same county (%) - Asian
Geographical mobility - Moved within same county (%) - Hispanic or Latino
Geographical mobility - Moved within same county (%) - American Indian and Alaska Native
Geographical mobility - Moved within same county (%) - Multirace
Geographical mobility - Moved within same county (%) - Other Race
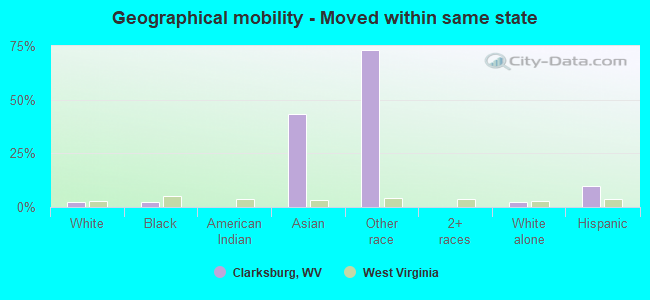
Geographical mobility - Moved from different county within same state (%)
Geographical mobility - Moved from different county within same state (%) - White
Geographical mobility - Moved from different county within same state (%) - Black or African American
Geographical mobility - Moved from different county within same state (%) - Asian
Geographical mobility - Moved from different county within same state (%) - Hispanic or Latino
Geographical mobility - Moved from different county within same state (%) - American Indian and Alaska Native
Geographical mobility - Moved from different county within same state (%) - Multirace
Geographical mobility - Moved from different county within same state (%) - Other Race
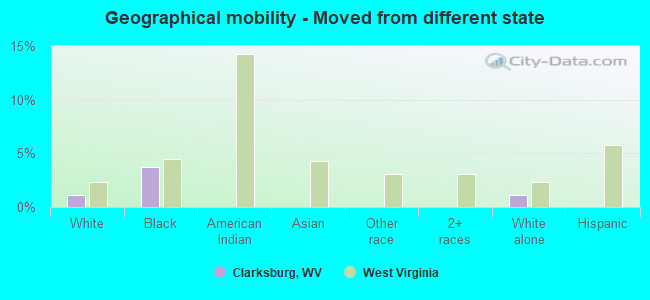
Geographical mobility - Moved from different state (%)
Geographical mobility - Moved from different state (%) - White
Geographical mobility - Moved from different state (%) - Black or African American
Geographical mobility - Moved from different state (%) - Asian
Geographical mobility - Moved from different state (%) - Hispanic or Latino
Geographical mobility - Moved from different state (%) - American Indian and Alaska Native
Geographical mobility - Moved from different state (%) - Multirace
Geographical mobility - Moved from different state (%) - Other Race
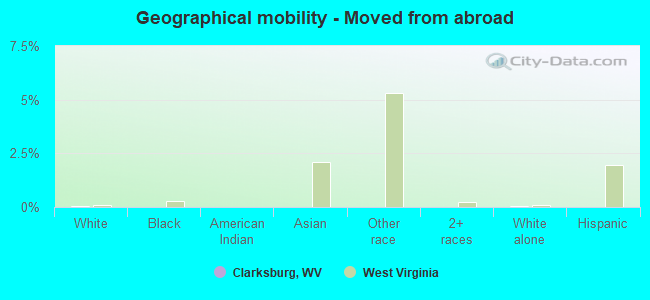
Geographical mobility - Moved from abroad (%)
Geographical mobility - Moved from abroad (%) - White
Geographical mobility - Moved from abroad (%) - Black or African American
Geographical mobility - Moved from abroad (%) - Asian
Geographical mobility - Moved from abroad (%) - Hispanic or Latino
Geographical mobility - Moved from abroad (%) - American Indian and Alaska Native
Geographical mobility - Moved from abroad (%) - Multirace
Geographical mobility - Moved from abroad (%) - Other Race
Place of birth for the foreign-born population - Ireland (%)
Place of birth for the foreign-born population - Denmark (%)
Place of birth for the foreign-born population - Norway (%)
Place of birth for the foreign-born population - Sweden (%)
Place of birth for the foreign-born population - United Kingdom (%)
Place of birth for the foreign-born population - England (%)
Place of birth for the foreign-born population - Scotland (%)
Place of birth for the foreign-born population - Other Northern Europe (%)
Place of birth for the foreign-born population - Austria (%)
Place of birth for the foreign-born population - Belgium (%)
Place of birth for the foreign-born population - France (%)
Place of birth for the foreign-born population - Germany (%)
Place of birth for the foreign-born population - Netherlands (%)
Place of birth for the foreign-born population - Switzerland (%)
Place of birth for the foreign-born population - Other Western Europe (%)
Place of birth for the foreign-born population - Greece (%)
Place of birth for the foreign-born population - Italy (%)
Place of birth for the foreign-born population - Portugal (%)
Place of birth for the foreign-born population - Spain (%)
Place of birth for the foreign-born population - Other Southern Europe (%)
Place of birth for the foreign-born population - Albania (%)
Place of birth for the foreign-born population - Belarus (%)
Place of birth for the foreign-born population - Bosnia and Herzegovina (%)
Place of birth for the foreign-born population - Bulgaria (%)
Place of birth for the foreign-born population - Croatia (%)
Place of birth for the foreign-born population - Czechoslovakia (%)
Place of birth for the foreign-born population - Hungary (%)
Place of birth for the foreign-born population - Latvia (%)
Place of birth for the foreign-born population - Lithuania (%)
Place of birth for the foreign-born population - North Macedonia (Macedonia) (%)
Place of birth for the foreign-born population - Moldova (%)
Place of birth for the foreign-born population - Poland (%)
Place of birth for the foreign-born population - Romania (%)
Place of birth for the foreign-born population - Russia (%)
Place of birth for the foreign-born population - Serbia (%)
Place of birth for the foreign-born population - Ukraine (%)
Place of birth for the foreign-born population - Other Eastern Europe (%)
Place of birth for the foreign-born population - China (%)
Place of birth for the foreign-born population - Hong Kong (%)
Place of birth for the foreign-born population - Taiwan (%)
Place of birth for the foreign-born population - Japan (%)
Place of birth for the foreign-born population - Korea (%)
Place of birth for the foreign-born population - Other Eastern Asia (%)
Place of birth for the foreign-born population - Afghanistan (%)
Place of birth for the foreign-born population - Bangladesh (%)
Place of birth for the foreign-born population - India (%)
Place of birth for the foreign-born population - Iran (%)
Place of birth for the foreign-born population - Kazakhstan (%)
Place of birth for the foreign-born population - Nepal (%)
Place of birth for the foreign-born population - Pakistan (%)
Place of birth for the foreign-born population - Sri Lanka (%)
Place of birth for the foreign-born population - Uzbekistan (%)
Place of birth for the foreign-born population - Other South Central Asia (%)
Place of birth for the foreign-born population - Burma (%)
Place of birth for the foreign-born population - Cambodia (%)
Place of birth for the foreign-born population - Indonesia (%)
Place of birth for the foreign-born population - Laos (%)
Place of birth for the foreign-born population - Malaysia (%)
Place of birth for the foreign-born population - Philippines (%)
Place of birth for the foreign-born population - Singapore (%)
Place of birth for the foreign-born population - Thailand (%)
Place of birth for the foreign-born population - Vietnam (%)
Place of birth for the foreign-born population - Other South Eastern Asia (%)
Place of birth for the foreign-born population - Armenia (%)
Place of birth for the foreign-born population - Iraq (%)
Place of birth for the foreign-born population - Israel (%)
Place of birth for the foreign-born population - Jordan (%)
Place of birth for the foreign-born population - Kuwait (%)
Place of birth for the foreign-born population - Lebanon (%)
Place of birth for the foreign-born population - Saudi Arabia (%)
Place of birth for the foreign-born population - Syria (%)
Place of birth for the foreign-born population - Turkey (%)
Place of birth for the foreign-born population - Yemen (%)
Place of birth for the foreign-born population - Other Western Asia (%)
Place of birth for the foreign-born population - Eritrea (%)
Place of birth for the foreign-born population - Ethiopia (%)
Place of birth for the foreign-born population - Kenya (%)
Place of birth for the foreign-born population - Somalia (%)
Place of birth for the foreign-born population - Uganda (%)
Place of birth for the foreign-born population - Zimbabwe (%)
Place of birth for the foreign-born population - Other Eastern Africa (%)
Place of birth for the foreign-born population - Cameroon (%)
Place of birth for the foreign-born population - Congo (%)
Place of birth for the foreign-born population - Democratic Republic of Congo (Zaire) (%)
Place of birth for the foreign-born population - Other Middle Africa (%)
Place of birth for the foreign-born population - Egypt (%)
Place of birth for the foreign-born population - Morocco (%)
Place of birth for the foreign-born population - Sudan (%)
Place of birth for the foreign-born population - Other Northern Africa (%)
Place of birth for the foreign-born population - South Africa (%)
Place of birth for the foreign-born population - Other Southern Africa (%)
Place of birth for the foreign-born population - Cabo Verde (%)
Place of birth for the foreign-born population - Ghana (%)
Place of birth for the foreign-born population - Liberia (%)
Place of birth for the foreign-born population - Nigeria (%)
Place of birth for the foreign-born population - Senegal (%)
Place of birth for the foreign-born population - Sierra Leone (%)
Place of birth for the foreign-born population - Other Western Africa (%)
Place of birth for the foreign-born population - Australia (%)
Place of birth for the foreign-born population - New Zealand (%)
Place of birth for the foreign-born population - Fiji (%)
Place of birth for the foreign-born population - Micronesia (%)
Place of birth for the foreign-born population - Bahamas (%)
Place of birth for the foreign-born population - Barbados (%)
Place of birth for the foreign-born population - Cuba (%)
Place of birth for the foreign-born population - Dominica (%)
Place of birth for the foreign-born population - Dominican Republic (%)
Place of birth for the foreign-born population - Grenada (%)
Place of birth for the foreign-born population - Haiti (%)
Place of birth for the foreign-born population - Jamaica (%)
Place of birth for the foreign-born population - St. Vincent and the Grenadines (%)
Place of birth for the foreign-born population - Trinidad and Tobago (%)
Place of birth for the foreign-born population - West Indies (%)
Place of birth for the foreign-born population - Other Caribbean (%)
Place of birth for the foreign-born population - Belize (%)
Place of birth for the foreign-born population - Costa Rica (%)
Place of birth for the foreign-born population - El Salvador (%)
Place of birth for the foreign-born population - Guatemala (%)
Place of birth for the foreign-born population - Honduras (%)
Place of birth for the foreign-born population - Mexico (%)
Place of birth for the foreign-born population - Nicaragua (%)
Place of birth for the foreign-born population - Panama (%)
Place of birth for the foreign-born population - Other Central America (%)
Place of birth for the foreign-born population - Argentina (%)
Place of birth for the foreign-born population - Bolivia (%)
Place of birth for the foreign-born population - Brazil (%)
Place of birth for the foreign-born population - Chile (%)
Place of birth for the foreign-born population - Colombia (%)
Place of birth for the foreign-born population - Ecuador (%)
Place of birth for the foreign-born population - Guyana (%)
Place of birth for the foreign-born population - Peru (%)
Place of birth for the foreign-born population - Uruguay (%)
Place of birth for the foreign-born population - Venezuela (%)
Place of birth for the foreign-born population - Other South America (%)
Place of birth for the foreign-born population - Canada (%)
Place of birth for the foreign-born population - Other Northern America (%)
Place of birth for the foreign-born population - Other (%)
Latest news about races in Clarksburg, WV collected exclusively by city-data.com from local newspapers, TV, and radio stations
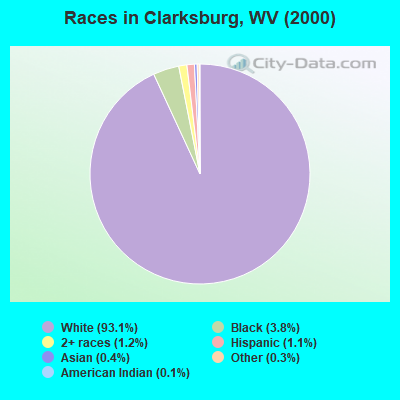
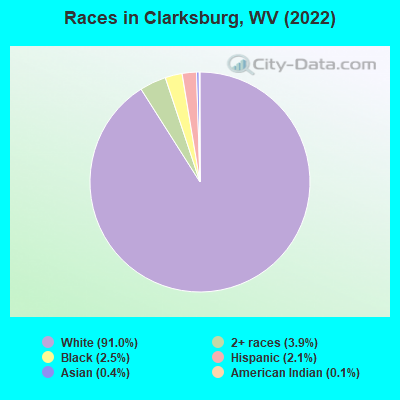
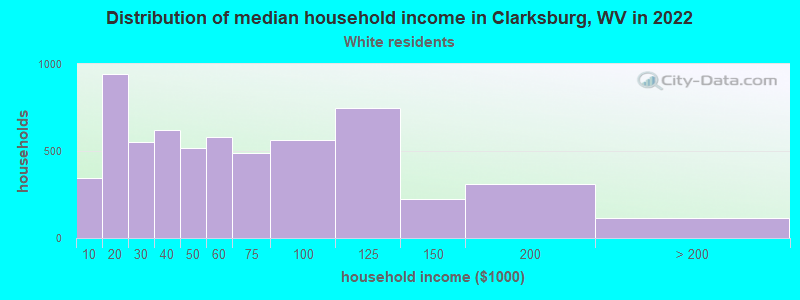
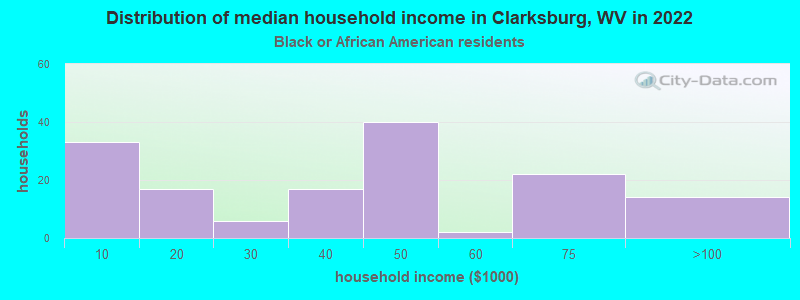
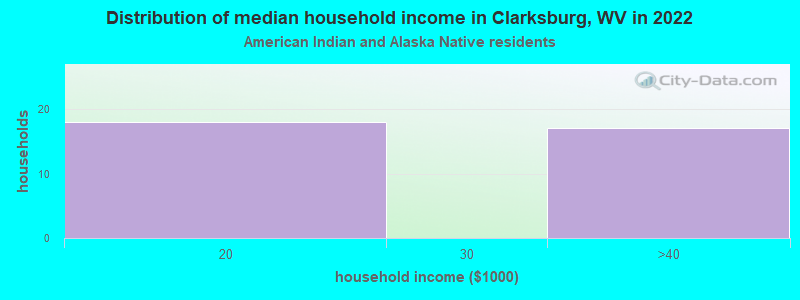
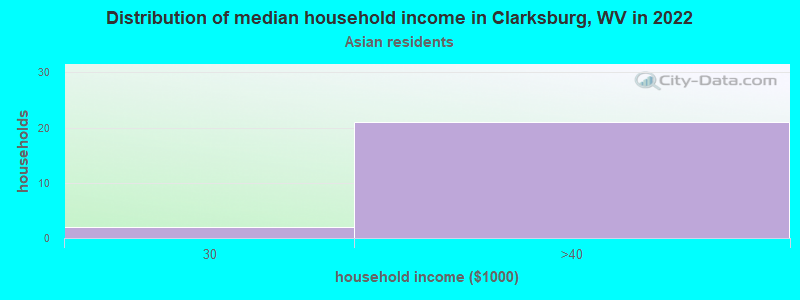
According to 2022 data, the most numerous races in Clarksburg, WV are White alone (14,394 residents), Two or more races (623 residents), and Black alone (396 residents). 98.3% of Clarksburg residents speak English at home. 0.4% of Clarksburg, WV residents are foreign-born , which is 146.0% less than the foreign-born rate of 1.0% across the entire state of West Virginia.
Race distribution in Clarksburg
2000 2022
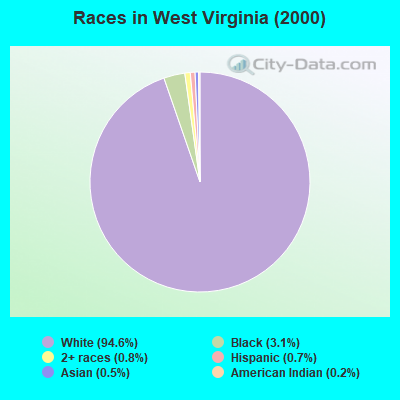
1,709,966 94.6% White alone 56,825 3.1% Black alone 14,983 0.8% Two or more races 12,279 0.7% Hispanic 9,356 0.5% Asian alone 3,456 0.2% American Indian alone 1,144 0.06% Other race alone 335 0.02% Native Hawaiian and Other
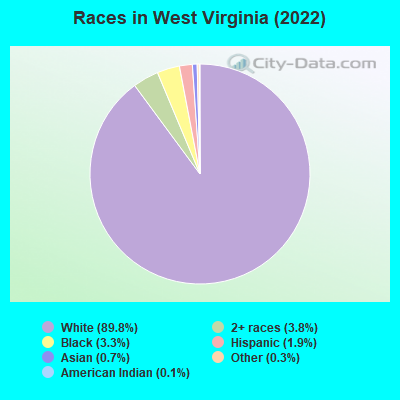
1,594,128 89.8% White alone 66,932 3.8% Two or more races 59,390 3.3% Black alone 34,343 1.9% Hispanic 13,134 0.7% Asian alone 5,238 0.3% Other race alone 1,880 0.1% American Indian alone 111 0.01% Native Hawaiian and Other
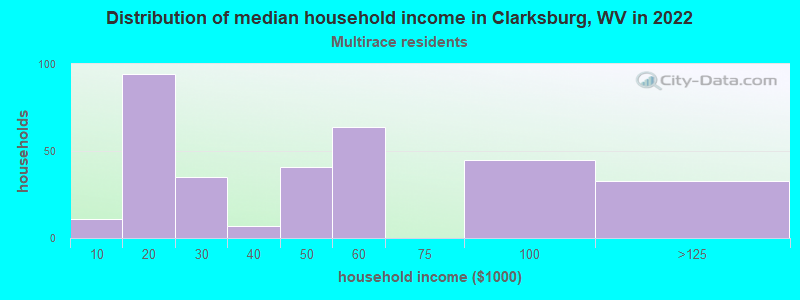
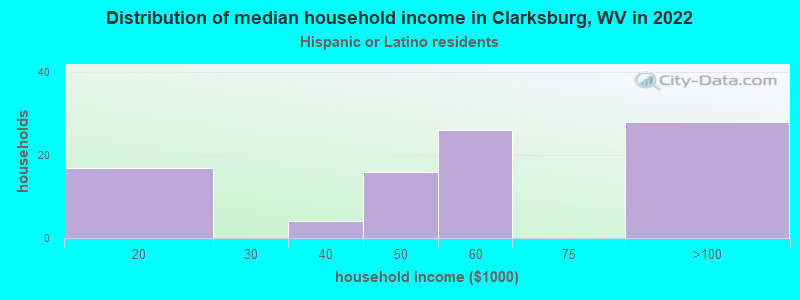
Income and house value in Clarksburg Median household income in 2022 $50,317 White non-Hispanic householders$32,069 Black householders$47,111 Two or more races householders$36,590 Hispanic or Latino race householdersMedian 2022 house value $131,310 White Non-Hispanic householders$98,592 Black or African American householders$49,406 Some other race householders$119,014 Two or more races householders$167,541 Hispanic or Latino householders
Median age by race in Clarksburg
40.1 Median age for White residents38.5 41.2 59.2 Median age for Black or African American residents57.2 51.1 39.8 Median age for American Indian / Alaska Native residents46.8 -723,367,696.9 33.7 Median age for Asian residents-670,816,043.6 9.8 -827,078,733.5 Median age for Native Hawaiian / Pacific Islander residents-666,666,666.0 -666,666,666.0 -498,783,454.5 Median age for Other race residents-446,623,093.2 -712,172,923.1 31.2 Median age for Two or more races residents30.8 22.8 40.1 Median age for White alone residents38.4 41.3 33.9 Median age for Hispanic or Latino residents35.6 22.3
Owner/renter occupied households by race in Clarksburg
House owners and renters - White residents 4,023 66.0% Owner occupied2,068 34.0% Renter occupiedHouse owners and renters - Black or African American residents 78 50.3% Owner occupied77 49.7% Renter occupiedHouse owners and renters - American Indian / Alaska Native residents 18 45.7% Owner occupied22 54.3% Renter occupiedHouse owners and renters - Asian residents 14 100.0% Owner occupiedHouse owners and renters - Two or more races residents 161 38.9% Owner occupied254 61.1% Renter occupiedHouse owners and renters - White alone residents 4,016 65.9% Owner occupied2,078 34.1% Renter occupiedHouse owners and renters - Hispanic or Latino residents 39 39.0% Owner occupied61 61.0% Renter occupied
Language usage in Clarksburg
English speakers - Total 98.3% of residents of Clarksburg speak English at home.
0.3% of residents speak Spanish at home 16 34.8% Speak English very well30 65.2% Speak English less than very well1.3% of residents speak other language at home 141 71.2% Speak English very well57 28.8% Speak English less than very well
English speakers - Born in the United States 99.2% of residents of Clarksburg speak English at home.
0.3% of residents speak Spanish at home 10 100.0% Speak English very well0.4% of residents speak other language at home 16 100.0% Speak English very well
All residents speak only English at home
English speakers - Foreign-born 64.3% of residents of Clarksburg speak English at home.
22.9% of residents speak Spanish at home 16 100.0% Speak English less than very well18.6% of residents speak other language at home 13 100.0% Speak English less than very well
White (Caucasian) - Speak only English Native:
98.8% (13,451)Foreign-born:
32.2% (12)
White (Caucasian) - Speak another language Native:
1.0% (135)Foreign-born:
81.7% (30)
Asian - Speak only English Native:
84.6% (30)Foreign-born:
100.0% (21)
White alone - Speak only English Native:
98.7% (13,447)Foreign-born:
30.2% (13)
White alone - Speak another language Native:
1.0% (139)Foreign-born:
25.1% (10)
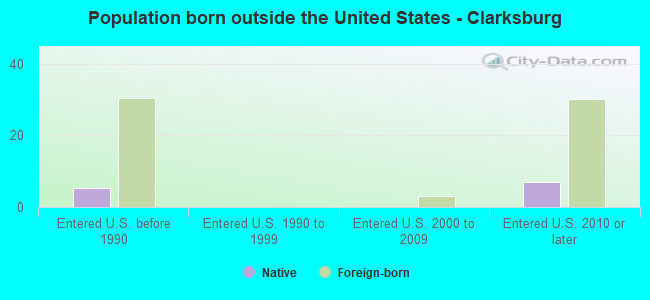
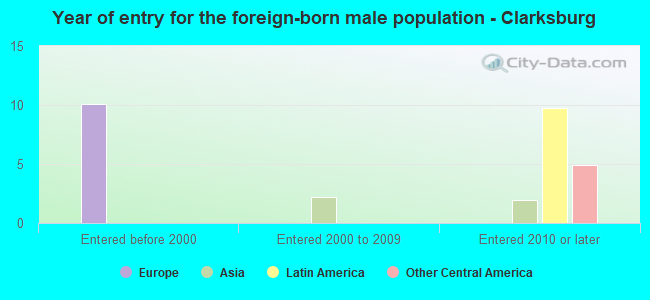
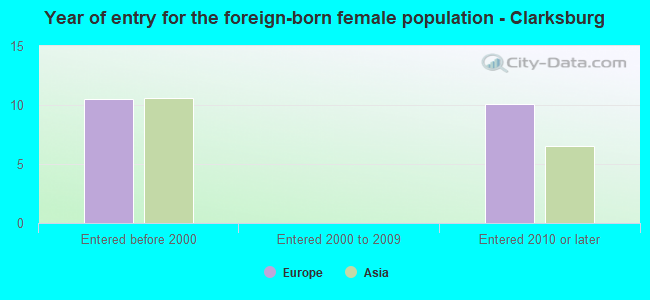
Foreign-born residents in Clarksburg 64 residents are foreign born
This city:
0.4%West Virginia:
1.6%
Marital status for residents in Clarksburg Marital status - White (Caucasian) population 15 years and over
Males 37.0% Never married40.3% Now married0.8% Separated3.0% Widowed18.9% DivorcedFemales 26.1% Never married39.9% Now married2.6% Separated9.4% Widowed22.0% DivorcedWomen who gave birth in the past 12 months Now married:
89.4% (82)Unmarried:
10.6% (10)
Women who did not give birth in the past 12 months Now married:
41.0% (1,268)Unmarried:
59.0% (1,826)
Marital status - Black or African American population 15 years and over
Males 40.4% Never married40.4% Now married0.7% Separated0.0% Widowed18.6% DivorcedFemales 46.5% Never married33.3% Now married0.0% Separated3.0% Widowed17.2% DivorcedWomen who did not give birth in the past 12 months Now married:
0.0% (0)Unmarried:
100.0% (42)
Marital status - Asian population 15 years and over
Males 0.0% Never married100.0% Now married0.0% Separated0.0% Widowed0.0% DivorcedFemales 0.0% Never married61.5% Now married0.0% Separated38.5% Widowed0.0% DivorcedWomen who did not give birth in the past 12 months Now married:
100.0% (9)Unmarried:
0.0% (0)
Marital status - Two or more races population 15 years and over
Males 76.1% Never married20.5% Now married0.0% Separated0.0% Widowed3.4% DivorcedFemales 49.6% Never married11.3% Now married13.5% Separated7.8% Widowed17.8% DivorcedWomen who did not give birth in the past 12 months Now married:
24.1% (92)Unmarried:
75.9% (290)
Marital status - White alone, not Hispanic / Latino population 15 years and over
Males 37.3% Never married39.9% Now married0.8% Separated3.0% Widowed19.0% DivorcedFemales 26.1% Never married39.9% Now married2.6% Separated9.4% Widowed22.0% DivorcedWomen who gave birth in the past 12 months Now married:
89.4% (83)Unmarried:
10.6% (10)
Women who did not give birth in the past 12 months Now married:
41.0% (1,275)Unmarried:
59.0% (1,835)
Marital status - Hispanic or Latino population 15 years and over
Males 51.9% Never married37.0% Now married0.0% Separated0.0% Widowed11.1% DivorcedFemales 42.1% Never married0.0% Now married29.8% Separated0.0% Widowed28.1% DivorcedWomen who did not give birth in the past 12 months Now married:
29.8% (34)Unmarried:
70.2% (79)
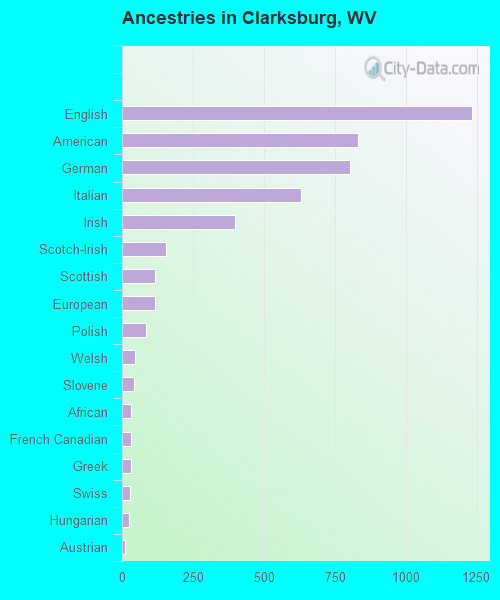
Ancestries in Clarksburg
1,232 23.4% English833 15.9% American803 15.3% German631 12.0% Italian400 7.6% Irish156 3.0% Scotch-Irish116 2.2% Scottish115 2.2% European85 1.6% Polish47 0.9% Welsh42 0.8% Slovene32 0.6% African30 0.6% French Canadian30 0.6% Greek28 0.5% Swiss26 0.5% Hungarian12 0.2% Austrian11 0.2% Norwegian11 0.2% Russian11 0.2% Slovak9 0.2% French9 0.2% Swedish8 0.2% Northern European7 0.1% Eastern European
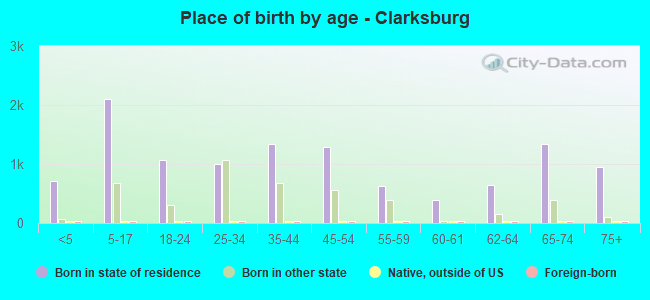
Children Nativity (place of birth) in Clarksburg
Children under 6 years - Living with two parents Both parents native 525 100.0% NativeOne native, one foreign-born parent 7 100.0% NativeChildren under 6 years - Living with one parent Native parent 473 100.0% Native
Children 6 to 17 years - Living with two parents Both parents native 1,455 100.0% NativeOne native, one foreign-born parent 24 100.0% NativeChildren 6 to 17 years - Living with one parent Native parent 804 100.0% Native
Grandparents responsible for own grandchildren in Clarksburg
Grandparents (30 to 59 years) White / Caucasian 76 60.8% Responsible for grandchildren49 39.2% Not responsible for grandchildrenTwo or more races 42 100.0% Responsible for grandchildrenWhite alone, not Hispanic / Latino 76 60.8% Responsible for grandchildren49 39.2% Not responsible for grandchildrenGrandparents (60 years and over) White / Caucasian 47 34.2% Responsible for grandchildren90 65.8% Not responsible for grandchildrenTwo or more races 6 100.0% Responsible for grandchildrenWhite alone, not Hispanic / Latino 48 34.6% Responsible for grandchildren90 65.4% Not responsible for grandchildren