Races in Clawson, Michigan (MI) Detailed Stats
Data:
Races - White alone (%)
Races - White alone (% change since 2000)
Races - Black alone (%)
Races - Black alone (% change since 2000)
Races - American Indian alone (%)
Races - American Indian alone (% change since 2000)
Races - Asian alone (%)
Races - Asian alone (% change since 2000)
Races - Hispanic (%)
Races - Hispanic (% change since 2000)
Races - Native Hawaiian and Other Pacific Islander alone (%)
Races - Native Hawaiian and Other Pacific Islander alone (% change since 2000)
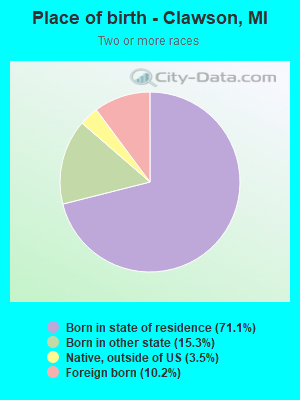
Races - Two or more races(%)
Races - Two or more races(% change since 2000)
Races - Other race alone (%)
Races - Other race alone (% change since 2000)
Racial diversity
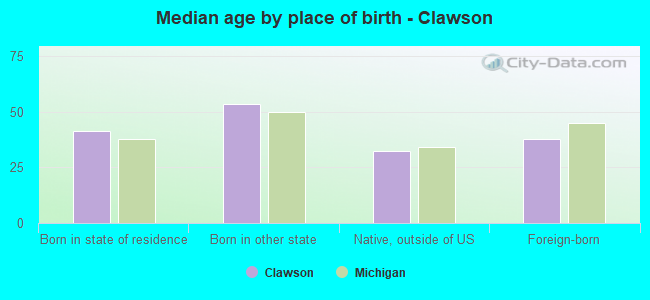
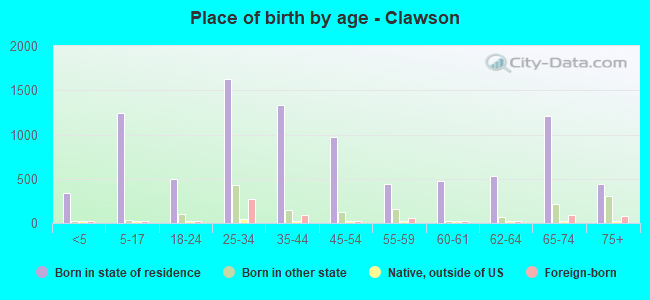
Place of birth - Born in state of residence (%)
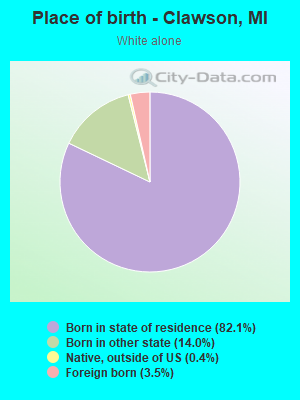
Place of birth - Born in state of residence (%) - White
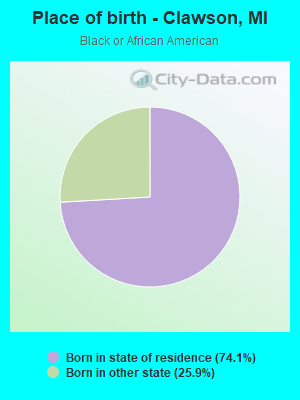
Place of birth - Born in state of residence (%) - Black or African American
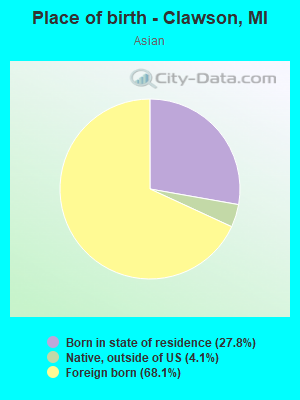
Place of birth - Born in state of residence (%) - Asian
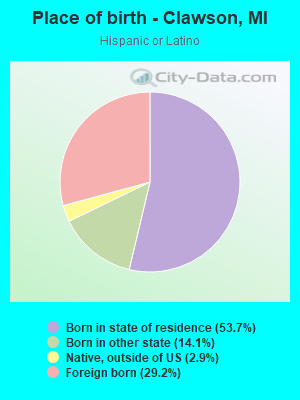
Place of birth - Born in state of residence (%) - Hispanic or Latino
Place of birth - Born in state of residence (%) - American Indian and Alaska Native
Place of birth - Born in state of residence (%) - Multirace
Place of birth - Born in state of residence (%) - Other Race
Place of birth - Born in other state (%)
Place of birth - Born in other state (%) - White
Place of birth - Born in other state (%) - Black or African American
Place of birth - Born in other state (%) - Asian
Place of birth - Born in other state (%) - Hispanic or Latino
Place of birth - Born in other state (%) - American Indian and Alaska Native
Place of birth - Born in other state (%) - Multirace
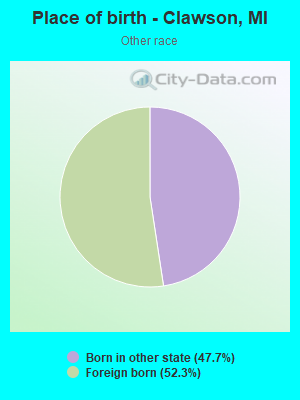
Place of birth - Born in other state (%) - Other Race
Place of birth - Native, outside of US (%)
Place of birth - Native, outside of US (%) - White
Place of birth - Native, outside of US (%) - Black or African American
Place of birth - Native, outside of US (%) - Asian
Place of birth - Native, outside of US (%) - Hispanic or Latino
Place of birth - Native, outside of US (%) - American Indian and Alaska Native
Place of birth - Native, outside of US (%) - Multirace
Place of birth - Native, outside of US (%) - Other Race
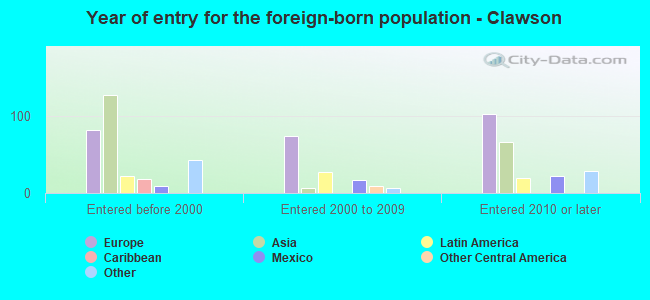
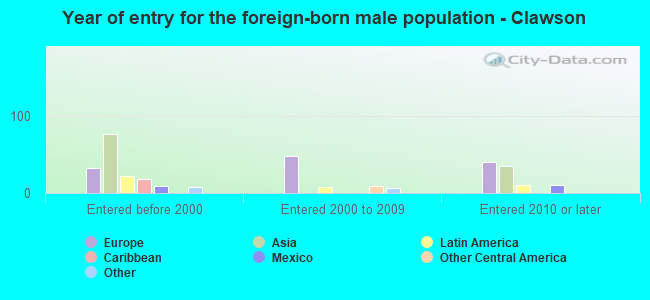
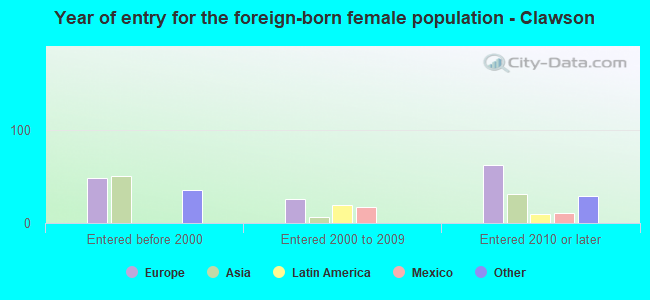
Place of birth - Foreign born (%)
Place of birth - Foreign born (%) - White
Place of birth - Foreign born (%) - Black or African American
Place of birth - Foreign born (%) - Asian
Place of birth - Foreign born (%) - Hispanic or Latino
Place of birth - Foreign born (%) - American Indian and Alaska Native
Place of birth - Foreign born (%) - Multirace
Place of birth - Foreign born (%) - Other Race
Residents speaking English at home (%)
Residents speaking English at home - Born in the United States (%)
Residents speaking English at home - Native, born elsewhere (%)
Residents speaking English at home - Foreign born (%)
Residents speaking Spanish at home (%)
Residents speaking Spanish at home - Born in the United States (%)
Residents speaking Spanish at home - Native, born elsewhere (%)
Residents speaking Spanish at home - Foreign born (%)
Residents speaking other language at home (%)
Residents speaking other language at home - Born in the United States (%)
Residents speaking other language at home - Native, born elsewhere (%)
Residents speaking other language at home - Foreign born (%)
Marital status - Never married (%)
Marital status - Now married (%)
Marital status - Separated (%)
Marital status - Widowed (%)
Marital status - Divorced (%)
Ancestries Reported - Arab (%)
Ancestries Reported - Czech (%)
Ancestries Reported - Danish (%)
Ancestries Reported - Dutch (%)
Ancestries Reported - English (%)
Ancestries Reported - French (%)
Ancestries Reported - French Canadian (%)
Ancestries Reported - German (%)
Ancestries Reported - Greek (%)
Ancestries Reported - Hungarian (%)
Ancestries Reported - Irish (%)
Ancestries Reported - Italian (%)
Ancestries Reported - Lithuanian (%)
Ancestries Reported - Norwegian (%)
Ancestries Reported - Polish (%)
Ancestries Reported - Portuguese (%)
Ancestries Reported - Russian (%)
Ancestries Reported - Scotch-Irish (%)
Ancestries Reported - Scottish (%)
Ancestries Reported - Slovak (%)
Ancestries Reported - Subsaharan African (%)
Ancestries Reported - Swedish (%)
Ancestries Reported - Swiss (%)
Ancestries Reported - Ukrainian (%)
Ancestries Reported - United States (%)
Ancestries Reported - Welsh (%)
Ancestries Reported - West Indian (%)
Ancestries Reported - Other (%)
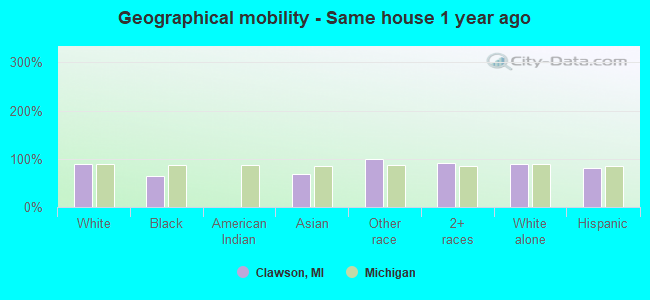
Geographical mobility - Same house 1 year ago (%)
Geographical mobility - Same house 1 year ago (%) - White
Geographical mobility - Same house 1 year ago (%) - Black or African American
Geographical mobility - Same house 1 year ago (%) - Asian
Geographical mobility - Same house 1 year ago (%) - Hispanic or Latino
Geographical mobility - Same house 1 year ago (%) - American Indian and Alaska Native
Geographical mobility - Same house 1 year ago (%) - Multirace
Geographical mobility - Same house 1 year ago (%) - Other Race
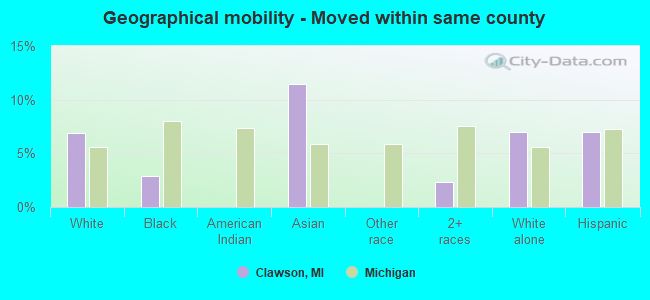
Geographical mobility - Moved within same county (%)
Geographical mobility - Moved within same county (%) - White
Geographical mobility - Moved within same county (%) - Black or African American
Geographical mobility - Moved within same county (%) - Asian
Geographical mobility - Moved within same county (%) - Hispanic or Latino
Geographical mobility - Moved within same county (%) - American Indian and Alaska Native
Geographical mobility - Moved within same county (%) - Multirace
Geographical mobility - Moved within same county (%) - Other Race
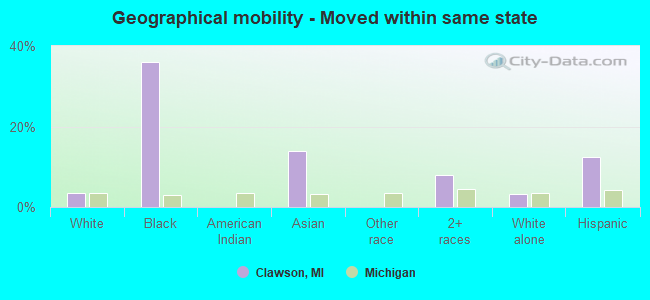
Geographical mobility - Moved from different county within same state (%)
Geographical mobility - Moved from different county within same state (%) - White
Geographical mobility - Moved from different county within same state (%) - Black or African American
Geographical mobility - Moved from different county within same state (%) - Asian
Geographical mobility - Moved from different county within same state (%) - Hispanic or Latino
Geographical mobility - Moved from different county within same state (%) - American Indian and Alaska Native
Geographical mobility - Moved from different county within same state (%) - Multirace
Geographical mobility - Moved from different county within same state (%) - Other Race
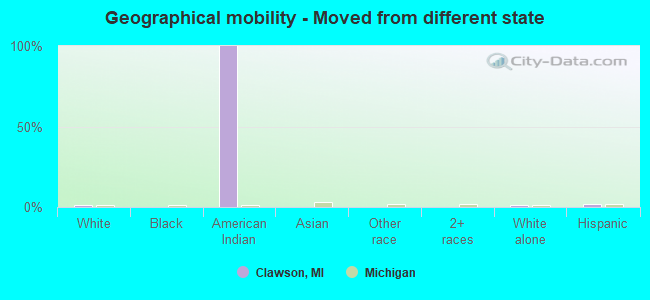
Geographical mobility - Moved from different state (%)
Geographical mobility - Moved from different state (%) - White
Geographical mobility - Moved from different state (%) - Black or African American
Geographical mobility - Moved from different state (%) - Asian
Geographical mobility - Moved from different state (%) - Hispanic or Latino
Geographical mobility - Moved from different state (%) - American Indian and Alaska Native
Geographical mobility - Moved from different state (%) - Multirace
Geographical mobility - Moved from different state (%) - Other Race
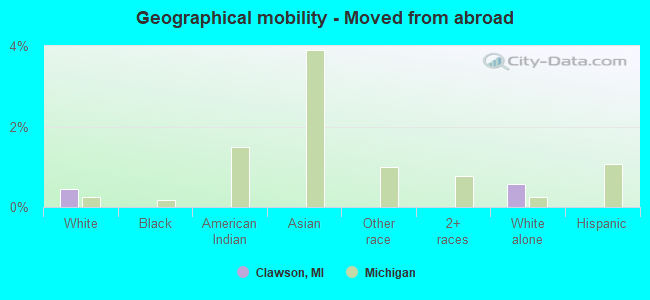
Geographical mobility - Moved from abroad (%)
Geographical mobility - Moved from abroad (%) - White
Geographical mobility - Moved from abroad (%) - Black or African American
Geographical mobility - Moved from abroad (%) - Asian
Geographical mobility - Moved from abroad (%) - Hispanic or Latino
Geographical mobility - Moved from abroad (%) - American Indian and Alaska Native
Geographical mobility - Moved from abroad (%) - Multirace
Geographical mobility - Moved from abroad (%) - Other Race
Place of birth for the foreign-born population - Ireland (%)
Place of birth for the foreign-born population - Denmark (%)
Place of birth for the foreign-born population - Norway (%)
Place of birth for the foreign-born population - Sweden (%)
Place of birth for the foreign-born population - United Kingdom (%)
Place of birth for the foreign-born population - England (%)
Place of birth for the foreign-born population - Scotland (%)
Place of birth for the foreign-born population - Other Northern Europe (%)
Place of birth for the foreign-born population - Austria (%)
Place of birth for the foreign-born population - Belgium (%)
Place of birth for the foreign-born population - France (%)
Place of birth for the foreign-born population - Germany (%)
Place of birth for the foreign-born population - Netherlands (%)
Place of birth for the foreign-born population - Switzerland (%)
Place of birth for the foreign-born population - Other Western Europe (%)
Place of birth for the foreign-born population - Greece (%)
Place of birth for the foreign-born population - Italy (%)
Place of birth for the foreign-born population - Portugal (%)
Place of birth for the foreign-born population - Spain (%)
Place of birth for the foreign-born population - Other Southern Europe (%)
Place of birth for the foreign-born population - Albania (%)
Place of birth for the foreign-born population - Belarus (%)
Place of birth for the foreign-born population - Bosnia and Herzegovina (%)
Place of birth for the foreign-born population - Bulgaria (%)
Place of birth for the foreign-born population - Croatia (%)
Place of birth for the foreign-born population - Czechoslovakia (%)
Place of birth for the foreign-born population - Hungary (%)
Place of birth for the foreign-born population - Latvia (%)
Place of birth for the foreign-born population - Lithuania (%)
Place of birth for the foreign-born population - North Macedonia (Macedonia) (%)
Place of birth for the foreign-born population - Moldova (%)
Place of birth for the foreign-born population - Poland (%)
Place of birth for the foreign-born population - Romania (%)
Place of birth for the foreign-born population - Russia (%)
Place of birth for the foreign-born population - Serbia (%)
Place of birth for the foreign-born population - Ukraine (%)
Place of birth for the foreign-born population - Other Eastern Europe (%)
Place of birth for the foreign-born population - China (%)
Place of birth for the foreign-born population - Hong Kong (%)
Place of birth for the foreign-born population - Taiwan (%)
Place of birth for the foreign-born population - Japan (%)
Place of birth for the foreign-born population - Korea (%)
Place of birth for the foreign-born population - Other Eastern Asia (%)
Place of birth for the foreign-born population - Afghanistan (%)
Place of birth for the foreign-born population - Bangladesh (%)
Place of birth for the foreign-born population - India (%)
Place of birth for the foreign-born population - Iran (%)
Place of birth for the foreign-born population - Kazakhstan (%)
Place of birth for the foreign-born population - Nepal (%)
Place of birth for the foreign-born population - Pakistan (%)
Place of birth for the foreign-born population - Sri Lanka (%)
Place of birth for the foreign-born population - Uzbekistan (%)
Place of birth for the foreign-born population - Other South Central Asia (%)
Place of birth for the foreign-born population - Burma (%)
Place of birth for the foreign-born population - Cambodia (%)
Place of birth for the foreign-born population - Indonesia (%)
Place of birth for the foreign-born population - Laos (%)
Place of birth for the foreign-born population - Malaysia (%)
Place of birth for the foreign-born population - Philippines (%)
Place of birth for the foreign-born population - Singapore (%)
Place of birth for the foreign-born population - Thailand (%)
Place of birth for the foreign-born population - Vietnam (%)
Place of birth for the foreign-born population - Other South Eastern Asia (%)
Place of birth for the foreign-born population - Armenia (%)
Place of birth for the foreign-born population - Iraq (%)
Place of birth for the foreign-born population - Israel (%)
Place of birth for the foreign-born population - Jordan (%)
Place of birth for the foreign-born population - Kuwait (%)
Place of birth for the foreign-born population - Lebanon (%)
Place of birth for the foreign-born population - Saudi Arabia (%)
Place of birth for the foreign-born population - Syria (%)
Place of birth for the foreign-born population - Turkey (%)
Place of birth for the foreign-born population - Yemen (%)
Place of birth for the foreign-born population - Other Western Asia (%)
Place of birth for the foreign-born population - Eritrea (%)
Place of birth for the foreign-born population - Ethiopia (%)
Place of birth for the foreign-born population - Kenya (%)
Place of birth for the foreign-born population - Somalia (%)
Place of birth for the foreign-born population - Uganda (%)
Place of birth for the foreign-born population - Zimbabwe (%)
Place of birth for the foreign-born population - Other Eastern Africa (%)
Place of birth for the foreign-born population - Cameroon (%)
Place of birth for the foreign-born population - Congo (%)
Place of birth for the foreign-born population - Democratic Republic of Congo (Zaire) (%)
Place of birth for the foreign-born population - Other Middle Africa (%)
Place of birth for the foreign-born population - Egypt (%)
Place of birth for the foreign-born population - Morocco (%)
Place of birth for the foreign-born population - Sudan (%)
Place of birth for the foreign-born population - Other Northern Africa (%)
Place of birth for the foreign-born population - South Africa (%)
Place of birth for the foreign-born population - Other Southern Africa (%)
Place of birth for the foreign-born population - Cabo Verde (%)
Place of birth for the foreign-born population - Ghana (%)
Place of birth for the foreign-born population - Liberia (%)
Place of birth for the foreign-born population - Nigeria (%)
Place of birth for the foreign-born population - Senegal (%)
Place of birth for the foreign-born population - Sierra Leone (%)
Place of birth for the foreign-born population - Other Western Africa (%)
Place of birth for the foreign-born population - Australia (%)
Place of birth for the foreign-born population - New Zealand (%)
Place of birth for the foreign-born population - Fiji (%)
Place of birth for the foreign-born population - Micronesia (%)
Place of birth for the foreign-born population - Bahamas (%)
Place of birth for the foreign-born population - Barbados (%)
Place of birth for the foreign-born population - Cuba (%)
Place of birth for the foreign-born population - Dominica (%)
Place of birth for the foreign-born population - Dominican Republic (%)
Place of birth for the foreign-born population - Grenada (%)
Place of birth for the foreign-born population - Haiti (%)
Place of birth for the foreign-born population - Jamaica (%)
Place of birth for the foreign-born population - St. Vincent and the Grenadines (%)
Place of birth for the foreign-born population - Trinidad and Tobago (%)
Place of birth for the foreign-born population - West Indies (%)
Place of birth for the foreign-born population - Other Caribbean (%)
Place of birth for the foreign-born population - Belize (%)
Place of birth for the foreign-born population - Costa Rica (%)
Place of birth for the foreign-born population - El Salvador (%)
Place of birth for the foreign-born population - Guatemala (%)
Place of birth for the foreign-born population - Honduras (%)
Place of birth for the foreign-born population - Mexico (%)
Place of birth for the foreign-born population - Nicaragua (%)
Place of birth for the foreign-born population - Panama (%)
Place of birth for the foreign-born population - Other Central America (%)
Place of birth for the foreign-born population - Argentina (%)
Place of birth for the foreign-born population - Bolivia (%)
Place of birth for the foreign-born population - Brazil (%)
Place of birth for the foreign-born population - Chile (%)
Place of birth for the foreign-born population - Colombia (%)
Place of birth for the foreign-born population - Ecuador (%)
Place of birth for the foreign-born population - Guyana (%)
Place of birth for the foreign-born population - Peru (%)
Place of birth for the foreign-born population - Uruguay (%)
Place of birth for the foreign-born population - Venezuela (%)
Place of birth for the foreign-born population - Other South America (%)
Place of birth for the foreign-born population - Canada (%)
Place of birth for the foreign-born population - Other Northern America (%)
Place of birth for the foreign-born population - Other (%)
Latest news about races in Clawson, MI collected exclusively by city-data.com from local newspapers, TV, and radio stations
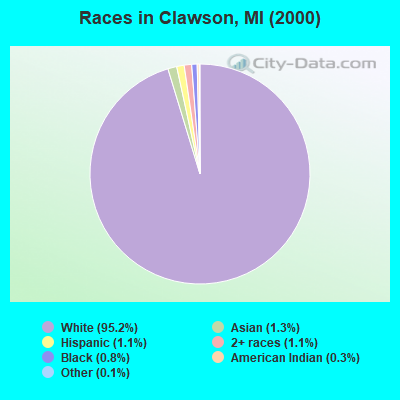
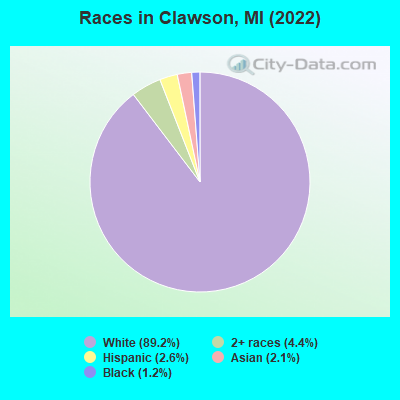
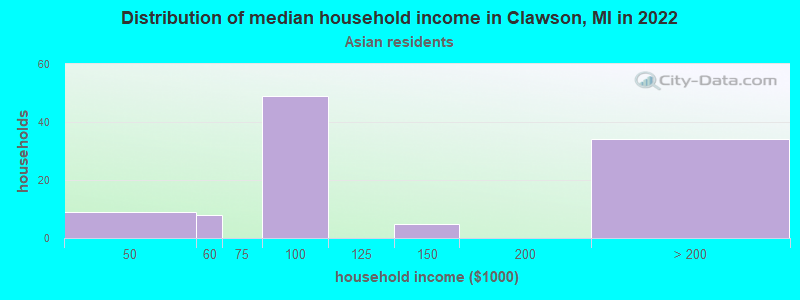
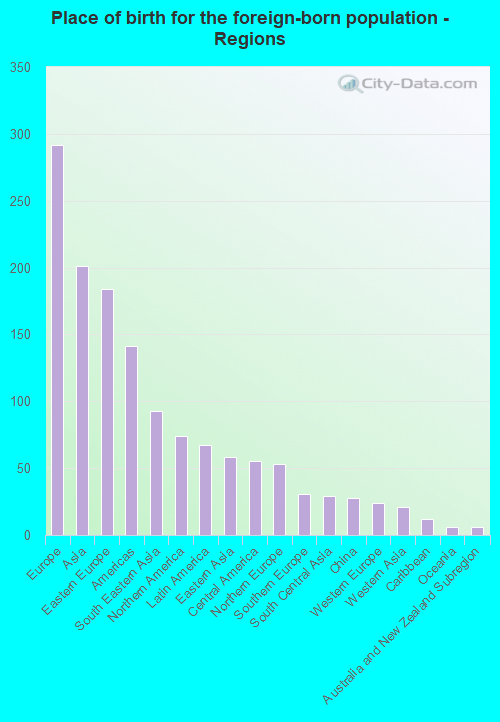
According to 2022 data, the most numerous races in Clawson, MI are White alone (10,130 residents), Black alone (140 residents), and Hispanic (293 residents). 93.1% of Clawson residents speak English at home. 5.6% of Clawson, MI residents are foreign-born (2.6% born in Europe, 1.8% born in Asia, 0.6% born in North America, 0.6% born in Latin America), which is 6.5% less than the foreign-born rate of 6.0% across the entire state of Michigan.
Race distribution in Clawson
2000 2022
7,806,691 78.6% White alone 1,402,047 14.1% Black alone 323,877 3.3% Hispanic 175,311 1.8% Asian alone 163,487 1.6% Two or more races 53,421 0.5% American Indian alone 11,465 0.1% Other race alone 2,145 0.02% Native Hawaiian and Other
7,289,051 72.6% White alone 1,310,464 13.1% Black alone 572,405 5.7% Hispanic 450,031 4.5% Two or more races 335,732 3.3% Asian alone 45,217 0.5% Other race alone 29,011 0.3% American Indian alone 2,207 0.02% Native Hawaiian and Other
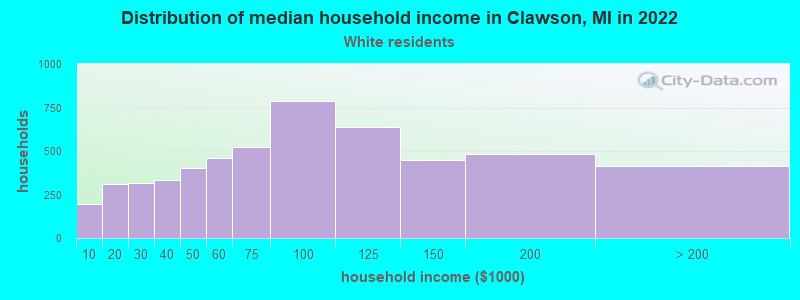
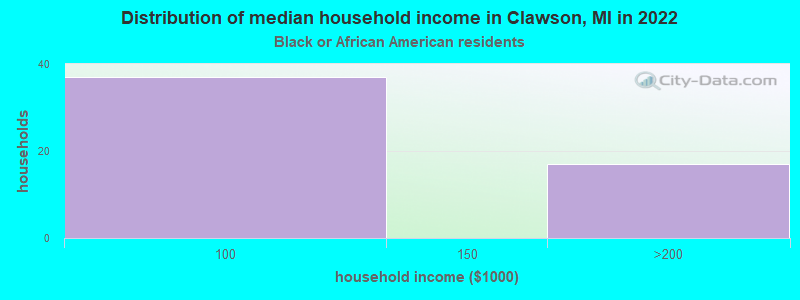
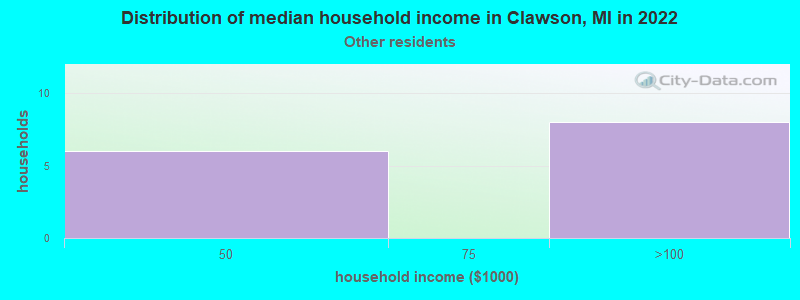
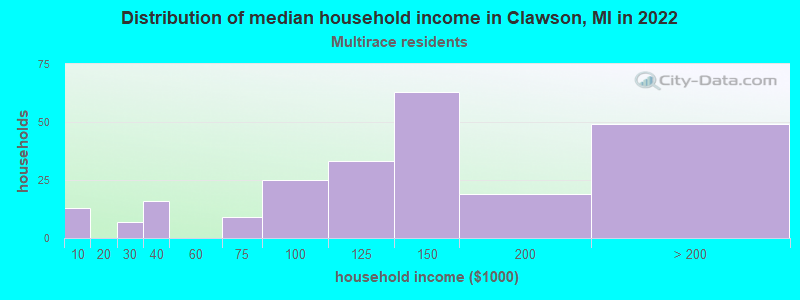
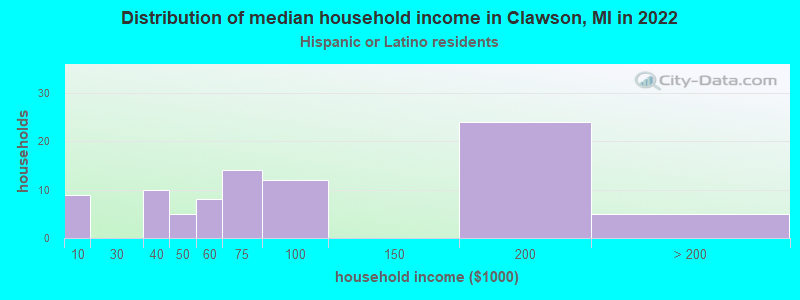
Income and house value in Clawson Median household income in 2022 $79,075 White non-Hispanic householders$101,524 Asian householders$120,347 Two or more races householders$69,324 Hispanic or Latino race householdersMedian 2022 house value $259,291 White Non-Hispanic householders $264,744 Asian householders$258,539 Some other race householders$220,933 Two or more races householders$251,206 Hispanic or Latino householders
Median age by race in Clawson
43.6 Median age for White residents41.2 47.2 42.6 Median age for Black or African American residents43.0 43.2 -718,321,226.1 Median age for American Indian / Alaska Native residents-505,050,504.5 -728,395,061.0 35.2 Median age for Asian residents43.0 28.8 -670,531,400.3 Median age for Native Hawaiian / Pacific Islander residents-674,772,035.8 -699,588,476.7 32.7 Median age for Other race residents-685,416,666.0 -604,609,928.5 30.7 Median age for Two or more races residents26.5 33.9 43.5 Median age for White alone residents41.2 46.8 34.1 Median age for Hispanic or Latino residents32.9 36.3
Owner/renter occupied households by race in Clawson
House owners and renters - White residents 4,065 76.3% Owner occupied1,260 23.7% Renter occupiedHouse owners and renters - Black or African American residents 58 100.0% Renter occupiedHouse owners and renters - American Indian / Alaska Native residents 12 100.0% Renter occupiedHouse owners and renters - Asian residents 37 33.0% Owner occupied76 67.0% Renter occupiedHouse owners and renters - Other race residents 7 34.6% Owner occupied13 65.4% Renter occupiedHouse owners and renters - Two or more races residents 205 79.6% Owner occupied52 20.4% Renter occupiedHouse owners and renters - White alone residents 4,061 76.3% Owner occupied1,264 23.7% Renter occupiedHouse owners and renters - Hispanic or Latino residents 36 36.3% Owner occupied62 63.7% Renter occupied
Language usage in Clawson
English speakers - Total 93.1% of residents of Clawson speak English at home.
1.9% of residents speak Spanish at home 174 81.3% Speak English very well40 18.7% Speak English less than very well4.8% of residents speak other language at home 362 67.7% Speak English very well173 32.3% Speak English less than very well
English speakers - Born in the United States 97.1% of residents of Clawson speak English at home.
2.6% of residents speak Spanish at home 18 43.9% Speak English very well23 56.1% Speak English less than very well0.9% of residents speak other language at home 15 100.0% Speak English very well
English speakers - Native, born elsewhere 77.9% of residents of Clawson speak English at home.
20.6% of residents speak Spanish at home 14 100.0% Speak English very well8.8% of residents speak other language at home 6 100.0% Speak English very well
English speakers - Foreign-born 30.2% of residents of Clawson speak English at home.
14.3% of residents speak Spanish at home 85 92.4% Speak English very well7 7.6% Speak English less than very well56.3% of residents speak other language at home 212 58.4% Speak English very well151 41.6% Speak English less than very well
White (Caucasian) - Speak only English Native:
98.5% (9,342)Foreign-born:
41.6% (148)
White (Caucasian) - Speak another language Native:
1.7% (159)Foreign-born:
59.6% (212)
Asian - Speak only English Native:
58.0% (47)Foreign-born:
26.1% (45)
Asian - Speak another language Native:
42.3% (34)Foreign-born:
74.5% (127)
Other race - Speak another language Native:
70.1% (15)Foreign-born:
100.0% (22)
Two or more races - Speak another language Native:
14.4% (86)Foreign-born:
100.0% (71)
White alone - Speak only English Native:
98.0% (9,336)Foreign-born:
42.1% (150)
White alone - Speak another language Native:
1.9% (181)Foreign-born:
58.6% (208)
Hispanic or Latino - Speak another language Native:
43.5% (79)Foreign-born:
100.0% (85)
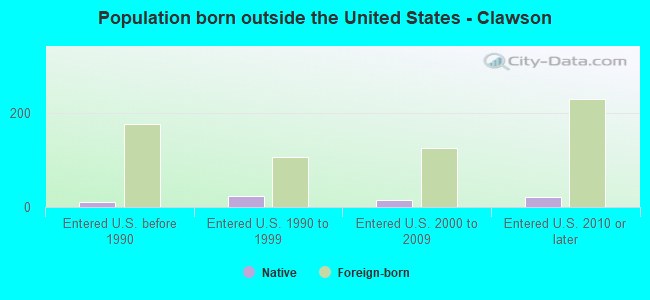
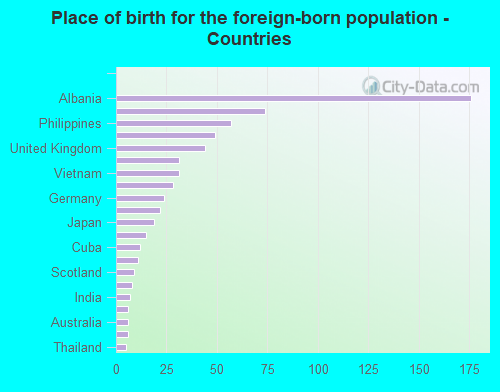
Foreign-born residents in Clawson 640 residents are foreign born (2.6% Europe , 1.8% Asia , 0.6% North America , 0.6% Latin America ).
This city:
5.6%Michigan:
6.9%
Marital status for residents in Clawson Marital status - White (Caucasian) population 15 years and over
Males 37.4% Never married45.8% Now married1.0% Separated2.9% Widowed12.8% DivorcedFemales 31.0% Never married41.1% Now married0.4% Separated9.2% Widowed18.3% DivorcedWomen who gave birth in the past 12 months Now married:
91.4% (70)Unmarried:
8.6% (7)
Women who did not give birth in the past 12 months Now married:
35.8% (742)Unmarried:
64.2% (1,333)
Marital status - Black or African American population 15 years and over
Males 76.1% Never married23.9% Now married0.0% Separated0.0% Widowed0.0% DivorcedFemales 71.2% Never married23.7% Now married0.0% Separated0.0% Widowed5.1% DivorcedWomen who did not give birth in the past 12 months Now married:
28.0% (13)Unmarried:
72.0% (33)
Marital status - Asian population 15 years and over
Males 45.7% Never married33.3% Now married0.0% Separated0.0% Widowed21.0% DivorcedFemales 17.6% Never married69.6% Now married0.0% Separated0.0% Widowed12.8% DivorcedWomen who did not give birth in the past 12 months Now married:
65.8% (74)Unmarried:
34.2% (38)
Marital status - Other race population 15 years and over
Males 0.0% Never married100.0% Now married0.0% Separated0.0% Widowed0.0% DivorcedFemales 0.0% Never married100.0% Now married0.0% Separated0.0% Widowed0.0% DivorcedWomen who did not give birth in the past 12 months Now married:
100.0% (25)Unmarried:
0.0% (0)
Marital status - Two or more races population 15 years and over
Males 53.7% Never married33.8% Now married0.0% Separated0.0% Widowed12.4% DivorcedFemales 20.3% Never married61.8% Now married0.0% Separated5.8% Widowed12.1% DivorcedWomen who did not give birth in the past 12 months Now married:
56.5% (121)Unmarried:
43.5% (93)
Marital status - White alone, not Hispanic / Latino population 15 years and over
Males 37.5% Never married46.0% Now married0.8% Separated3.0% Widowed12.6% DivorcedFemales 31.2% Never married41.3% Now married0.4% Separated9.3% Widowed17.9% DivorcedWomen who gave birth in the past 12 months Now married:
90.3% (63)Unmarried:
9.7% (7)
Women who did not give birth in the past 12 months Now married:
35.8% (755)Unmarried:
64.2% (1,351)
Marital status - Hispanic or Latino population 15 years and over
Males 38.8% Never married42.2% Now married8.6% Separated0.0% Widowed10.3% DivorcedFemales 4.4% Never married64.9% Now married0.0% Separated8.8% Widowed21.9% DivorcedWomen who gave birth in the past 12 months Now married:
100.0% (10)Unmarried:
0.0% (0)
Women who did not give birth in the past 12 months Now married:
91.5% (59)Unmarried:
8.5% (5)
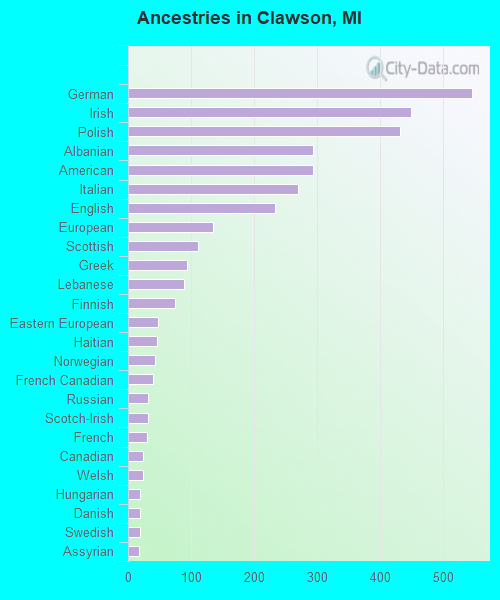
Ancestries in Clawson
545 12.8% German448 10.5% Irish431 10.1% Polish293 6.9% Albanian293 6.9% American269 6.3% Italian233 5.5% English135 3.2% European111 2.6% Scottish94 2.2% Greek88 2.1% Lebanese74 1.7% Finnish48 1.1% Eastern European46 1.1% Haitian43 1.0% Norwegian39 0.9% French Canadian32 0.8% Russian31 0.7% Scotch-Irish30 0.7% French24 0.6% Canadian24 0.6% Welsh19 0.4% Hungarian19 0.4% Danish19 0.4% Swedish17 0.4% Assyrian13 0.3% Arab12 0.3% Belgian12 0.3% Macedonian12 0.3% Slovak11 0.3% Armenian11 0.3% Czech10 0.2% British9 0.2% Czechoslovakian9 0.2% Romanian8 0.2% Dutch8 0.2% Lithuanian8 0.2% Ukrainian6 0.1% Brazilian5 0.1% Maltese
Children Nativity (place of birth) in Clawson
Children under 6 years - Living with two parents Both parents native 340 100.0% NativeOne native, one foreign-born parent 17 100.0% NativeChildren under 6 years - Living with one parent Native parent 42 100.0% NativeChildren 6 to 17 years - Living with two parents Both parents native 620 100.0% NativeBoth parents foreign-born 10 100.0% NativeOne native, one foreign-born parent 32 66.4% Native16 33.6% Foreign-bornChildren 6 to 17 years - Living with one parent Native parent 513 100.0% Native
Grandparents responsible for own grandchildren in Clawson
Grandparents (30 to 59 years) White / Caucasian 14 100.0% Not responsible for grandchildrenWhite alone, not Hispanic / Latino 15 100.0% Not responsible for grandchildrenGrandparents (60 years and over) White / Caucasian 42 62.9% Responsible for grandchildren25 37.1% Not responsible for grandchildrenWhite alone, not Hispanic / Latino 43 63.6% Responsible for grandchildren25 36.4% Not responsible for grandchildren