Races in Clinton, Iowa (IA) Detailed Stats
Ancestries, Foreign-born residents, place of birth
Settings
X


Recent posts about races in Clinton, Iowa on our local forum with over 2,400,000 registered users:
 | Why is Trump so Popular in Iowa? (152 replies) |
| Is Iowa life really that great? (127 replies) |
| Iowa, a racist state (36 replies) |
| Why is Sioux County so Republican compared to the rest of the state? (25 replies) |
| Clinton, Iowa (33 replies) |
| Clinton, Iowa (16 replies) |
Latest news about races in Clinton, IA collected exclusively by city-data.com from local newspapers, TV, and radio stations
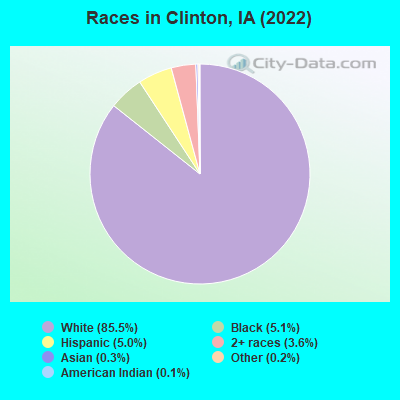
According to 2022 data, the most numerous races in Clinton, IA are White alone (21,049 residents), Hispanic (1,226 residents), and Black alone (1,267 residents). 96.9% of Clinton residents speak English at home. 2.1% of Clinton, IA residents are foreign-born (0.7% born in Latin America, 0.6% born in Africa, 0.5% born in Asia, 0.2% born in Europe), which is 141.3% less than the foreign-born rate of 5.0% across the entire state of Iowa.
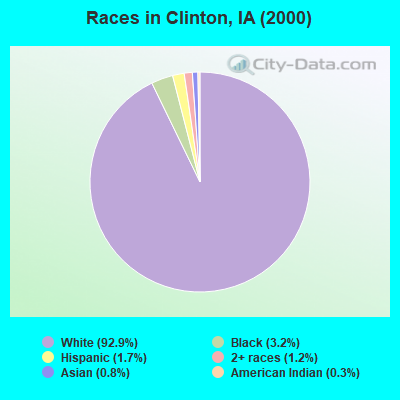
Race distribution in Clinton
2000
2022

- 25,79192.9%White alone
- 8783.2%Black alone
- 4661.7%Hispanic
- 3231.2%Two or more races
- 2130.8%Asian alone
- 760.3%American Indian alone
- 230.08%Other race alone
- 20.01%Native Hawaiian and Other
Pacific Islander alone
-
- 21,04985.5%White alone
- 1,2675.1%Black alone
- 1,2265.0%Hispanic
- 8903.6%Two or more races
- 620.3%Asian alone
- 520.2%Other race alone
- 300.1%American Indian alone
2000
2022
-
- 2,710,34492.6%White alone
- 82,4732.8%Hispanic
- 60,7442.1%Black alone
- 36,3451.2%Asian alone
- 25,4720.9%Two or more races
- 7,9550.3%American Indian alone
- 2,1030.07%Other race alone
- 8880.03%Native Hawaiian and Other
Pacific Islander alone

-
- 2,650,11082.8%White alone
- 218,0246.8%Hispanic
- 119,0043.7%Black alone
- 115,2863.6%Two or more races
- 74,8922.3%Asian alone
- 9,2600.3%Other race alone
- 8,5950.3%Native Hawaiian and Other
Pacific Islander alone - 5,3460.2%American Indian alone

Income and house value in Clinton
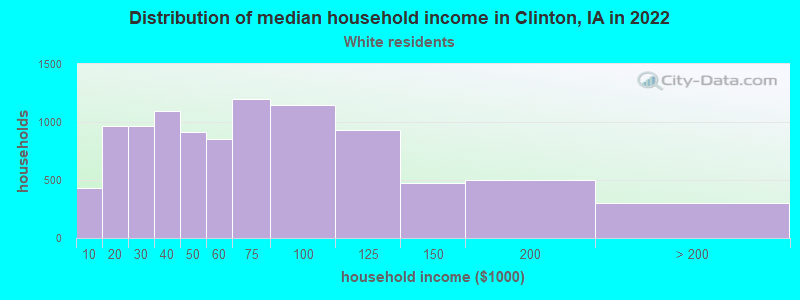
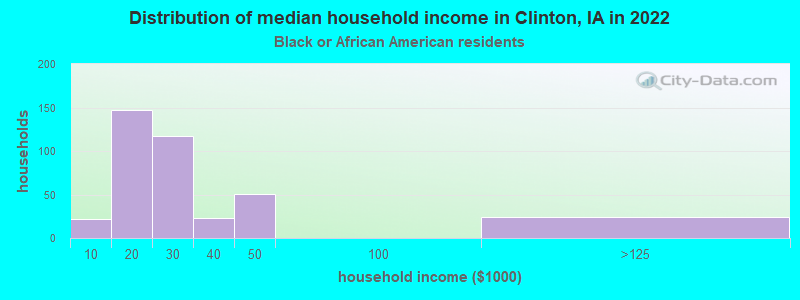
- Median household income in 2022
- $55,599White non-Hispanic householders
- $18,781Black householders
- $65,610Some other race householders
- $50,736Two or more races householders
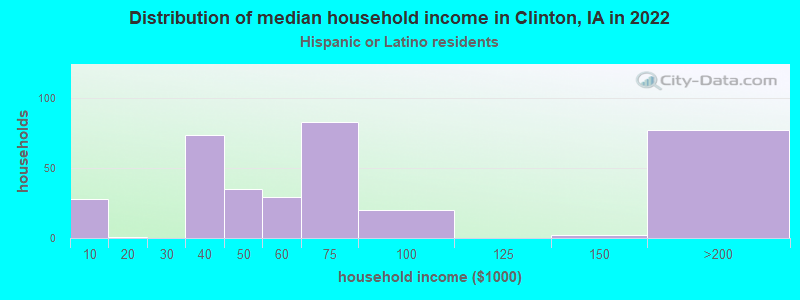
- $60,086Hispanic or Latino race householders
- Median 2022 house value
- $120,964White Non-Hispanic householders
- $94,650Black or African American householders
- $135,888American Indian or Alaska Native householders
- $319,101Asian householders
- $121,553Some other race householders
- $77,959Two or more races householders
- $88,366Hispanic or Latino householders
Household income for White non-Hispanic householders
Household income for Black householders
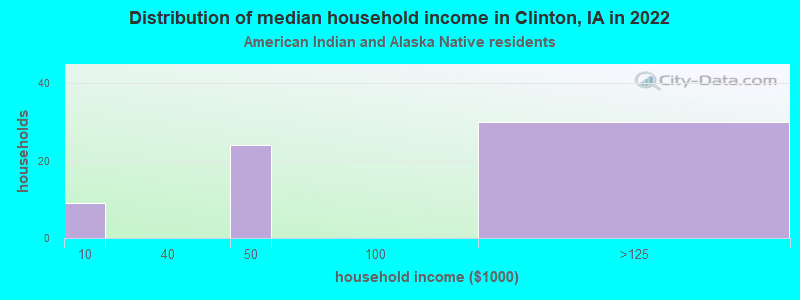
Household income for American Indian and Alaska Native householders
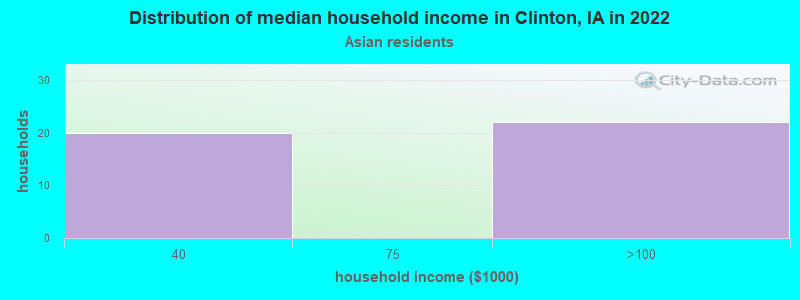
Household income for Asian householders
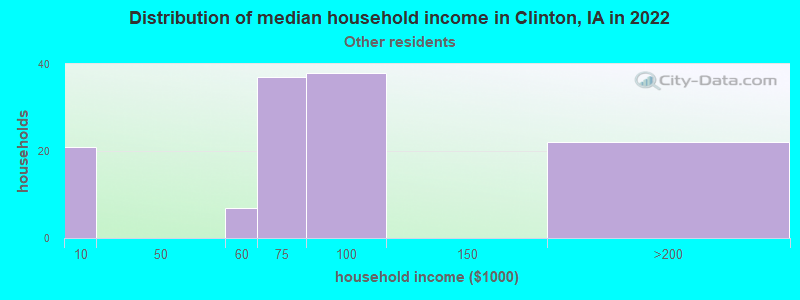
Household income for Some other race householders
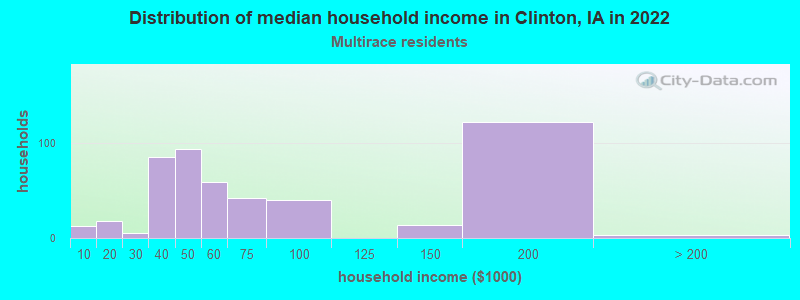
Household income for Two or more races householders
Household income for Hispanic or Latino race householders
Median age by race in Clinton
- 45.9Median age for White residents
- 43.9Males
- 49.1Females
- 32.4Median age for Black or African American residents
- 50.6Males
- 24.3Females
- 30.7Median age for American Indian / Alaska Native residents
- 10.7Males
- -670,912,950.5Females
- 68.4Median age for Asian residents
- 76.0Males
- 67.6Females
- -580,729,166.1Median age for Native Hawaiian / Pacific Islander residents
- -776,978,416.5Males
- -504,347,825.6Females
- 46.1Median age for Other race residents
- 25.1Males
- 53.9Females
- 24.9Median age for Two or more races residents
- 14.2Males
- 31.2Females
- 46.7Median age for White alone residents
- 44.4Males
- 49.4Females
- 27.3Median age for Hispanic or Latino residents
- 26.1Males
- 30.1Females
Owner/renter occupied households by race in Clinton
- House owners and renters - White residents
- 6,90370.5%Owner occupied
- 2,88929.5%Renter occupied
- House owners and renters - Black or African American residents
- 9929.1%Owner occupied
- 24270.9%Renter occupied
- House owners and renters - American Indian / Alaska Native residents
- 28100.0%Owner occupied
- House owners and renters - Asian residents
- 13100.0%Owner occupied
- House owners and renters - Other race residents
- 5040.3%Owner occupied
- 7559.7%Renter occupied
- House owners and renters - Two or more races residents
- 29862.3%Owner occupied
- 18137.7%Renter occupied
- House owners and renters - White alone residents
- 6,88370.1%Owner occupied
- 2,93629.9%Renter occupied
- House owners and renters - Hispanic or Latino residents
- 20461.5%Owner occupied
- 12838.5%Renter occupied
Language usage in Clinton
- English speakers - Total
- 96.9% of residents of Clinton speak English at home.
- 1.8% of residents speak Spanish at home
- 28367.4%Speak English very well
- 13732.6%Speak English less than very well
- 1.2% of residents speak other language at home
- 17966.8%Speak English very well
- 8933.2%Speak English less than very well
- English speakers - Born in the United States
- 97.3% of residents of Clinton speak English at home.
- 3.2% of residents speak Spanish at home
- 10846.8%Speak English very well
- 12353.2%Speak English less than very well
All residents speak only English at home
- English speakers - Foreign-born
- 39.7% of residents of Clinton speak English at home.
- 9.2% of residents speak Spanish at home
- 4591.8%Speak English very well
- 48.2%Speak English less than very well
- 50.4% of residents speak other language at home
- 18669.1%Speak English very well
- 8330.9%Speak English less than very well
White (Caucasian) - Speak only English
| Native: | 99.6% (19,999) |
| Foreign-born: | 52.1% (124) |
White (Caucasian) - Speak another language
| Native: | 0.8% (151) |
| Foreign-born: | 54.8% (130) |
Black or African American - Speak only English
| Native: | 100.0% (1,113) |
| Foreign-born: | 46.7% (30) |
Other race - Speak only English
| Native: | 100.0% (122) |
| Foreign-born: | 58.9% (19) |
Two or more races - Speak another language
| Native: | 17.1% (210) |
| Foreign-born: | 97.8% (27) |
White alone - Speak only English
| Native: | 99.1% (19,662) |
| Foreign-born: | 26.1% (62) |
White alone - Speak another language
| Native: | 0.9% (171) |
| Foreign-born: | 73.9% (175) |
Hispanic or Latino - Speak only English
| Native: | 86.7% (821) |
| Foreign-born: | 59.6% (92) |
Hispanic or Latino - Speak another language
| Native: | 18.3% (174) |
| Foreign-born: | 30.9% (48) |
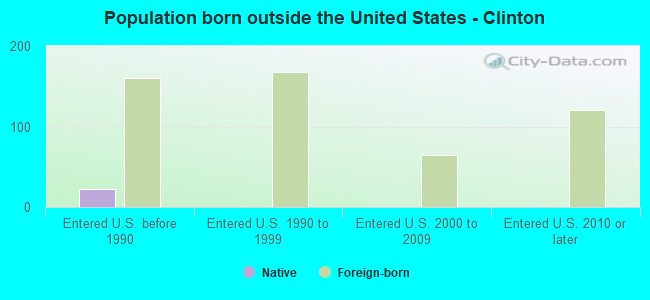
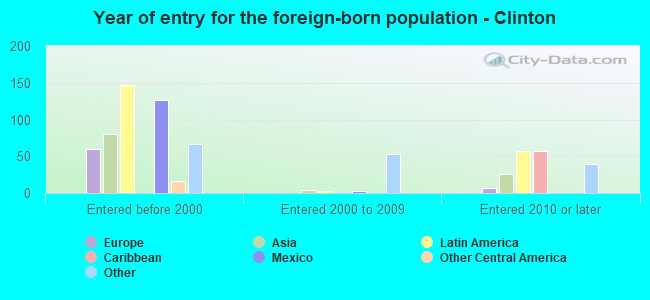
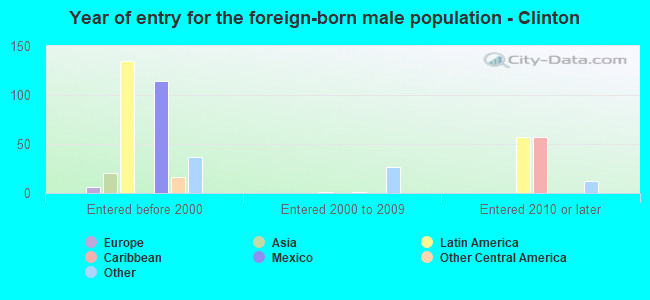
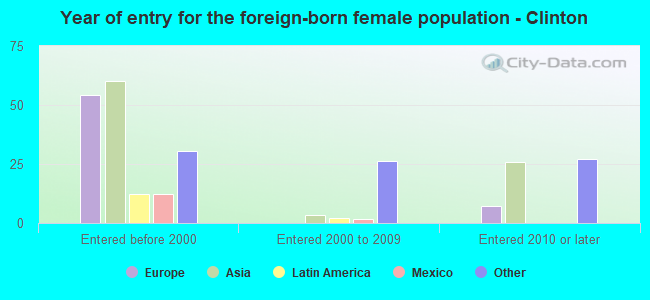
Foreign-born residents in Clinton
510 residents are foreign born (0.7% Latin America, 0.6% Africa, 0.5% Asia, 0.2% Europe).
| This city: | 2.1% |
| Iowa: | 5.6% |

Marital status for residents in Clinton
Marital status - White (Caucasian) population 15 years and over
- Males
- 33.7%Never married
- 45.5%Now married
- 1.1%Separated
- 3.9%Widowed
- 15.8%Divorced
- Females
- 23.5%Never married
- 45.7%Now married
- 2.3%Separated
- 13.0%Widowed
- 15.6%Divorced
Women who gave birth in the past 12 months
| Now married: | 81.8% (272) |
| Unmarried: | 18.2% (60) |
Women who did not give birth in the past 12 months
| Now married: | 44.8% (1,706) |
| Unmarried: | 55.2% (2,101) |
Marital status - Black or African American population 15 years and over
- Males
- 74.8%Never married
- 17.7%Now married
- 0.0%Separated
- 1.1%Widowed
- 6.4%Divorced
- Females
- 60.5%Never married
- 15.2%Now married
- 3.0%Separated
- 0.0%Widowed
- 21.4%Divorced
Women who gave birth in the past 12 months
| Now married: | 0.0% (0) |
| Unmarried: | 100.0% (54) |
Women who did not give birth in the past 12 months
| Now married: | 5.5% (13) |
| Unmarried: | 94.5% (218) |
Marital status - American Indian / Alaska Native population 15 years and over
- Males
- 0.0%Never married
- 100.0%Now married
- 0.0%Separated
- 0.0%Widowed
- 0.0%Divorced
- Females
- 0.0%Never married
- 100.0%Now married
- 0.0%Separated
- 0.0%Widowed
- 0.0%Divorced
Marital status - Asian population 15 years and over
- Males
- 0.0%Never married
- 85.7%Now married
- 0.0%Separated
- 14.3%Widowed
- 0.0%Divorced
- Females
- 1.7%Never married
- 87.9%Now married
- 0.0%Separated
- 10.3%Widowed
- 0.0%Divorced
Women who did not give birth in the past 12 months
| Now married: | 100.0% (22) |
| Unmarried: | 0.0% (0) |
Marital status - Other race population 15 years and over
- Males
- 73.3%Never married
- 0.0%Now married
- 11.7%Separated
- 0.0%Widowed
- 15.0%Divorced
- Females
- 0.0%Never married
- 48.1%Now married
- 0.0%Separated
- 0.0%Widowed
- 51.9%Divorced
Women who did not give birth in the past 12 months
| Now married: | 0.0% (0) |
| Unmarried: | 100.0% (19) |
Marital status - Two or more races population 15 years and over
- Males
- 27.6%Never married
- 67.1%Now married
- 0.0%Separated
- 1.6%Widowed
- 3.7%Divorced
- Females
- 54.3%Never married
- 27.9%Now married
- 9.0%Separated
- 4.3%Widowed
- 4.5%Divorced
Women who gave birth in the past 12 months
| Now married: | 100.0% (1) |
| Unmarried: | 0.0% (0) |
Women who did not give birth in the past 12 months
| Now married: | 29.9% (142) |
| Unmarried: | 70.1% (333) |
Marital status - White alone, not Hispanic / Latino population 15 years and over
- Males
- 33.2%Never married
- 45.6%Now married
- 0.9%Separated
- 4.0%Widowed
- 16.3%Divorced
- Females
- 23.5%Never married
- 45.3%Now married
- 2.2%Separated
- 13.2%Widowed
- 15.8%Divorced
Women who gave birth in the past 12 months
| Now married: | 80.3% (250) |
| Unmarried: | 19.7% (61) |
Women who did not give birth in the past 12 months
| Now married: | 44.6% (1,694) |
| Unmarried: | 55.4% (2,101) |
Marital status - Hispanic or Latino population 15 years and over
- Males
- 42.5%Never married
- 46.9%Now married
- 8.1%Separated
- 0.0%Widowed
- 2.5%Divorced
- Females
- 39.4%Never married
- 45.3%Now married
- 2.3%Separated
- 4.4%Widowed
- 8.5%Divorced
Women who gave birth in the past 12 months
| Now married: | 100.0% (30) |
| Unmarried: | 0.0% (0) |
Women who did not give birth in the past 12 months
| Now married: | 32.0% (95) |
| Unmarried: | 68.0% (203) |
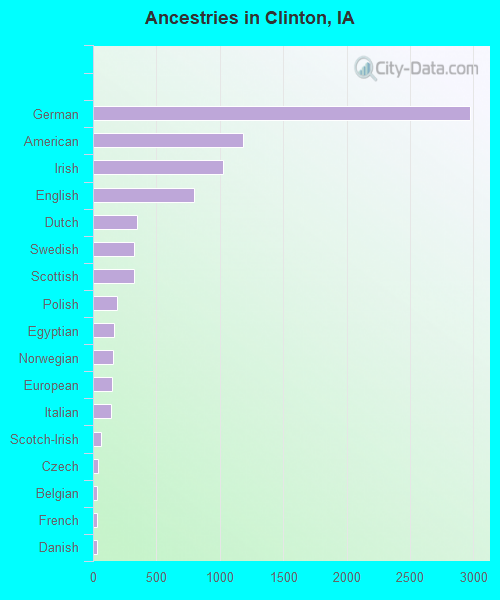
Ancestries in Clinton

- 2,97529.4%German
- 1,18411.7%American
- 1,02910.2%Irish
- 7947.8%English
- 3463.4%Dutch
- 3273.2%Swedish
- 3213.2%Scottish
- 1931.9%Polish
- 1631.6%Egyptian
- 1551.5%Norwegian
- 1521.5%European
- 1451.4%Italian
- 600.6%Scotch-Irish
- 360.4%Czech
- 320.3%Belgian
- 310.3%French
- 290.3%Danish
- 260.3%French Canadian
- 250.2%Iranian
- 180.2%Swiss
- 180.2%Trinidadian and Tobagonian
- 150.1%Scandinavian
- 120.1%Russian
- 80.08%Romanian
- 80.08%Serbian
- 50.05%Iraqi
- 50.05%Croatian
- 50.05%Ukrainian
- 50.05%Welsh
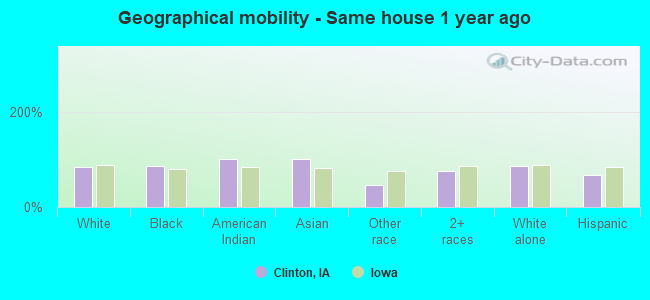
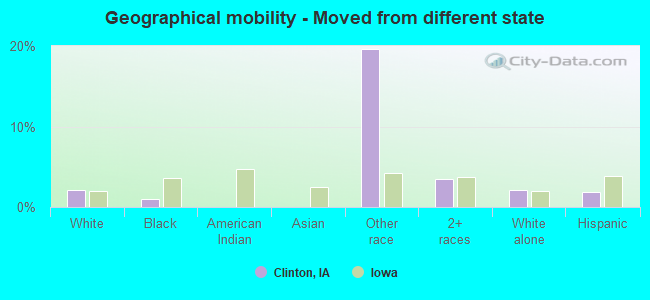
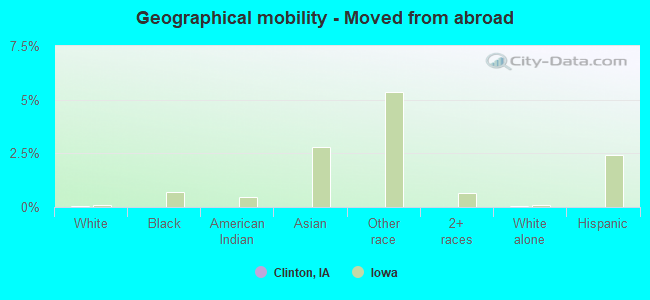
Geographical mobility in Clinton

- Same house 1 year ago
- 17,76584.2%White (Caucasian)
- 1,06584.6%Black or African American
- 99100.0%American Indian / Alaska Native
- 63100.0%Asian
- 7346.7%Other race
- 1,10374.6%Two or more races
- 17,72685.0%White alone, not Hispanic / Latino
- 81667.3%Hispanic or Latino
-
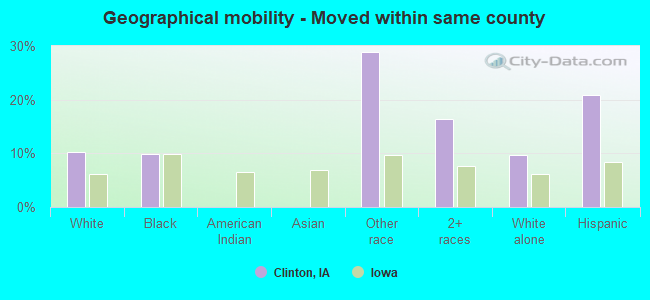
- Moved within same county
- 2,14410.2%White / Caucasian
- 1249.8%Black or African American
- 4528.9%Other race
- 24216.3%Two or more races
- 2,0159.7%White alone, not Hispanic / Latino
- 25421.0%Hispanic or Latino
-
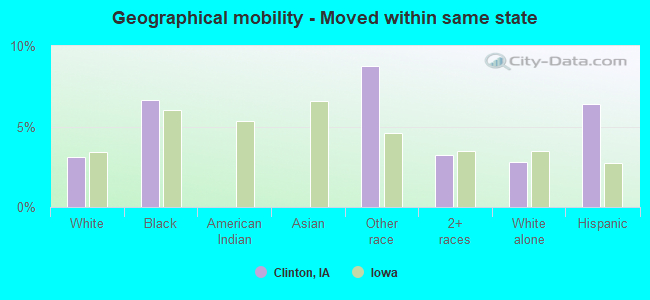
- Moved within same state
- 6593.1%White / Caucasian
- 846.7%Black or African American
- 148.8%Other race
- 483.3%Two or more races
- 5802.8%White alone, not Hispanic / Latino
- 776.4%Hispanic or Latino
-
- Moved from different state
- 4382.1%White / Caucasian
- 131.0%Black or African American
- 3119.6%Other race
- 523.5%Two or more races
- 4482.2%White alone, not Hispanic / Latino
- 221.8%Hispanic or Latino
-
- Moved from abroad
- 80.0%White
- 80.0%White alone, not Hispanic / Latino
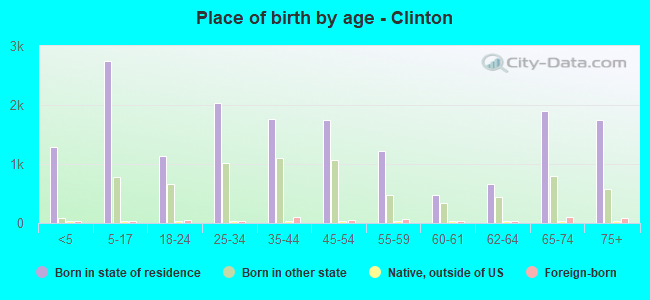
Children Nativity (place of birth) in Clinton
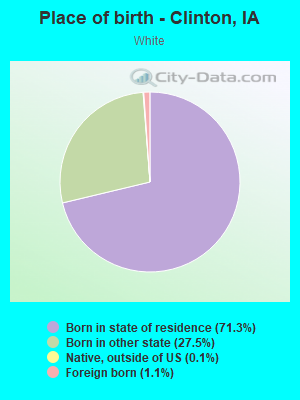
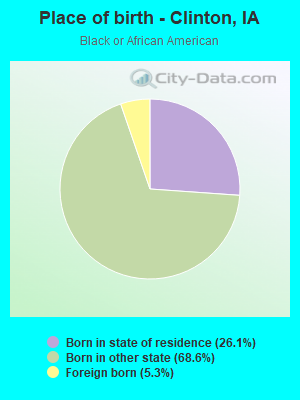
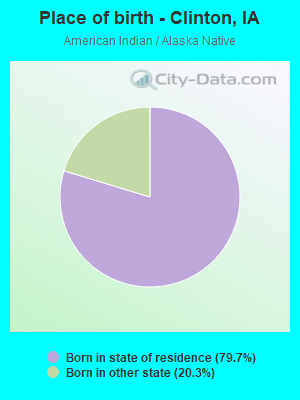
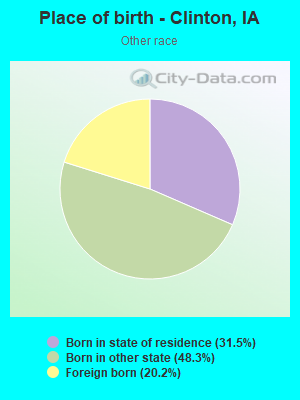
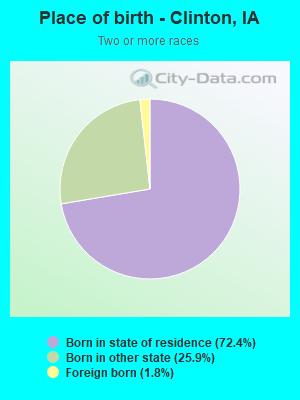
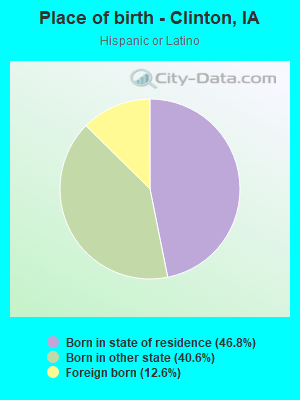
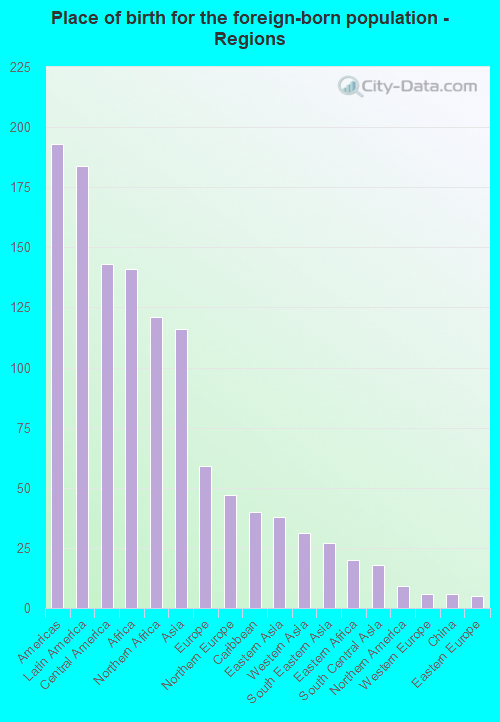
Place of birth for residents in Clinton
![Place of birth for the foreign-born population - Regions]()
- 193Americas
- 184Latin America
- 143Central America
- 141Africa
- 121Northern Africa
- 116Asia
- 59Europe
- 47Northern Europe
- 40Caribbean
- 38Eastern Asia
- 31Western Asia
- 27South Eastern Asia
- 20Eastern Africa
- 18South Central Asia
- 9Northern America
- 6Western Europe
- 6China
- 5Eastern Europe
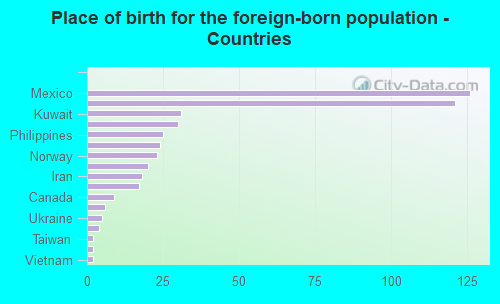
![Place of birth for the foreign-born population - Countries]()
- 126Mexico
- 121Egypt
- 31Kuwait
- 30Korea
- 25Philippines
- 24England
- 23Norway
- 20Eritrea
- 18Iran
- 17Guatemala
- 9Canada
- 6Netherlands
- 5Ukraine
- 4China
- 2Taiwan
- 2Japan
- 2Vietnam
Grandparents responsible for own grandchildren in Clinton
Zip codes: 52732.