Races in Clinton, Oklahoma (OK) Detailed Stats
Data:
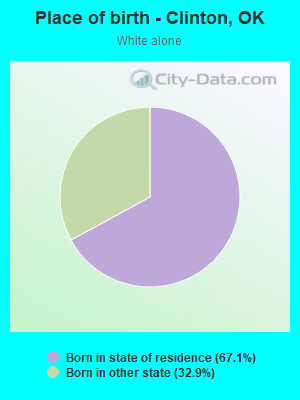
Races - White alone (%)
Races - White alone (% change since 2000)
Races - Black alone (%)
Races - Black alone (% change since 2000)
Races - American Indian alone (%)
Races - American Indian alone (% change since 2000)
Races - Asian alone (%)
Races - Asian alone (% change since 2000)
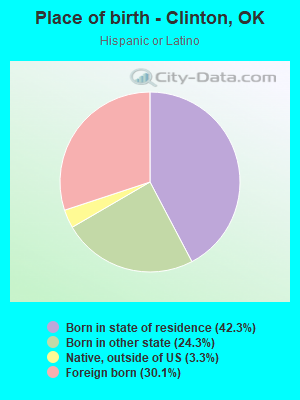
Races - Hispanic (%)
Races - Hispanic (% change since 2000)
Races - Native Hawaiian and Other Pacific Islander alone (%)
Races - Native Hawaiian and Other Pacific Islander alone (% change since 2000)
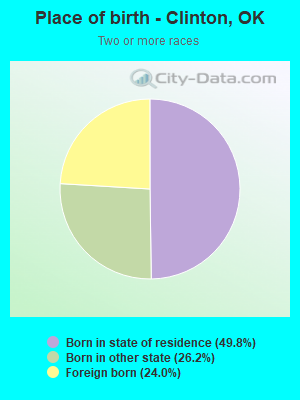
Races - Two or more races(%)
Races - Two or more races(% change since 2000)
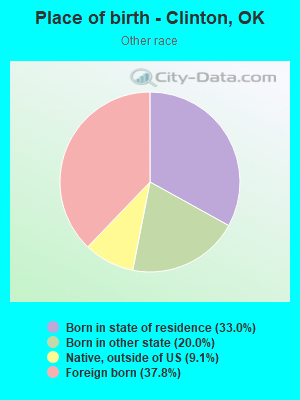
Races - Other race alone (%)
Races - Other race alone (% change since 2000)
Racial diversity
Place of birth - Born in state of residence (%)
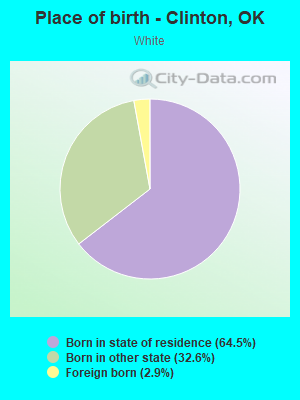
Place of birth - Born in state of residence (%) - White
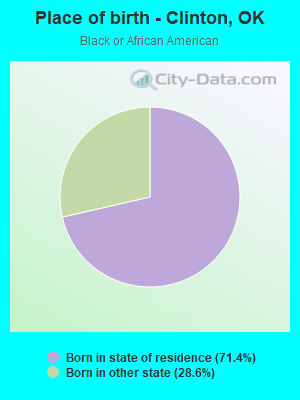
Place of birth - Born in state of residence (%) - Black or African American
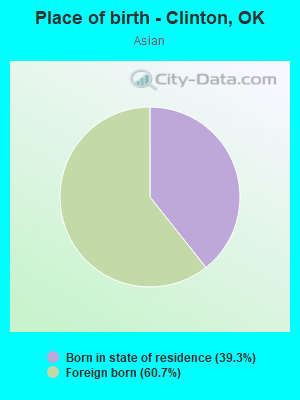
Place of birth - Born in state of residence (%) - Asian
Place of birth - Born in state of residence (%) - Hispanic or Latino
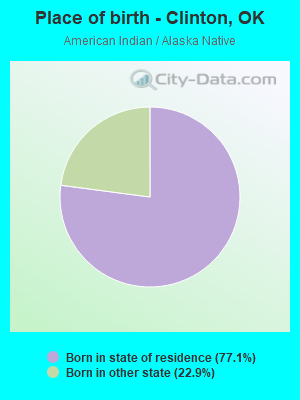
Place of birth - Born in state of residence (%) - American Indian and Alaska Native
Place of birth - Born in state of residence (%) - Multirace
Place of birth - Born in state of residence (%) - Other Race
Place of birth - Born in other state (%)
Place of birth - Born in other state (%) - White
Place of birth - Born in other state (%) - Black or African American
Place of birth - Born in other state (%) - Asian
Place of birth - Born in other state (%) - Hispanic or Latino
Place of birth - Born in other state (%) - American Indian and Alaska Native
Place of birth - Born in other state (%) - Multirace
Place of birth - Born in other state (%) - Other Race
Place of birth - Native, outside of US (%)
Place of birth - Native, outside of US (%) - White
Place of birth - Native, outside of US (%) - Black or African American
Place of birth - Native, outside of US (%) - Asian
Place of birth - Native, outside of US (%) - Hispanic or Latino
Place of birth - Native, outside of US (%) - American Indian and Alaska Native
Place of birth - Native, outside of US (%) - Multirace
Place of birth - Native, outside of US (%) - Other Race
Place of birth - Foreign born (%)
Place of birth - Foreign born (%) - White
Place of birth - Foreign born (%) - Black or African American
Place of birth - Foreign born (%) - Asian
Place of birth - Foreign born (%) - Hispanic or Latino
Place of birth - Foreign born (%) - American Indian and Alaska Native
Place of birth - Foreign born (%) - Multirace
Place of birth - Foreign born (%) - Other Race
Residents speaking English at home (%)
Residents speaking English at home - Born in the United States (%)
Residents speaking English at home - Native, born elsewhere (%)
Residents speaking English at home - Foreign born (%)
Residents speaking Spanish at home (%)
Residents speaking Spanish at home - Born in the United States (%)
Residents speaking Spanish at home - Native, born elsewhere (%)
Residents speaking Spanish at home - Foreign born (%)
Residents speaking other language at home (%)
Residents speaking other language at home - Born in the United States (%)
Residents speaking other language at home - Native, born elsewhere (%)
Residents speaking other language at home - Foreign born (%)
Marital status - Never married (%)
Marital status - Now married (%)
Marital status - Separated (%)
Marital status - Widowed (%)
Marital status - Divorced (%)
Ancestries Reported - Arab (%)
Ancestries Reported - Czech (%)
Ancestries Reported - Danish (%)
Ancestries Reported - Dutch (%)
Ancestries Reported - English (%)
Ancestries Reported - French (%)
Ancestries Reported - French Canadian (%)
Ancestries Reported - German (%)
Ancestries Reported - Greek (%)
Ancestries Reported - Hungarian (%)
Ancestries Reported - Irish (%)
Ancestries Reported - Italian (%)
Ancestries Reported - Lithuanian (%)
Ancestries Reported - Norwegian (%)
Ancestries Reported - Polish (%)
Ancestries Reported - Portuguese (%)
Ancestries Reported - Russian (%)
Ancestries Reported - Scotch-Irish (%)
Ancestries Reported - Scottish (%)
Ancestries Reported - Slovak (%)
Ancestries Reported - Subsaharan African (%)
Ancestries Reported - Swedish (%)
Ancestries Reported - Swiss (%)
Ancestries Reported - Ukrainian (%)
Ancestries Reported - United States (%)
Ancestries Reported - Welsh (%)
Ancestries Reported - West Indian (%)
Ancestries Reported - Other (%)
Geographical mobility - Same house 1 year ago (%)
Geographical mobility - Same house 1 year ago (%) - White
Geographical mobility - Same house 1 year ago (%) - Black or African American
Geographical mobility - Same house 1 year ago (%) - Asian
Geographical mobility - Same house 1 year ago (%) - Hispanic or Latino
Geographical mobility - Same house 1 year ago (%) - American Indian and Alaska Native
Geographical mobility - Same house 1 year ago (%) - Multirace
Geographical mobility - Same house 1 year ago (%) - Other Race
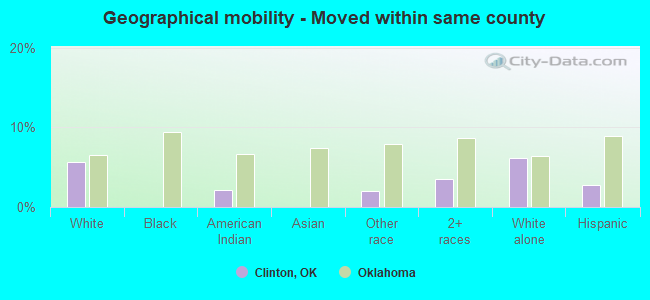
Geographical mobility - Moved within same county (%)
Geographical mobility - Moved within same county (%) - White
Geographical mobility - Moved within same county (%) - Black or African American
Geographical mobility - Moved within same county (%) - Asian
Geographical mobility - Moved within same county (%) - Hispanic or Latino
Geographical mobility - Moved within same county (%) - American Indian and Alaska Native
Geographical mobility - Moved within same county (%) - Multirace
Geographical mobility - Moved within same county (%) - Other Race
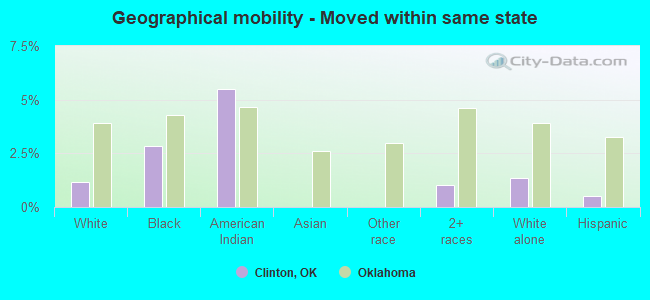
Geographical mobility - Moved from different county within same state (%)
Geographical mobility - Moved from different county within same state (%) - White
Geographical mobility - Moved from different county within same state (%) - Black or African American
Geographical mobility - Moved from different county within same state (%) - Asian
Geographical mobility - Moved from different county within same state (%) - Hispanic or Latino
Geographical mobility - Moved from different county within same state (%) - American Indian and Alaska Native
Geographical mobility - Moved from different county within same state (%) - Multirace
Geographical mobility - Moved from different county within same state (%) - Other Race
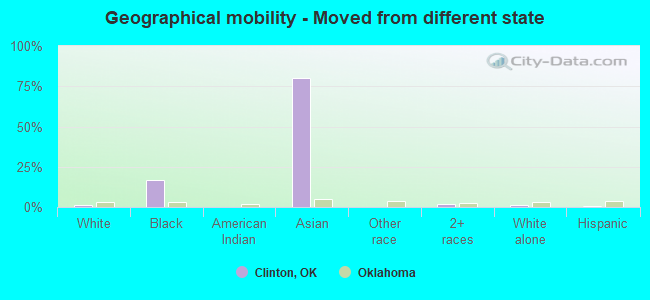
Geographical mobility - Moved from different state (%)
Geographical mobility - Moved from different state (%) - White
Geographical mobility - Moved from different state (%) - Black or African American
Geographical mobility - Moved from different state (%) - Asian
Geographical mobility - Moved from different state (%) - Hispanic or Latino
Geographical mobility - Moved from different state (%) - American Indian and Alaska Native
Geographical mobility - Moved from different state (%) - Multirace
Geographical mobility - Moved from different state (%) - Other Race
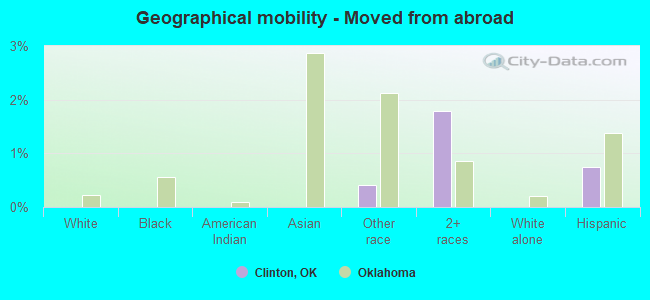
Geographical mobility - Moved from abroad (%)
Geographical mobility - Moved from abroad (%) - White
Geographical mobility - Moved from abroad (%) - Black or African American
Geographical mobility - Moved from abroad (%) - Asian
Geographical mobility - Moved from abroad (%) - Hispanic or Latino
Geographical mobility - Moved from abroad (%) - American Indian and Alaska Native
Geographical mobility - Moved from abroad (%) - Multirace
Geographical mobility - Moved from abroad (%) - Other Race
Place of birth for the foreign-born population - Ireland (%)
Place of birth for the foreign-born population - Denmark (%)
Place of birth for the foreign-born population - Norway (%)
Place of birth for the foreign-born population - Sweden (%)
Place of birth for the foreign-born population - United Kingdom (%)
Place of birth for the foreign-born population - England (%)
Place of birth for the foreign-born population - Scotland (%)
Place of birth for the foreign-born population - Other Northern Europe (%)
Place of birth for the foreign-born population - Austria (%)
Place of birth for the foreign-born population - Belgium (%)
Place of birth for the foreign-born population - France (%)
Place of birth for the foreign-born population - Germany (%)
Place of birth for the foreign-born population - Netherlands (%)
Place of birth for the foreign-born population - Switzerland (%)
Place of birth for the foreign-born population - Other Western Europe (%)
Place of birth for the foreign-born population - Greece (%)
Place of birth for the foreign-born population - Italy (%)
Place of birth for the foreign-born population - Portugal (%)
Place of birth for the foreign-born population - Spain (%)
Place of birth for the foreign-born population - Other Southern Europe (%)
Place of birth for the foreign-born population - Albania (%)
Place of birth for the foreign-born population - Belarus (%)
Place of birth for the foreign-born population - Bosnia and Herzegovina (%)
Place of birth for the foreign-born population - Bulgaria (%)
Place of birth for the foreign-born population - Croatia (%)
Place of birth for the foreign-born population - Czechoslovakia (%)
Place of birth for the foreign-born population - Hungary (%)
Place of birth for the foreign-born population - Latvia (%)
Place of birth for the foreign-born population - Lithuania (%)
Place of birth for the foreign-born population - North Macedonia (Macedonia) (%)
Place of birth for the foreign-born population - Moldova (%)
Place of birth for the foreign-born population - Poland (%)
Place of birth for the foreign-born population - Romania (%)
Place of birth for the foreign-born population - Russia (%)
Place of birth for the foreign-born population - Serbia (%)
Place of birth for the foreign-born population - Ukraine (%)
Place of birth for the foreign-born population - Other Eastern Europe (%)
Place of birth for the foreign-born population - China (%)
Place of birth for the foreign-born population - Hong Kong (%)
Place of birth for the foreign-born population - Taiwan (%)
Place of birth for the foreign-born population - Japan (%)
Place of birth for the foreign-born population - Korea (%)
Place of birth for the foreign-born population - Other Eastern Asia (%)
Place of birth for the foreign-born population - Afghanistan (%)
Place of birth for the foreign-born population - Bangladesh (%)
Place of birth for the foreign-born population - India (%)
Place of birth for the foreign-born population - Iran (%)
Place of birth for the foreign-born population - Kazakhstan (%)
Place of birth for the foreign-born population - Nepal (%)
Place of birth for the foreign-born population - Pakistan (%)
Place of birth for the foreign-born population - Sri Lanka (%)
Place of birth for the foreign-born population - Uzbekistan (%)
Place of birth for the foreign-born population - Other South Central Asia (%)
Place of birth for the foreign-born population - Burma (%)
Place of birth for the foreign-born population - Cambodia (%)
Place of birth for the foreign-born population - Indonesia (%)
Place of birth for the foreign-born population - Laos (%)
Place of birth for the foreign-born population - Malaysia (%)
Place of birth for the foreign-born population - Philippines (%)
Place of birth for the foreign-born population - Singapore (%)
Place of birth for the foreign-born population - Thailand (%)
Place of birth for the foreign-born population - Vietnam (%)
Place of birth for the foreign-born population - Other South Eastern Asia (%)
Place of birth for the foreign-born population - Armenia (%)
Place of birth for the foreign-born population - Iraq (%)
Place of birth for the foreign-born population - Israel (%)
Place of birth for the foreign-born population - Jordan (%)
Place of birth for the foreign-born population - Kuwait (%)
Place of birth for the foreign-born population - Lebanon (%)
Place of birth for the foreign-born population - Saudi Arabia (%)
Place of birth for the foreign-born population - Syria (%)
Place of birth for the foreign-born population - Turkey (%)
Place of birth for the foreign-born population - Yemen (%)
Place of birth for the foreign-born population - Other Western Asia (%)
Place of birth for the foreign-born population - Eritrea (%)
Place of birth for the foreign-born population - Ethiopia (%)
Place of birth for the foreign-born population - Kenya (%)
Place of birth for the foreign-born population - Somalia (%)
Place of birth for the foreign-born population - Uganda (%)
Place of birth for the foreign-born population - Zimbabwe (%)
Place of birth for the foreign-born population - Other Eastern Africa (%)
Place of birth for the foreign-born population - Cameroon (%)
Place of birth for the foreign-born population - Congo (%)
Place of birth for the foreign-born population - Democratic Republic of Congo (Zaire) (%)
Place of birth for the foreign-born population - Other Middle Africa (%)
Place of birth for the foreign-born population - Egypt (%)
Place of birth for the foreign-born population - Morocco (%)
Place of birth for the foreign-born population - Sudan (%)
Place of birth for the foreign-born population - Other Northern Africa (%)
Place of birth for the foreign-born population - South Africa (%)
Place of birth for the foreign-born population - Other Southern Africa (%)
Place of birth for the foreign-born population - Cabo Verde (%)
Place of birth for the foreign-born population - Ghana (%)
Place of birth for the foreign-born population - Liberia (%)
Place of birth for the foreign-born population - Nigeria (%)
Place of birth for the foreign-born population - Senegal (%)
Place of birth for the foreign-born population - Sierra Leone (%)
Place of birth for the foreign-born population - Other Western Africa (%)
Place of birth for the foreign-born population - Australia (%)
Place of birth for the foreign-born population - New Zealand (%)
Place of birth for the foreign-born population - Fiji (%)
Place of birth for the foreign-born population - Micronesia (%)
Place of birth for the foreign-born population - Bahamas (%)
Place of birth for the foreign-born population - Barbados (%)
Place of birth for the foreign-born population - Cuba (%)
Place of birth for the foreign-born population - Dominica (%)
Place of birth for the foreign-born population - Dominican Republic (%)
Place of birth for the foreign-born population - Grenada (%)
Place of birth for the foreign-born population - Haiti (%)
Place of birth for the foreign-born population - Jamaica (%)
Place of birth for the foreign-born population - St. Vincent and the Grenadines (%)
Place of birth for the foreign-born population - Trinidad and Tobago (%)
Place of birth for the foreign-born population - West Indies (%)
Place of birth for the foreign-born population - Other Caribbean (%)
Place of birth for the foreign-born population - Belize (%)
Place of birth for the foreign-born population - Costa Rica (%)
Place of birth for the foreign-born population - El Salvador (%)
Place of birth for the foreign-born population - Guatemala (%)
Place of birth for the foreign-born population - Honduras (%)
Place of birth for the foreign-born population - Mexico (%)
Place of birth for the foreign-born population - Nicaragua (%)
Place of birth for the foreign-born population - Panama (%)
Place of birth for the foreign-born population - Other Central America (%)
Place of birth for the foreign-born population - Argentina (%)
Place of birth for the foreign-born population - Bolivia (%)
Place of birth for the foreign-born population - Brazil (%)
Place of birth for the foreign-born population - Chile (%)
Place of birth for the foreign-born population - Colombia (%)
Place of birth for the foreign-born population - Ecuador (%)
Place of birth for the foreign-born population - Guyana (%)
Place of birth for the foreign-born population - Peru (%)
Place of birth for the foreign-born population - Uruguay (%)
Place of birth for the foreign-born population - Venezuela (%)
Place of birth for the foreign-born population - Other South America (%)
Place of birth for the foreign-born population - Canada (%)
Place of birth for the foreign-born population - Other Northern America (%)
Place of birth for the foreign-born population - Other (%)
Latest news about races in Clinton, OK collected exclusively by city-data.com from local newspapers, TV, and radio stations
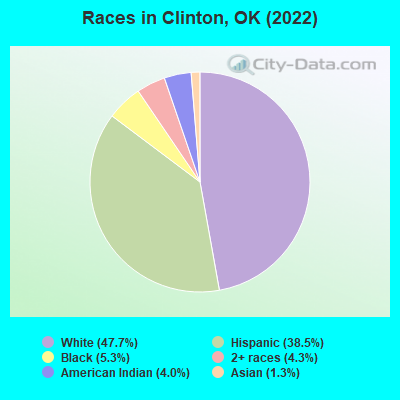
According to 2022 data, the most numerous races in Clinton, OK are White alone (4,101 residents), Hispanic (3,314 residents), and Two or more races (374 residents). 71.1% of Clinton residents speak English at home. 11.8% of Clinton, OK residents are foreign-born (11.3% born in Latin America), which is 49.3% greater than the foreign-born rate of 6.0% across the entire state of Oklahoma.
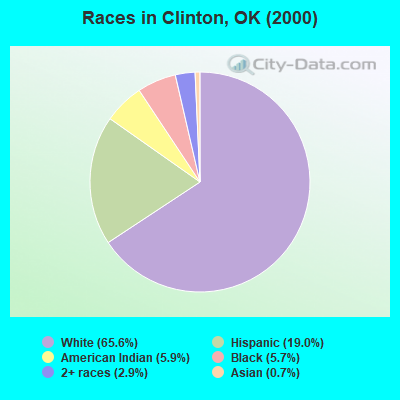
Race distribution in Clinton
2000 2022
2,556,368 74.1% White alone 266,158 7.7% American Indian alone 257,981 7.5% Black alone 179,304 5.2% Hispanic 140,249 4.1% Two or more races 46,172 1.3% Asian alone 2,322 0.07% Other race alone 2,100 0.06% Native Hawaiian and Other
2,517,403 62.6% White alone 486,692 12.1% Hispanic 364,453 9.1% Two or more races 273,650 6.8% American Indian alone 268,543 6.7% Black alone 92,672 2.3% Asian alone 10,786 0.3% Other race alone 5,601 0.1% Native Hawaiian and Other
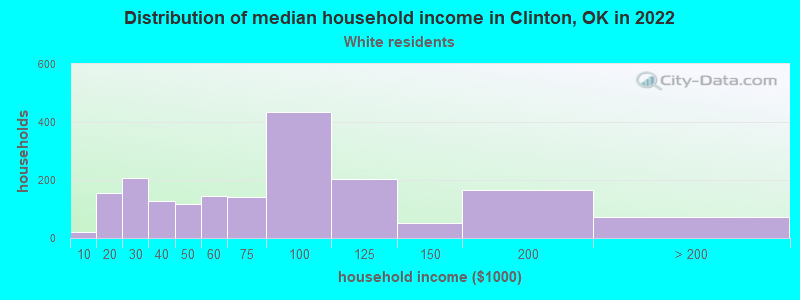
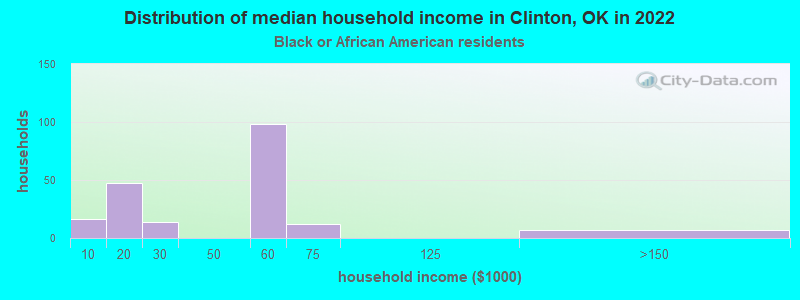
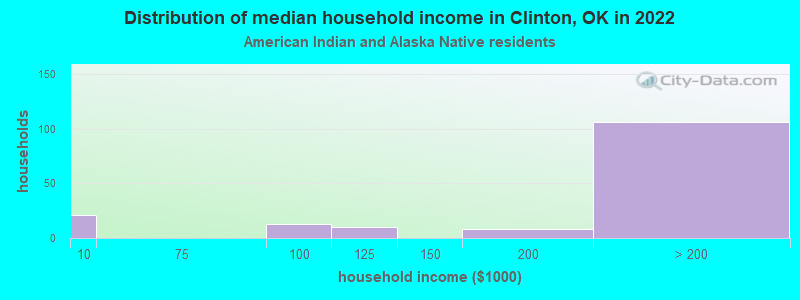
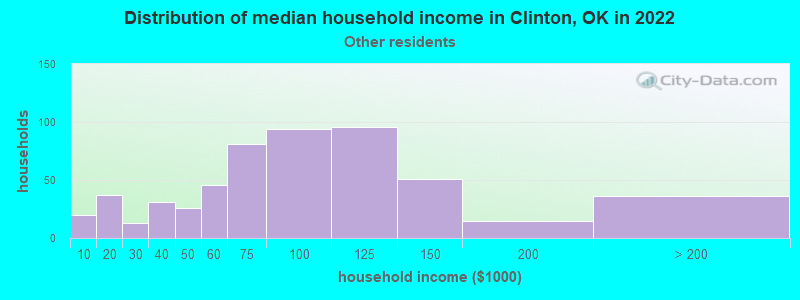
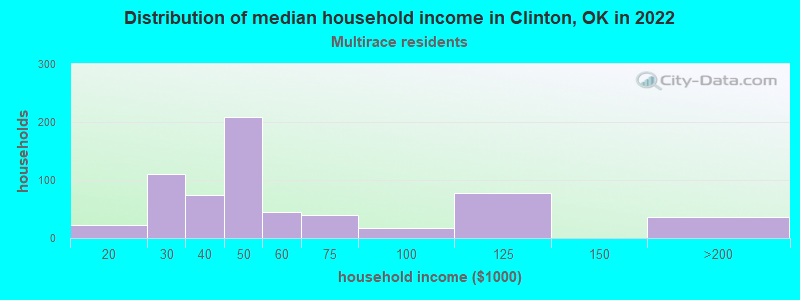
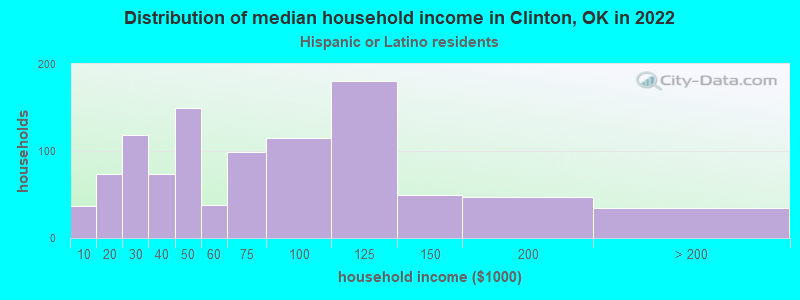
Income and house value in Clinton Median household income in 2022 $77,087 White non-Hispanic householders$56,047 Black householdersover $200,000 American Indian and Alaska Native householders$80,855 Some other race householders$45,369 Two or more races householders$59,447 Hispanic or Latino race householdersMedian 2022 house value $153,144 White Non-Hispanic householders$103,575 Black or African American householders$58,693 American Indian or Alaska Native householders $55,487 Asian householders$75,955 Some other race householders$101,603 Two or more races householders$81,381 Hispanic or Latino householders
Median age by race in Clinton
45.1 Median age for White residents42.7 46.0 53.2 Median age for Black or African American residents47.0 60.6 23.8 Median age for American Indian / Alaska Native residents23.2 24.1 28.2 Median age for Asian residents-662,601,625.4 28.4 -725,225,224.5 Median age for Native Hawaiian / Pacific Islander residents-675,324,674.6 -767,251,461.2 31.1 Median age for Other race residents32.5 31.3 29.1 Median age for Two or more races residents23.0 38.3 46.4 Median age for White alone residents46.5 46.1 25.5 Median age for Hispanic or Latino residents22.6 28.2
Owner/renter occupied households by race in Clinton
House owners and renters - White residents 1,517 81.1% Owner occupied353 18.9% Renter occupiedHouse owners and renters - Black or African American residents 152 71.1% Owner occupied62 28.9% Renter occupiedHouse owners and renters - American Indian / Alaska Native residents 128 79.1% Owner occupied34 20.9% Renter occupiedHouse owners and renters - Asian residents 55 100.0% Renter occupiedHouse owners and renters - Other race residents 368 66.4% Owner occupied186 33.6% Renter occupiedHouse owners and renters - Two or more races residents 414 62.9% Owner occupied244 37.1% Renter occupiedHouse owners and renters - White alone residents 1,459 83.4% Owner occupied290 16.6% Renter occupiedHouse owners and renters - Hispanic or Latino residents 709 68.8% Owner occupied322 31.2% Renter occupied
Language usage in Clinton
English speakers - Total 71.1% of residents of Clinton speak English at home.
27.9% of residents speak Spanish at home 1,016 45.5% Speak English very well1,218 54.5% Speak English less than very well1.6% of residents speak other language at home 85 64.9% Speak English very well46 35.1% Speak English less than very well
English speakers - Born in the United States 76.1% of residents of Clinton speak English at home.
25.9% of residents speak Spanish at home 326 52.1% Speak English very well300 47.9% Speak English less than very well
English speakers - Native, born elsewhere 0.0% of residents of Clinton speak English at home.
113.5% of residents speak Spanish at home 34 31.2% Speak English very well75 68.8% Speak English less than very well
English speakers - Foreign-born 3.6% of residents of Clinton speak English at home.
93.2% of residents speak Spanish at home 325 34.9% Speak English very well607 65.1% Speak English less than very well4.7% of residents speak other language at home 47 100.0% Speak English less than very well
White (Caucasian) - Speak another language Native:
6.1% (259)Foreign-born:
83.5% (110)
Asian - Speak another language Native:
100.0% (28)Foreign-born:
100.0% (46)
Other race - Speak only English Native:
10.9% (82)Foreign-born:
3.8% (22)
Other race - Speak another language Native:
91.6% (687)Foreign-born:
96.2% (549)
Two or more races - Speak only English Native:
67.5% (826)Foreign-born:
6.0% (26)
Two or more races - Speak another language Native:
39.3% (481)Foreign-born:
94.2% (411)
Hispanic or Latino - Speak only English Native:
39.3% (780)Foreign-born:
4.4% (43)
Hispanic or Latino - Speak another language Native:
60.3% (1,197)Foreign-born:
95.5% (949)
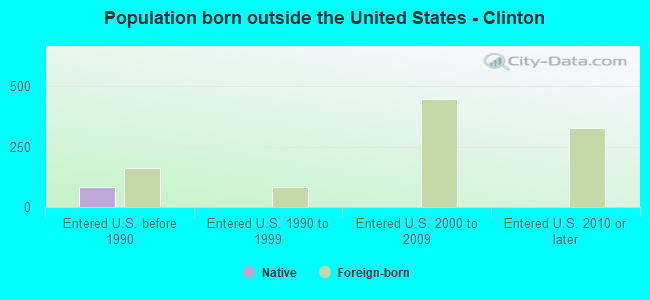
Foreign-born residents in Clinton 1,018 residents are foreign born (11.3% Latin America ).
This city:
11.8%Oklahoma:
6.1%
Marital status for residents in Clinton Marital status - White (Caucasian) population 15 years and over
Males 24.2% Never married54.3% Now married1.6% Separated4.5% Widowed15.4% DivorcedFemales 18.8% Never married55.8% Now married0.9% Separated10.8% Widowed13.6% DivorcedWomen who gave birth in the past 12 months Now married:
63.7% (56)Unmarried:
36.3% (32)
Women who did not give birth in the past 12 months Now married:
54.3% (406)Unmarried:
45.7% (341)
Marital status - Black or African American population 15 years and over
Males 32.4% Never married19.1% Now married0.0% Separated0.0% Widowed48.6% DivorcedFemales 34.4% Never married55.5% Now married0.0% Separated3.4% Widowed6.7% DivorcedWomen who did not give birth in the past 12 months Now married:
27.0% (31)Unmarried:
73.0% (84)
Marital status - American Indian / Alaska Native population 15 years and over
Males 56.2% Never married34.7% Now married0.0% Separated0.0% Widowed9.1% DivorcedFemales 5.9% Never married86.4% Now married0.0% Separated7.7% Widowed0.0% DivorcedWomen who did not give birth in the past 12 months Now married:
93.2% (139)Unmarried:
6.8% (10)
Marital status - Other race population 15 years and over
Males 27.6% Never married49.7% Now married5.7% Separated0.0% Widowed17.0% DivorcedFemales 27.9% Never married68.6% Now married3.6% Separated0.0% Widowed0.0% DivorcedWomen who did not give birth in the past 12 months Now married:
60.1% (204)Unmarried:
39.9% (136)
Marital status - Two or more races population 15 years and over
Males 39.7% Never married49.3% Now married8.4% Separated0.0% Widowed2.6% DivorcedFemales 36.9% Never married50.1% Now married6.1% Separated6.9% Widowed0.0% DivorcedWomen who gave birth in the past 12 months Now married:
100.0% (11)Unmarried:
0.0% (0)
Women who did not give birth in the past 12 months Now married:
47.9% (230)Unmarried:
52.1% (250)
Marital status - White alone, not Hispanic / Latino population 15 years and over
Males 19.8% Never married58.9% Now married1.9% Separated4.9% Widowed14.5% DivorcedFemales 16.9% Never married56.5% Now married1.0% Separated11.5% Widowed14.0% DivorcedWomen who gave birth in the past 12 months Now married:
63.7% (58)Unmarried:
36.3% (33)
Women who did not give birth in the past 12 months Now married:
54.0% (370)Unmarried:
46.0% (315)
Marital status - Hispanic or Latino population 15 years and over
Males 38.9% Never married41.8% Now married5.6% Separated0.6% Widowed13.0% DivorcedFemales 32.9% Never married62.6% Now married3.6% Separated0.0% Widowed0.9% DivorcedWomen who did not give birth in the past 12 months Now married:
56.4% (399)Unmarried:
43.6% (308)
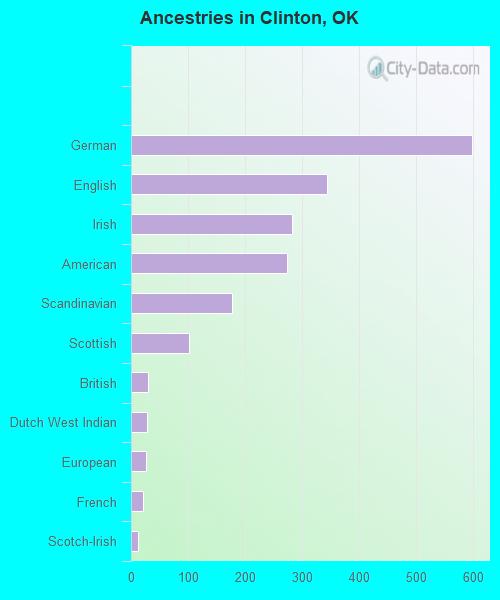
Ancestries in Clinton
598 12.0% German343 6.9% English283 5.7% Irish274 5.5% American177 3.5% Scandinavian101 2.0% Scottish29 0.6% British28 0.6% Dutch West Indian26 0.5% European21 0.4% French12 0.2% Scotch-Irish
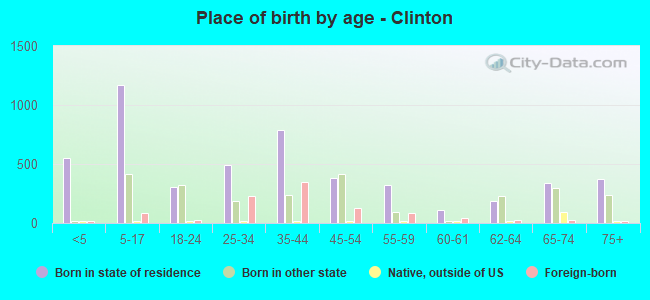
Children Nativity (place of birth) in Clinton
Children under 6 years - Living with two parents Both parents native 297 100.0% NativeOne native, one foreign-born parent 81 100.0% NativeChildren under 6 years - Living with one parent Native parent 182 100.0% NativeForeign-born parent 90 76.1% Native28 23.9% Foreign-bornChildren 6 to 17 years - Living with two parents Both parents native 654 99.7% Native2 0.3% Foreign-bornBoth parents foreign-born 324 84.5% Native60 15.5% Foreign-bornOne native, one foreign-born parent 79 100.0% NativeChildren 6 to 17 years - Living with one parent Native parent 144 100.0% NativeForeign-born parent 165 53.2% Native145 46.8% Foreign-born
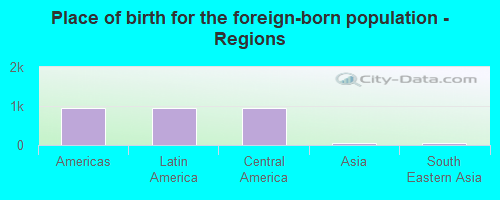
Place of birth for residents in Clinton 953 Americas953 Latin America953 Central America64 Asia64 South Eastern Asia
Grandparents responsible for own grandchildren in Clinton
Grandparents (30 to 59 years) White / Caucasian 20 100.0% Responsible for grandchildrenWhite alone, not Hispanic / Latino 21 100.0% Responsible for grandchildren
Grandparents (60 years and over) White / Caucasian 15 100.0% Not responsible for grandchildren