Races in Cloverly, Maryland (MD) Detailed Stats
Data:
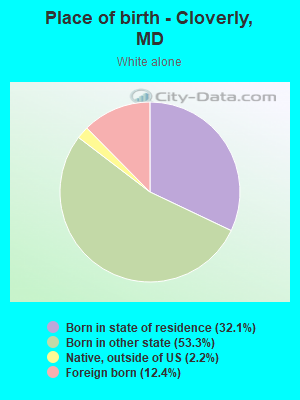
Races - White alone (%)
Races - White alone (% change since 2000)
Races - Black alone (%)
Races - Black alone (% change since 2000)
Races - American Indian alone (%)
Races - American Indian alone (% change since 2000)
Races - Asian alone (%)
Races - Asian alone (% change since 2000)
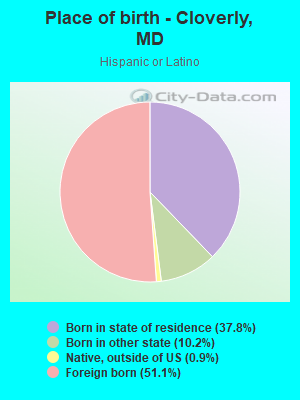
Races - Hispanic (%)
Races - Hispanic (% change since 2000)
Races - Native Hawaiian and Other Pacific Islander alone (%)
Races - Native Hawaiian and Other Pacific Islander alone (% change since 2000)
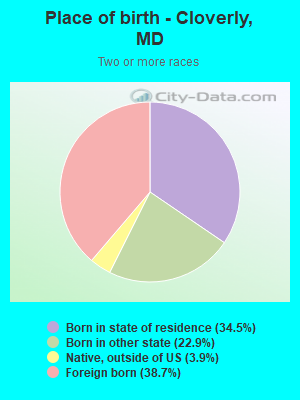
Races - Two or more races(%)
Races - Two or more races(% change since 2000)
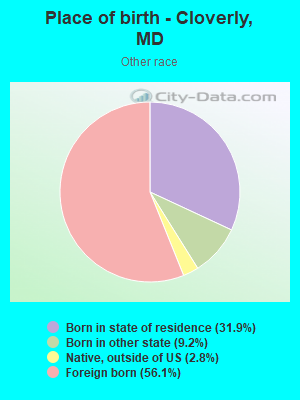
Races - Other race alone (%)
Races - Other race alone (% change since 2000)
Racial diversity
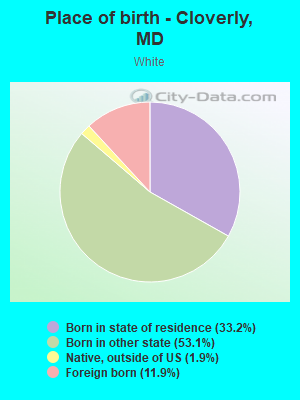
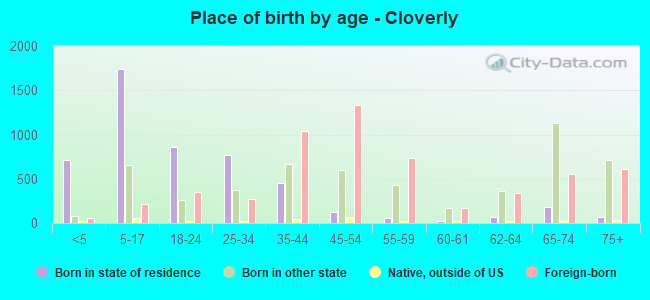
Place of birth - Born in state of residence (%)
Place of birth - Born in state of residence (%) - White
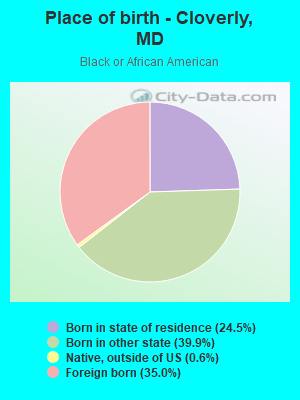
Place of birth - Born in state of residence (%) - Black or African American
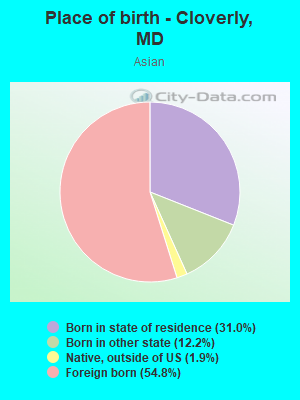
Place of birth - Born in state of residence (%) - Asian
Place of birth - Born in state of residence (%) - Hispanic or Latino
Place of birth - Born in state of residence (%) - American Indian and Alaska Native
Place of birth - Born in state of residence (%) - Multirace
Place of birth - Born in state of residence (%) - Other Race
Place of birth - Born in other state (%)
Place of birth - Born in other state (%) - White
Place of birth - Born in other state (%) - Black or African American
Place of birth - Born in other state (%) - Asian
Place of birth - Born in other state (%) - Hispanic or Latino
Place of birth - Born in other state (%) - American Indian and Alaska Native
Place of birth - Born in other state (%) - Multirace
Place of birth - Born in other state (%) - Other Race
Place of birth - Native, outside of US (%)
Place of birth - Native, outside of US (%) - White
Place of birth - Native, outside of US (%) - Black or African American
Place of birth - Native, outside of US (%) - Asian
Place of birth - Native, outside of US (%) - Hispanic or Latino
Place of birth - Native, outside of US (%) - American Indian and Alaska Native
Place of birth - Native, outside of US (%) - Multirace
Place of birth - Native, outside of US (%) - Other Race
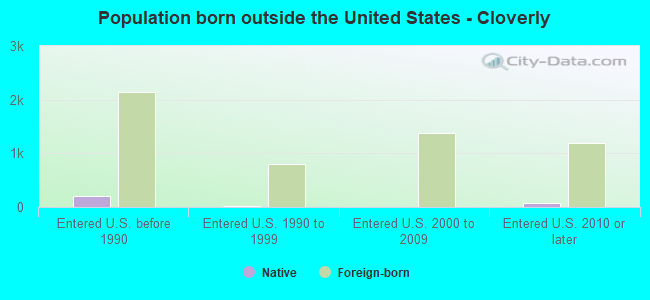
Place of birth - Foreign born (%)
Place of birth - Foreign born (%) - White
Place of birth - Foreign born (%) - Black or African American
Place of birth - Foreign born (%) - Asian
Place of birth - Foreign born (%) - Hispanic or Latino
Place of birth - Foreign born (%) - American Indian and Alaska Native
Place of birth - Foreign born (%) - Multirace
Place of birth - Foreign born (%) - Other Race
Residents speaking English at home (%)
Residents speaking English at home - Born in the United States (%)
Residents speaking English at home - Native, born elsewhere (%)
Residents speaking English at home - Foreign born (%)
Residents speaking Spanish at home (%)
Residents speaking Spanish at home - Born in the United States (%)
Residents speaking Spanish at home - Native, born elsewhere (%)
Residents speaking Spanish at home - Foreign born (%)
Residents speaking other language at home (%)
Residents speaking other language at home - Born in the United States (%)
Residents speaking other language at home - Native, born elsewhere (%)
Residents speaking other language at home - Foreign born (%)
Marital status - Never married (%)
Marital status - Now married (%)
Marital status - Separated (%)
Marital status - Widowed (%)
Marital status - Divorced (%)
Ancestries Reported - Arab (%)
Ancestries Reported - Czech (%)
Ancestries Reported - Danish (%)
Ancestries Reported - Dutch (%)
Ancestries Reported - English (%)
Ancestries Reported - French (%)
Ancestries Reported - French Canadian (%)
Ancestries Reported - German (%)
Ancestries Reported - Greek (%)
Ancestries Reported - Hungarian (%)
Ancestries Reported - Irish (%)
Ancestries Reported - Italian (%)
Ancestries Reported - Lithuanian (%)
Ancestries Reported - Norwegian (%)
Ancestries Reported - Polish (%)
Ancestries Reported - Portuguese (%)
Ancestries Reported - Russian (%)
Ancestries Reported - Scotch-Irish (%)
Ancestries Reported - Scottish (%)
Ancestries Reported - Slovak (%)
Ancestries Reported - Subsaharan African (%)
Ancestries Reported - Swedish (%)
Ancestries Reported - Swiss (%)
Ancestries Reported - Ukrainian (%)
Ancestries Reported - United States (%)
Ancestries Reported - Welsh (%)
Ancestries Reported - West Indian (%)
Ancestries Reported - Other (%)
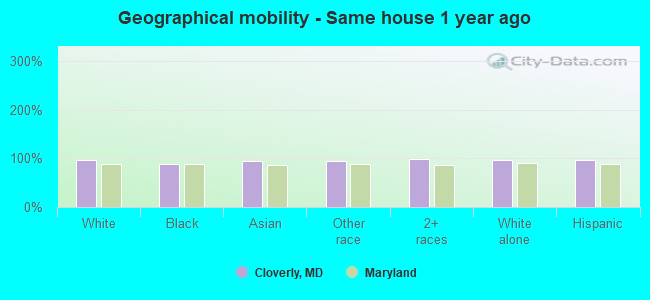
Geographical mobility - Same house 1 year ago (%)
Geographical mobility - Same house 1 year ago (%) - White
Geographical mobility - Same house 1 year ago (%) - Black or African American
Geographical mobility - Same house 1 year ago (%) - Asian
Geographical mobility - Same house 1 year ago (%) - Hispanic or Latino
Geographical mobility - Same house 1 year ago (%) - American Indian and Alaska Native
Geographical mobility - Same house 1 year ago (%) - Multirace
Geographical mobility - Same house 1 year ago (%) - Other Race
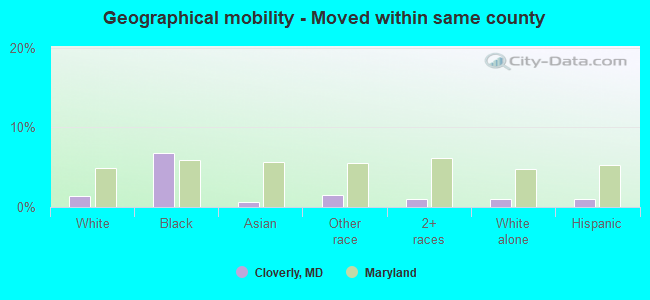
Geographical mobility - Moved within same county (%)
Geographical mobility - Moved within same county (%) - White
Geographical mobility - Moved within same county (%) - Black or African American
Geographical mobility - Moved within same county (%) - Asian
Geographical mobility - Moved within same county (%) - Hispanic or Latino
Geographical mobility - Moved within same county (%) - American Indian and Alaska Native
Geographical mobility - Moved within same county (%) - Multirace
Geographical mobility - Moved within same county (%) - Other Race
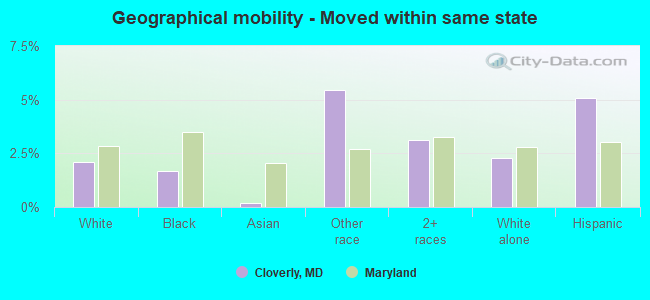
Geographical mobility - Moved from different county within same state (%)
Geographical mobility - Moved from different county within same state (%) - White
Geographical mobility - Moved from different county within same state (%) - Black or African American
Geographical mobility - Moved from different county within same state (%) - Asian
Geographical mobility - Moved from different county within same state (%) - Hispanic or Latino
Geographical mobility - Moved from different county within same state (%) - American Indian and Alaska Native
Geographical mobility - Moved from different county within same state (%) - Multirace
Geographical mobility - Moved from different county within same state (%) - Other Race
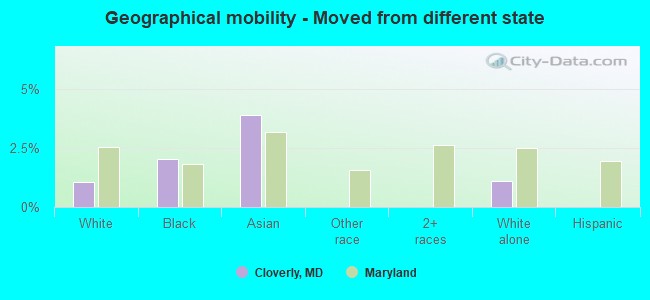
Geographical mobility - Moved from different state (%)
Geographical mobility - Moved from different state (%) - White
Geographical mobility - Moved from different state (%) - Black or African American
Geographical mobility - Moved from different state (%) - Asian
Geographical mobility - Moved from different state (%) - Hispanic or Latino
Geographical mobility - Moved from different state (%) - American Indian and Alaska Native
Geographical mobility - Moved from different state (%) - Multirace
Geographical mobility - Moved from different state (%) - Other Race
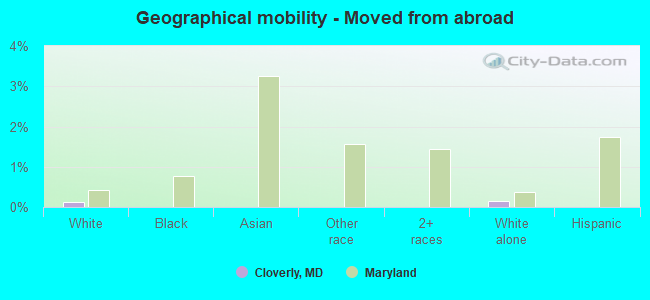
Geographical mobility - Moved from abroad (%)
Geographical mobility - Moved from abroad (%) - White
Geographical mobility - Moved from abroad (%) - Black or African American
Geographical mobility - Moved from abroad (%) - Asian
Geographical mobility - Moved from abroad (%) - Hispanic or Latino
Geographical mobility - Moved from abroad (%) - American Indian and Alaska Native
Geographical mobility - Moved from abroad (%) - Multirace
Geographical mobility - Moved from abroad (%) - Other Race
Place of birth for the foreign-born population - Ireland (%)
Place of birth for the foreign-born population - Denmark (%)
Place of birth for the foreign-born population - Norway (%)
Place of birth for the foreign-born population - Sweden (%)
Place of birth for the foreign-born population - United Kingdom (%)
Place of birth for the foreign-born population - England (%)
Place of birth for the foreign-born population - Scotland (%)
Place of birth for the foreign-born population - Other Northern Europe (%)
Place of birth for the foreign-born population - Austria (%)
Place of birth for the foreign-born population - Belgium (%)
Place of birth for the foreign-born population - France (%)
Place of birth for the foreign-born population - Germany (%)
Place of birth for the foreign-born population - Netherlands (%)
Place of birth for the foreign-born population - Switzerland (%)
Place of birth for the foreign-born population - Other Western Europe (%)
Place of birth for the foreign-born population - Greece (%)
Place of birth for the foreign-born population - Italy (%)
Place of birth for the foreign-born population - Portugal (%)
Place of birth for the foreign-born population - Spain (%)
Place of birth for the foreign-born population - Other Southern Europe (%)
Place of birth for the foreign-born population - Albania (%)
Place of birth for the foreign-born population - Belarus (%)
Place of birth for the foreign-born population - Bosnia and Herzegovina (%)
Place of birth for the foreign-born population - Bulgaria (%)
Place of birth for the foreign-born population - Croatia (%)
Place of birth for the foreign-born population - Czechoslovakia (%)
Place of birth for the foreign-born population - Hungary (%)
Place of birth for the foreign-born population - Latvia (%)
Place of birth for the foreign-born population - Lithuania (%)
Place of birth for the foreign-born population - North Macedonia (Macedonia) (%)
Place of birth for the foreign-born population - Moldova (%)
Place of birth for the foreign-born population - Poland (%)
Place of birth for the foreign-born population - Romania (%)
Place of birth for the foreign-born population - Russia (%)
Place of birth for the foreign-born population - Serbia (%)
Place of birth for the foreign-born population - Ukraine (%)
Place of birth for the foreign-born population - Other Eastern Europe (%)
Place of birth for the foreign-born population - China (%)
Place of birth for the foreign-born population - Hong Kong (%)
Place of birth for the foreign-born population - Taiwan (%)
Place of birth for the foreign-born population - Japan (%)
Place of birth for the foreign-born population - Korea (%)
Place of birth for the foreign-born population - Other Eastern Asia (%)
Place of birth for the foreign-born population - Afghanistan (%)
Place of birth for the foreign-born population - Bangladesh (%)
Place of birth for the foreign-born population - India (%)
Place of birth for the foreign-born population - Iran (%)
Place of birth for the foreign-born population - Kazakhstan (%)
Place of birth for the foreign-born population - Nepal (%)
Place of birth for the foreign-born population - Pakistan (%)
Place of birth for the foreign-born population - Sri Lanka (%)
Place of birth for the foreign-born population - Uzbekistan (%)
Place of birth for the foreign-born population - Other South Central Asia (%)
Place of birth for the foreign-born population - Burma (%)
Place of birth for the foreign-born population - Cambodia (%)
Place of birth for the foreign-born population - Indonesia (%)
Place of birth for the foreign-born population - Laos (%)
Place of birth for the foreign-born population - Malaysia (%)
Place of birth for the foreign-born population - Philippines (%)
Place of birth for the foreign-born population - Singapore (%)
Place of birth for the foreign-born population - Thailand (%)
Place of birth for the foreign-born population - Vietnam (%)
Place of birth for the foreign-born population - Other South Eastern Asia (%)
Place of birth for the foreign-born population - Armenia (%)
Place of birth for the foreign-born population - Iraq (%)
Place of birth for the foreign-born population - Israel (%)
Place of birth for the foreign-born population - Jordan (%)
Place of birth for the foreign-born population - Kuwait (%)
Place of birth for the foreign-born population - Lebanon (%)
Place of birth for the foreign-born population - Saudi Arabia (%)
Place of birth for the foreign-born population - Syria (%)
Place of birth for the foreign-born population - Turkey (%)
Place of birth for the foreign-born population - Yemen (%)
Place of birth for the foreign-born population - Other Western Asia (%)
Place of birth for the foreign-born population - Eritrea (%)
Place of birth for the foreign-born population - Ethiopia (%)
Place of birth for the foreign-born population - Kenya (%)
Place of birth for the foreign-born population - Somalia (%)
Place of birth for the foreign-born population - Uganda (%)
Place of birth for the foreign-born population - Zimbabwe (%)
Place of birth for the foreign-born population - Other Eastern Africa (%)
Place of birth for the foreign-born population - Cameroon (%)
Place of birth for the foreign-born population - Congo (%)
Place of birth for the foreign-born population - Democratic Republic of Congo (Zaire) (%)
Place of birth for the foreign-born population - Other Middle Africa (%)
Place of birth for the foreign-born population - Egypt (%)
Place of birth for the foreign-born population - Morocco (%)
Place of birth for the foreign-born population - Sudan (%)
Place of birth for the foreign-born population - Other Northern Africa (%)
Place of birth for the foreign-born population - South Africa (%)
Place of birth for the foreign-born population - Other Southern Africa (%)
Place of birth for the foreign-born population - Cabo Verde (%)
Place of birth for the foreign-born population - Ghana (%)
Place of birth for the foreign-born population - Liberia (%)
Place of birth for the foreign-born population - Nigeria (%)
Place of birth for the foreign-born population - Senegal (%)
Place of birth for the foreign-born population - Sierra Leone (%)
Place of birth for the foreign-born population - Other Western Africa (%)
Place of birth for the foreign-born population - Australia (%)
Place of birth for the foreign-born population - New Zealand (%)
Place of birth for the foreign-born population - Fiji (%)
Place of birth for the foreign-born population - Micronesia (%)
Place of birth for the foreign-born population - Bahamas (%)
Place of birth for the foreign-born population - Barbados (%)
Place of birth for the foreign-born population - Cuba (%)
Place of birth for the foreign-born population - Dominica (%)
Place of birth for the foreign-born population - Dominican Republic (%)
Place of birth for the foreign-born population - Grenada (%)
Place of birth for the foreign-born population - Haiti (%)
Place of birth for the foreign-born population - Jamaica (%)
Place of birth for the foreign-born population - St. Vincent and the Grenadines (%)
Place of birth for the foreign-born population - Trinidad and Tobago (%)
Place of birth for the foreign-born population - West Indies (%)
Place of birth for the foreign-born population - Other Caribbean (%)
Place of birth for the foreign-born population - Belize (%)
Place of birth for the foreign-born population - Costa Rica (%)
Place of birth for the foreign-born population - El Salvador (%)
Place of birth for the foreign-born population - Guatemala (%)
Place of birth for the foreign-born population - Honduras (%)
Place of birth for the foreign-born population - Mexico (%)
Place of birth for the foreign-born population - Nicaragua (%)
Place of birth for the foreign-born population - Panama (%)
Place of birth for the foreign-born population - Other Central America (%)
Place of birth for the foreign-born population - Argentina (%)
Place of birth for the foreign-born population - Bolivia (%)
Place of birth for the foreign-born population - Brazil (%)
Place of birth for the foreign-born population - Chile (%)
Place of birth for the foreign-born population - Colombia (%)
Place of birth for the foreign-born population - Ecuador (%)
Place of birth for the foreign-born population - Guyana (%)
Place of birth for the foreign-born population - Peru (%)
Place of birth for the foreign-born population - Uruguay (%)
Place of birth for the foreign-born population - Venezuela (%)
Place of birth for the foreign-born population - Other South America (%)
Place of birth for the foreign-born population - Canada (%)
Place of birth for the foreign-born population - Other Northern America (%)
Place of birth for the foreign-born population - Other (%)
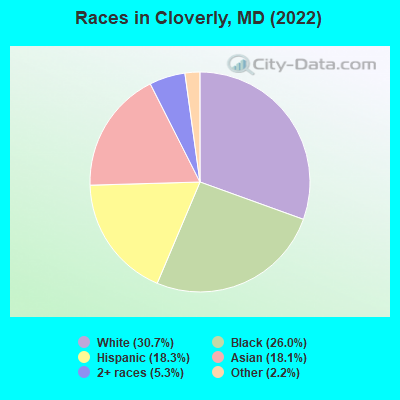
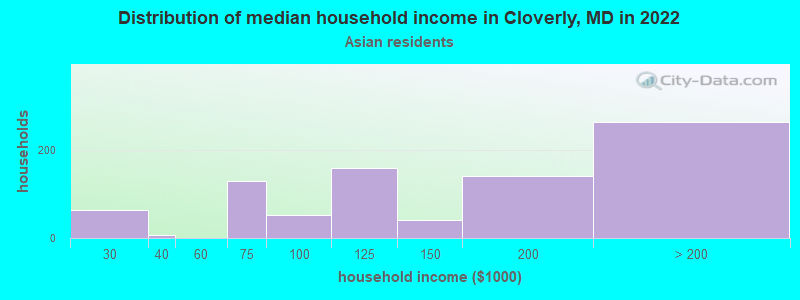
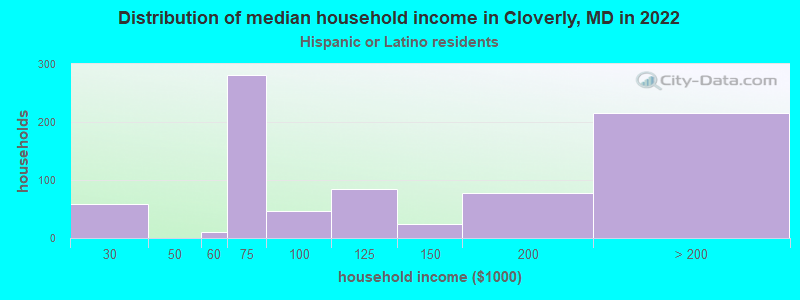
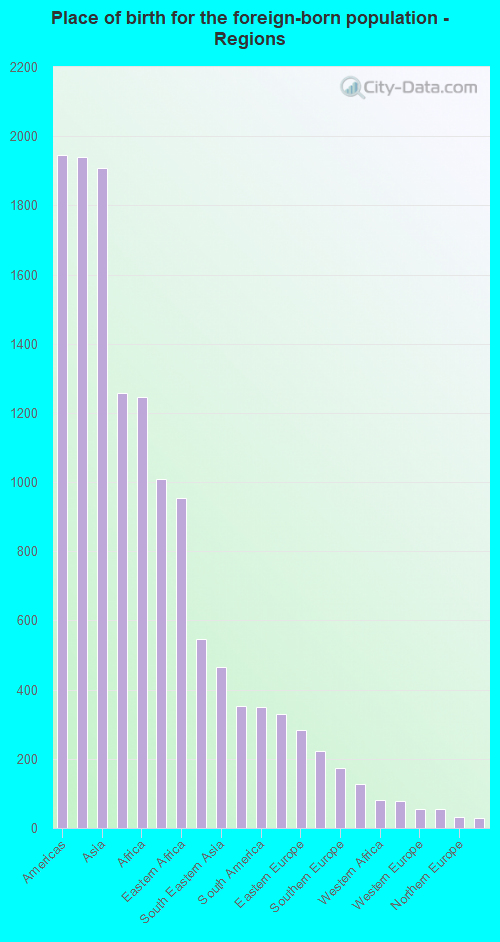
According to 2022 data, the most numerous races in Cloverly, MD are White alone (5,024 residents), Black alone (4,263 residents), and Hispanic (2,993 residents). 57.3% of Cloverly residents speak English at home. 34.5% of Cloverly, MD residents are foreign-born (11.4% born in Latin America, 11.2% born in Asia, 7.3% born in Africa), which is 53.6% greater than the foreign-born rate of 16.0% across the entire state of Maryland.
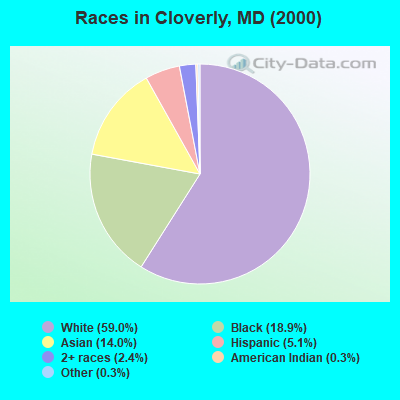
Race distribution in Cloverly
2000 2022
3,286,547 62.1% White alone 1,464,735 27.7% Black alone 227,916 4.3% Hispanic 209,738 4.0% Asian alone 82,946 1.6% Two or more races 13,312 0.3% American Indian alone 9,379 0.2% Other race alone 1,913 0.04% Native Hawaiian and Other
2,906,492 47.1% White alone 1,800,914 29.2% Black alone 705,842 11.4% Hispanic 401,818 6.5% Asian alone 291,317 4.7% Two or more races 46,930 0.8% Other race alone 8,930 0.1% American Indian alone 2,417 0.04% Native Hawaiian and Other
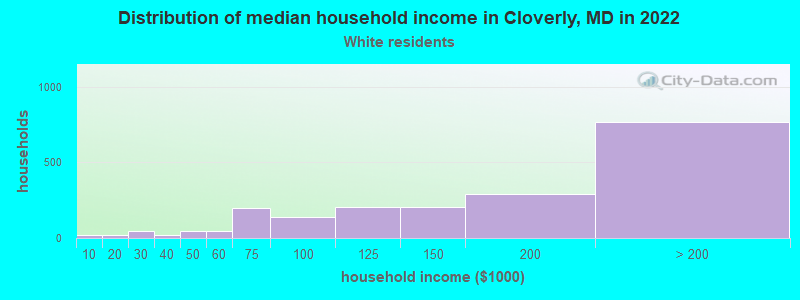
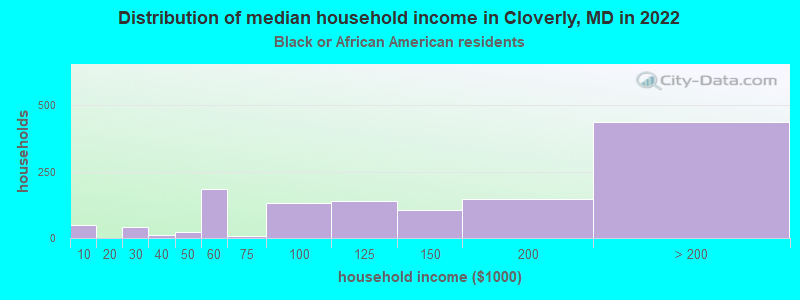
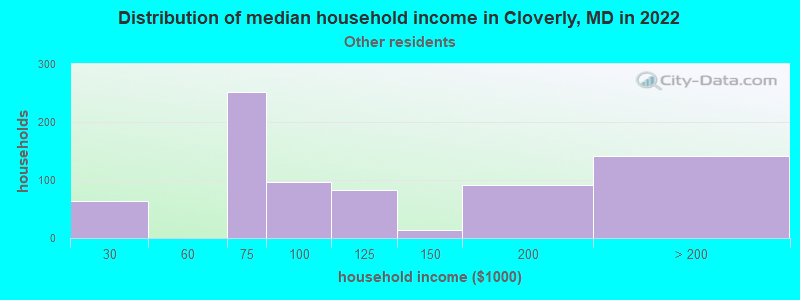
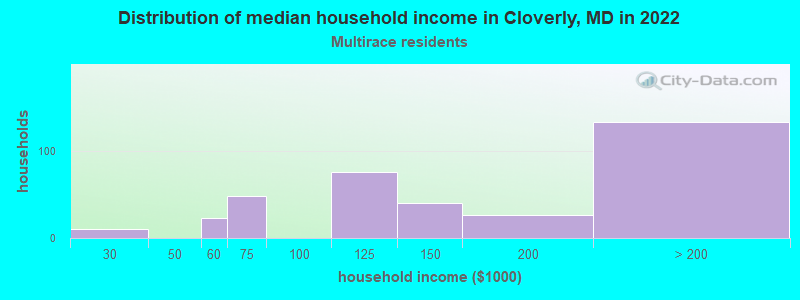
Income and house value in Cloverly Median household income in 2022 $159,124 White non-Hispanic householders$132,138 Black householders$142,902 Asian householders$102,253 Some other race householders$135,213 Two or more races householders$100,048 Hispanic or Latino race householdersMedian 2022 house value $668,449 White Non-Hispanic householders$575,392 Black or African American householders$486,226 American Indian or Alaska Native householders $575,692 Asian householders$698,071 Some other race householders$426,981 Two or more races householders$694,480 Hispanic or Latino householders
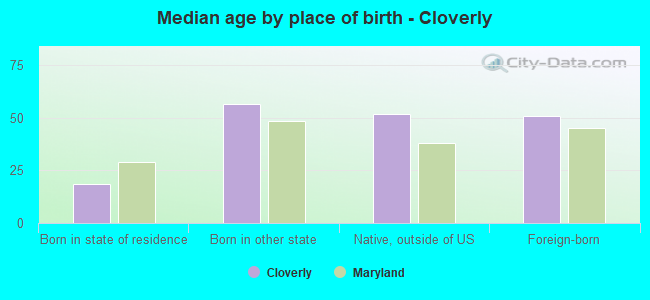
Median age by race in Cloverly
55.3 Median age for White residents49.8 61.6 41.3 Median age for Black or African American residents41.0 41.8 -610,526,315.2 Median age for American Indian / Alaska Native residents-555,555,555.0 -671,704,449.4 41.9 Median age for Asian residents46.6 39.0 -763,333,332.6 Median age for Native Hawaiian / Pacific Islander residents-720,061,021.4 -760,942,760.2 36.6 Median age for Other race residents40.1 29.1 28.3 Median age for Two or more races residents27.9 29.7 56.8 Median age for White alone residents53.1 61.4 36.0 Median age for Hispanic or Latino residents34.1 35.8
Owner/renter occupied households by race in Cloverly
House owners and renters - White residents 1,941 95.7% Owner occupied88 4.3% Renter occupiedHouse owners and renters - Black or African American residents 1,129 85.4% Owner occupied192 14.6% Renter occupiedHouse owners and renters - Asian residents 660 79.0% Owner occupied175 21.0% Renter occupiedHouse owners and renters - Other race residents 585 83.0% Owner occupied120 17.0% Renter occupiedHouse owners and renters - Two or more races residents 338 96.4% Owner occupied12 3.6% Renter occupiedHouse owners and renters - White alone residents 1,949 96.4% Owner occupied72 3.6% Renter occupiedHouse owners and renters - Hispanic or Latino residents 643 83.8% Owner occupied125 16.2% Renter occupied
Language usage in Cloverly
English speakers - Total 57.3% of residents of Cloverly speak English at home.
15.8% of residents speak Spanish at home 1,747 71.4% Speak English very well700 28.6% Speak English less than very well26.6% of residents speak other language at home 2,886 70.0% Speak English very well1,238 30.0% Speak English less than very well
English speakers - Born in the United States 91.9% of residents of Cloverly speak English at home.
4.8% of residents speak Spanish at home 254 100.0% Speak English very well3.7% of residents speak other language at home 189 96.9% Speak English very well6 3.1% Speak English less than very well
English speakers - Native, born elsewhere 73.3% of residents of Cloverly speak English at home.
1.4% of residents speak Spanish at home 4 100.0% Speak English very well25.3% of residents speak other language at home 37 52.1% Speak English very well34 47.9% Speak English less than very well
English speakers - Foreign-born 16.4% of residents of Cloverly speak English at home.
24.6% of residents speak Spanish at home 684 49.8% Speak English very well689 50.2% Speak English less than very well58.4% of residents speak other language at home 2,115 64.7% Speak English very well1,153 35.3% Speak English less than very well
White (Caucasian) - Speak only English Native:
93.1% (4,022)Foreign-born:
15.5% (94)
White (Caucasian) - Speak another language Native:
7.0% (301)Foreign-born:
83.1% (506)
Black or African American - Speak only English Native:
92.1% (2,340)Foreign-born:
22.7% (327)
Black or African American - Speak another language Native:
7.4% (187)Foreign-born:
77.0% (1,109)
Asian - Speak only English Native:
57.9% (674)Foreign-born:
19.5% (314)
Asian - Speak another language Native:
39.9% (464)Foreign-born:
80.8% (1,301)
Other race - Speak only English Native:
42.5% (413)Foreign-born:
11.2% (153)
Other race - Speak another language Native:
62.3% (605)Foreign-born:
87.6% (1,192)
Two or more races - Speak only English Native:
57.3% (587)Foreign-born:
1.2% (9)
Two or more races - Speak another language Native:
44.4% (455)Foreign-born:
97.8% (717)
White alone - Speak only English Native:
95.5% (3,988)Foreign-born:
10.0% (62)
White alone - Speak another language Native:
4.6% (191)Foreign-born:
91.3% (570)
Hispanic or Latino - Speak only English Native:
26.0% (351)Foreign-born:
8.2% (126)
Hispanic or Latino - Speak another language Native:
73.5% (990)Foreign-born:
91.4% (1,402)
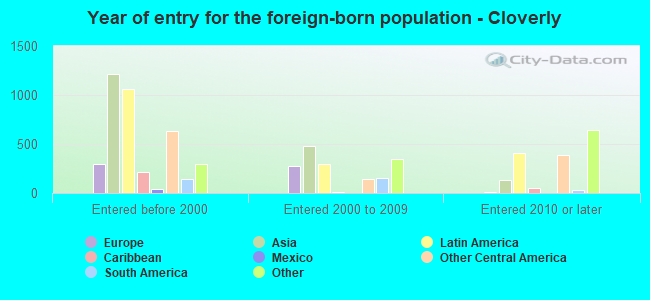
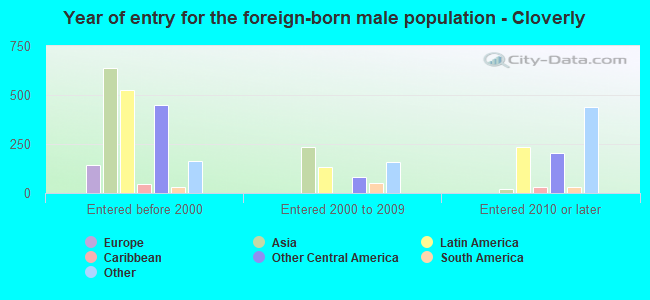
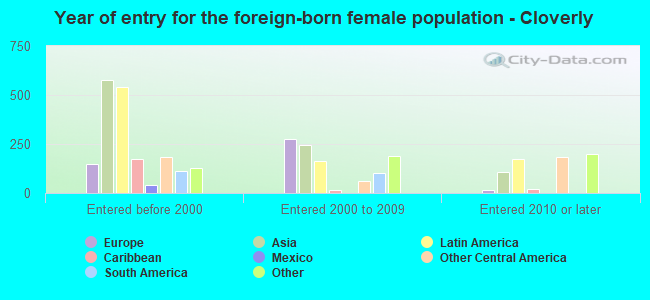
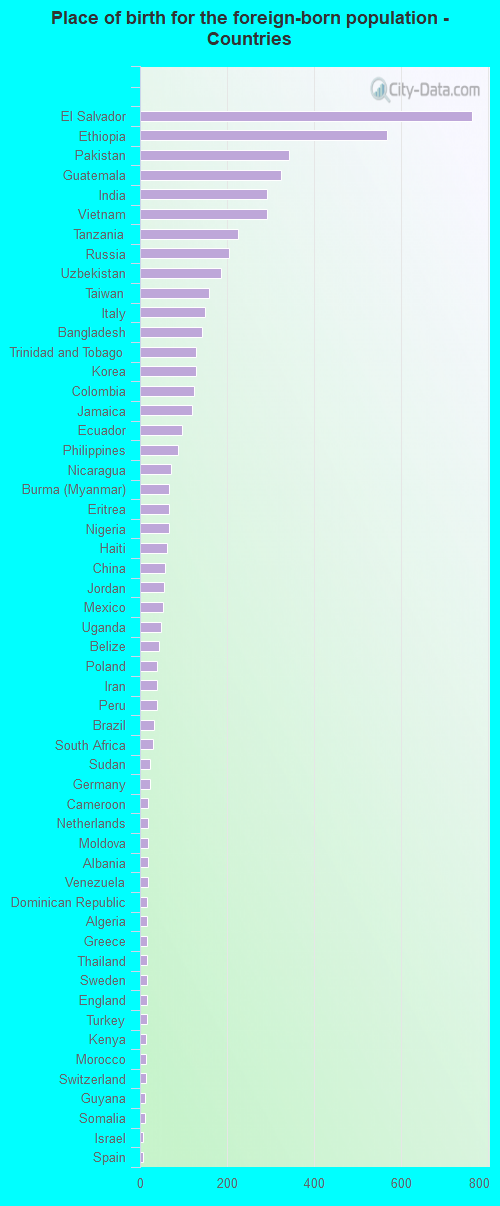
Foreign-born residents in Cloverly 5,649 residents are foreign born (11.4% Latin America , 11.2% Asia , 7.3% Africa ).
This city:
34.5%Maryland:
15.7%
Marital status for residents in Cloverly Marital status - White (Caucasian) population 15 years and over
Males 28.8% Never married63.0% Now married0.6% Separated2.1% Widowed5.6% DivorcedFemales 14.2% Never married64.3% Now married0.0% Separated12.3% Widowed9.1% DivorcedWomen who did not give birth in the past 12 months Now married:
62.6% (466)Unmarried:
37.4% (278)
Marital status - Black or African American population 15 years and over
Males 34.3% Never married55.0% Now married0.0% Separated0.0% Widowed10.7% DivorcedFemales 32.8% Never married42.5% Now married4.9% Separated0.6% Widowed19.2% DivorcedWomen who did not give birth in the past 12 months Now married:
32.9% (324)Unmarried:
67.1% (661)
Marital status - Asian population 15 years and over
Males 23.5% Never married76.1% Now married0.0% Separated0.0% Widowed0.4% DivorcedFemales 23.7% Never married75.5% Now married0.8% Separated0.1% Widowed0.0% DivorcedWomen who gave birth in the past 12 months Now married:
100.0% (23)Unmarried:
0.0% (0)
Women who did not give birth in the past 12 months Now married:
61.9% (392)Unmarried:
38.1% (241)
Marital status - Other race population 15 years and over
Males 34.9% Never married58.7% Now married6.4% Separated0.0% Widowed0.0% DivorcedFemales 18.0% Never married71.5% Now married0.0% Separated0.0% Widowed10.5% DivorcedWomen who gave birth in the past 12 months Now married:
100.0% (31)Unmarried:
0.0% (0)
Women who did not give birth in the past 12 months Now married:
62.5% (260)Unmarried:
37.5% (156)
Marital status - Two or more races population 15 years and over
Males 43.0% Never married51.7% Now married5.2% Separated0.0% Widowed0.0% DivorcedFemales 48.8% Never married48.9% Now married0.0% Separated2.3% Widowed0.0% DivorcedWomen who did not give birth in the past 12 months Now married:
34.3% (196)Unmarried:
65.7% (375)
Marital status - White alone, not Hispanic / Latino population 15 years and over
Males 23.9% Never married66.9% Now married0.6% Separated2.3% Widowed6.1% DivorcedFemales 12.3% Never married68.2% Now married0.0% Separated10.8% Widowed8.8% DivorcedWomen who did not give birth in the past 12 months Now married:
71.3% (491)Unmarried:
28.7% (197)
Marital status - Hispanic or Latino population 15 years and over
Males 40.9% Never married54.3% Now married4.8% Separated0.0% Widowed0.0% DivorcedFemales 20.7% Never married64.6% Now married0.0% Separated5.9% Widowed8.8% DivorcedWomen who gave birth in the past 12 months Now married:
100.0% (25)Unmarried:
0.0% (0)
Women who did not give birth in the past 12 months Now married:
56.6% (347)Unmarried:
43.4% (266)
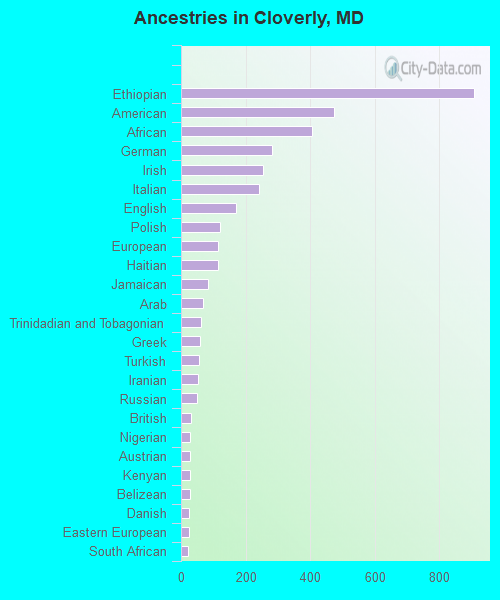
Ancestries in Cloverly
908 8.7% Ethiopian475 4.6% American405 3.9% African281 2.7% German254 2.4% Irish240 2.3% Italian171 1.6% English121 1.2% Polish116 1.1% European116 1.1% Haitian84 0.8% Jamaican69 0.7% Arab62 0.6% Trinidadian and Tobagonian59 0.6% Greek57 0.5% Turkish52 0.5% Iranian48 0.5% Russian32 0.3% British29 0.3% Nigerian29 0.3% Austrian28 0.3% Kenyan27 0.3% Belizean26 0.3% Danish25 0.2% Eastern European23 0.2% South African21 0.2% Swiss20 0.2% Hungarian18 0.2% Scotch-Irish16 0.2% Ukrainian16 0.2% Somali15 0.1% Portuguese15 0.1% West Indian13 0.1% Lebanese13 0.1% Norwegian12 0.1% Scottish12 0.1% Brazilian12 0.1% Albanian9 0.09% Welsh8 0.08% Belgian7 0.07% Scandinavian7 0.07% Czech6 0.06% Croatian6 0.06% Dutch5 0.05% Alsatian5 0.05% Moroccan4 0.04% Guyanese3 0.03% Egyptian2 0.02% Afghan
Geographical mobility in Cloverly Same house 1 year ago 4,899 95.9% White (Caucasian)3,703 87.3% Black or African American2,749 93.9% Asian2,231 93.5% Other race1,825 98.1% Two or more races4,817 95.9% White alone, not Hispanic / Latino2,823 95.8% Hispanic or LatinoMoved within same county 70 1.4% White / Caucasian287 6.8% Black or African American19 0.6% Asian35 1.5% Other race19 1.0% Two or more races48 1.0% White alone, not Hispanic / Latino28 1.0% Hispanic or LatinoMoved within same state 107 2.1% White / Caucasian71 1.7% Black or African American5 0.2% Asian130 5.5% Other race58 3.1% Two or more races116 2.3% White alone, not Hispanic / Latino149 5.1% Hispanic or LatinoMoved from different state 53 1.0% White / Caucasian86 2.0% Black or African American113 3.9% Asian56 1.1% White alone, not Hispanic / LatinoMoved from abroad 7 0.1% White8 0.2% White alone, not Hispanic / Latino
Children Nativity (place of birth) in Cloverly
Children under 6 years - Living with two parents Both parents native 515 100.0% NativeBoth parents foreign-born 181 100.0% NativeOne native, one foreign-born parent 200 100.0% NativeChildren under 6 years - Living with one parent Native parent 94 100.0% NativeForeign-born parent 23 100.0% NativeChildren 6 to 17 years - Living with two parents Both parents native 454 99.9% Native0 0.1% Foreign-bornBoth parents foreign-born 955 81.8% Native213 18.2% Foreign-bornOne native, one foreign-born parent 353 100.0% NativeChildren 6 to 17 years - Living with one parent Native parent 346 100.0% NativeForeign-born parent 19 49.5% Native19 50.5% Foreign-born
Grandparents responsible for own grandchildren in Cloverly
Grandparents (30 to 59 years) White / Caucasian 3 100.0% Responsible for grandchildrenOther race 34 100.0% Not responsible for grandchildrenWhite alone, not Hispanic / Latino 3 100.0% Responsible for grandchildrenHispanic or Latino 30 100.0% Not responsible for grandchildrenGrandparents (60 years and over) White / Caucasian 88 78.7% Responsible for grandchildren24 21.3% Not responsible for grandchildrenOther race 15 100.0% Not responsible for grandchildrenWhite alone, not Hispanic / Latino 71 70.7% Responsible for grandchildren30 29.3% Not responsible for grandchildrenHispanic or Latino 12 100.0% Not responsible for grandchildren