Races in Coatesville, Pennsylvania (PA) Detailed Stats
Data:
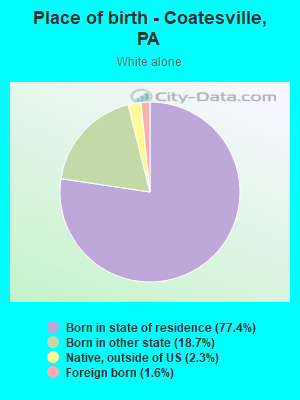
Races - White alone (%)
Races - White alone (% change since 2000)
Races - Black alone (%)
Races - Black alone (% change since 2000)
Races - American Indian alone (%)
Races - American Indian alone (% change since 2000)
Races - Asian alone (%)
Races - Asian alone (% change since 2000)
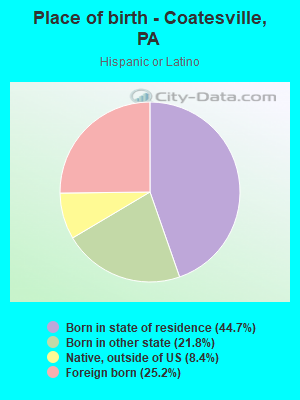
Races - Hispanic (%)
Races - Hispanic (% change since 2000)
Races - Native Hawaiian and Other Pacific Islander alone (%)
Races - Native Hawaiian and Other Pacific Islander alone (% change since 2000)
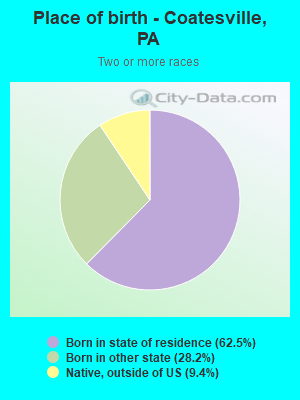
Races - Two or more races(%)
Races - Two or more races(% change since 2000)
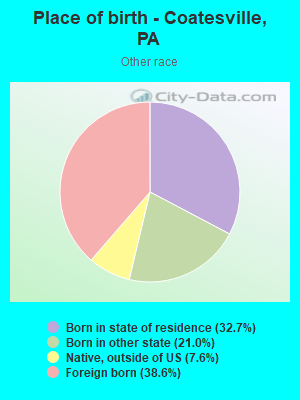
Races - Other race alone (%)
Races - Other race alone (% change since 2000)
Racial diversity
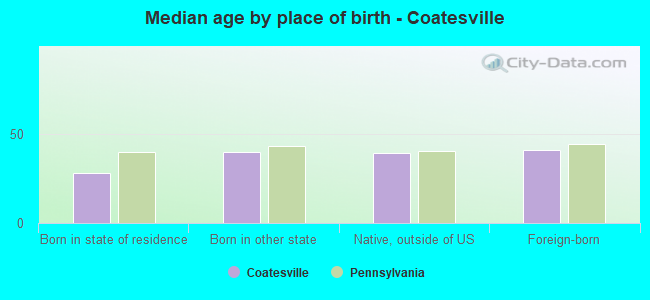
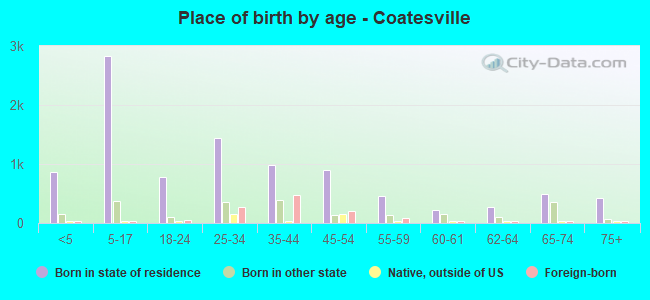
Place of birth - Born in state of residence (%)
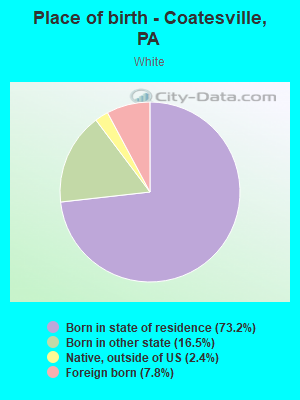
Place of birth - Born in state of residence (%) - White
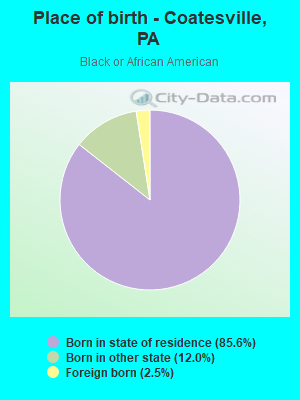
Place of birth - Born in state of residence (%) - Black or African American
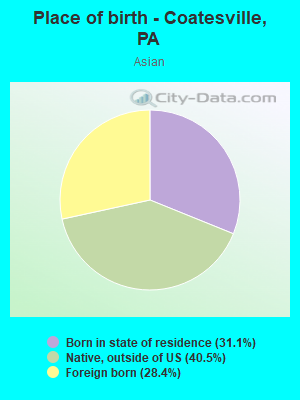
Place of birth - Born in state of residence (%) - Asian
Place of birth - Born in state of residence (%) - Hispanic or Latino
Place of birth - Born in state of residence (%) - American Indian and Alaska Native
Place of birth - Born in state of residence (%) - Multirace
Place of birth - Born in state of residence (%) - Other Race
Place of birth - Born in other state (%)
Place of birth - Born in other state (%) - White
Place of birth - Born in other state (%) - Black or African American
Place of birth - Born in other state (%) - Asian
Place of birth - Born in other state (%) - Hispanic or Latino
Place of birth - Born in other state (%) - American Indian and Alaska Native
Place of birth - Born in other state (%) - Multirace
Place of birth - Born in other state (%) - Other Race
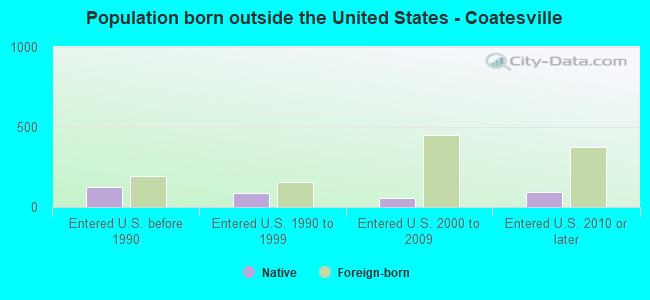
Place of birth - Native, outside of US (%)
Place of birth - Native, outside of US (%) - White
Place of birth - Native, outside of US (%) - Black or African American
Place of birth - Native, outside of US (%) - Asian
Place of birth - Native, outside of US (%) - Hispanic or Latino
Place of birth - Native, outside of US (%) - American Indian and Alaska Native
Place of birth - Native, outside of US (%) - Multirace
Place of birth - Native, outside of US (%) - Other Race
Place of birth - Foreign born (%)
Place of birth - Foreign born (%) - White
Place of birth - Foreign born (%) - Black or African American
Place of birth - Foreign born (%) - Asian
Place of birth - Foreign born (%) - Hispanic or Latino
Place of birth - Foreign born (%) - American Indian and Alaska Native
Place of birth - Foreign born (%) - Multirace
Place of birth - Foreign born (%) - Other Race
Residents speaking English at home (%)
Residents speaking English at home - Born in the United States (%)
Residents speaking English at home - Native, born elsewhere (%)
Residents speaking English at home - Foreign born (%)
Residents speaking Spanish at home (%)
Residents speaking Spanish at home - Born in the United States (%)
Residents speaking Spanish at home - Native, born elsewhere (%)
Residents speaking Spanish at home - Foreign born (%)
Residents speaking other language at home (%)
Residents speaking other language at home - Born in the United States (%)
Residents speaking other language at home - Native, born elsewhere (%)
Residents speaking other language at home - Foreign born (%)
Marital status - Never married (%)
Marital status - Now married (%)
Marital status - Separated (%)
Marital status - Widowed (%)
Marital status - Divorced (%)
Ancestries Reported - Arab (%)
Ancestries Reported - Czech (%)
Ancestries Reported - Danish (%)
Ancestries Reported - Dutch (%)
Ancestries Reported - English (%)
Ancestries Reported - French (%)
Ancestries Reported - French Canadian (%)
Ancestries Reported - German (%)
Ancestries Reported - Greek (%)
Ancestries Reported - Hungarian (%)
Ancestries Reported - Irish (%)
Ancestries Reported - Italian (%)
Ancestries Reported - Lithuanian (%)
Ancestries Reported - Norwegian (%)
Ancestries Reported - Polish (%)
Ancestries Reported - Portuguese (%)
Ancestries Reported - Russian (%)
Ancestries Reported - Scotch-Irish (%)
Ancestries Reported - Scottish (%)
Ancestries Reported - Slovak (%)
Ancestries Reported - Subsaharan African (%)
Ancestries Reported - Swedish (%)
Ancestries Reported - Swiss (%)
Ancestries Reported - Ukrainian (%)
Ancestries Reported - United States (%)
Ancestries Reported - Welsh (%)
Ancestries Reported - West Indian (%)
Ancestries Reported - Other (%)
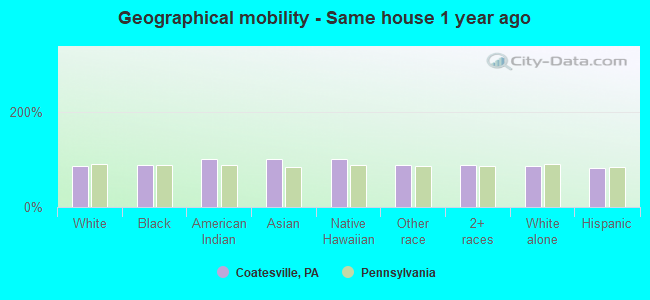
Geographical mobility - Same house 1 year ago (%)
Geographical mobility - Same house 1 year ago (%) - White
Geographical mobility - Same house 1 year ago (%) - Black or African American
Geographical mobility - Same house 1 year ago (%) - Asian
Geographical mobility - Same house 1 year ago (%) - Hispanic or Latino
Geographical mobility - Same house 1 year ago (%) - American Indian and Alaska Native
Geographical mobility - Same house 1 year ago (%) - Multirace
Geographical mobility - Same house 1 year ago (%) - Other Race
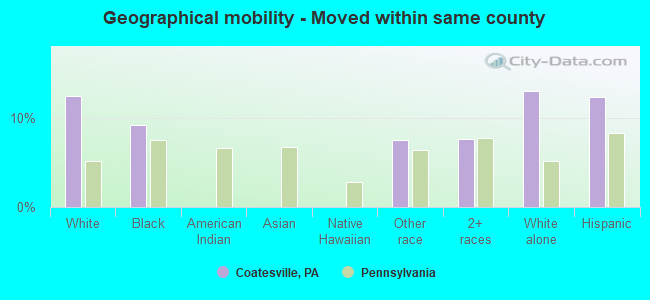
Geographical mobility - Moved within same county (%)
Geographical mobility - Moved within same county (%) - White
Geographical mobility - Moved within same county (%) - Black or African American
Geographical mobility - Moved within same county (%) - Asian
Geographical mobility - Moved within same county (%) - Hispanic or Latino
Geographical mobility - Moved within same county (%) - American Indian and Alaska Native
Geographical mobility - Moved within same county (%) - Multirace
Geographical mobility - Moved within same county (%) - Other Race
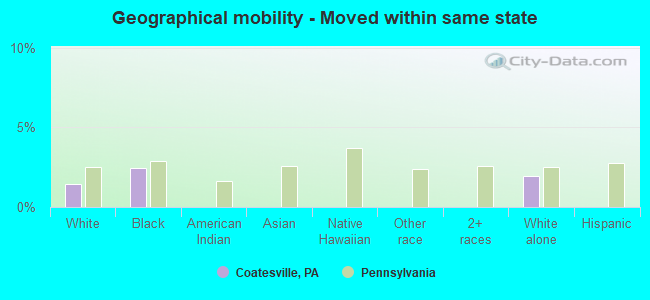
Geographical mobility - Moved from different county within same state (%)
Geographical mobility - Moved from different county within same state (%) - White
Geographical mobility - Moved from different county within same state (%) - Black or African American
Geographical mobility - Moved from different county within same state (%) - Asian
Geographical mobility - Moved from different county within same state (%) - Hispanic or Latino
Geographical mobility - Moved from different county within same state (%) - American Indian and Alaska Native
Geographical mobility - Moved from different county within same state (%) - Multirace
Geographical mobility - Moved from different county within same state (%) - Other Race
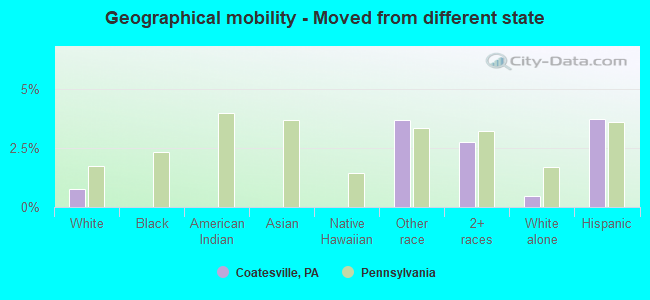
Geographical mobility - Moved from different state (%)
Geographical mobility - Moved from different state (%) - White
Geographical mobility - Moved from different state (%) - Black or African American
Geographical mobility - Moved from different state (%) - Asian
Geographical mobility - Moved from different state (%) - Hispanic or Latino
Geographical mobility - Moved from different state (%) - American Indian and Alaska Native
Geographical mobility - Moved from different state (%) - Multirace
Geographical mobility - Moved from different state (%) - Other Race
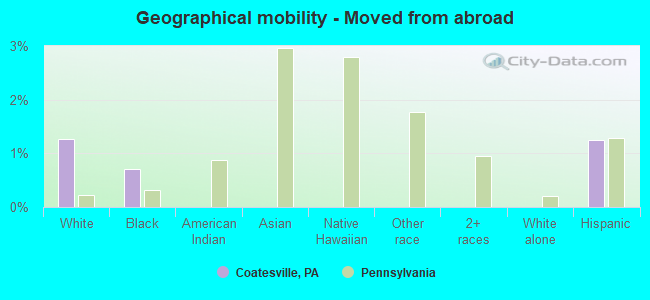
Geographical mobility - Moved from abroad (%)
Geographical mobility - Moved from abroad (%) - White
Geographical mobility - Moved from abroad (%) - Black or African American
Geographical mobility - Moved from abroad (%) - Asian
Geographical mobility - Moved from abroad (%) - Hispanic or Latino
Geographical mobility - Moved from abroad (%) - American Indian and Alaska Native
Geographical mobility - Moved from abroad (%) - Multirace
Geographical mobility - Moved from abroad (%) - Other Race
Place of birth for the foreign-born population - Ireland (%)
Place of birth for the foreign-born population - Denmark (%)
Place of birth for the foreign-born population - Norway (%)
Place of birth for the foreign-born population - Sweden (%)
Place of birth for the foreign-born population - United Kingdom (%)
Place of birth for the foreign-born population - England (%)
Place of birth for the foreign-born population - Scotland (%)
Place of birth for the foreign-born population - Other Northern Europe (%)
Place of birth for the foreign-born population - Austria (%)
Place of birth for the foreign-born population - Belgium (%)
Place of birth for the foreign-born population - France (%)
Place of birth for the foreign-born population - Germany (%)
Place of birth for the foreign-born population - Netherlands (%)
Place of birth for the foreign-born population - Switzerland (%)
Place of birth for the foreign-born population - Other Western Europe (%)
Place of birth for the foreign-born population - Greece (%)
Place of birth for the foreign-born population - Italy (%)
Place of birth for the foreign-born population - Portugal (%)
Place of birth for the foreign-born population - Spain (%)
Place of birth for the foreign-born population - Other Southern Europe (%)
Place of birth for the foreign-born population - Albania (%)
Place of birth for the foreign-born population - Belarus (%)
Place of birth for the foreign-born population - Bosnia and Herzegovina (%)
Place of birth for the foreign-born population - Bulgaria (%)
Place of birth for the foreign-born population - Croatia (%)
Place of birth for the foreign-born population - Czechoslovakia (%)
Place of birth for the foreign-born population - Hungary (%)
Place of birth for the foreign-born population - Latvia (%)
Place of birth for the foreign-born population - Lithuania (%)
Place of birth for the foreign-born population - North Macedonia (Macedonia) (%)
Place of birth for the foreign-born population - Moldova (%)
Place of birth for the foreign-born population - Poland (%)
Place of birth for the foreign-born population - Romania (%)
Place of birth for the foreign-born population - Russia (%)
Place of birth for the foreign-born population - Serbia (%)
Place of birth for the foreign-born population - Ukraine (%)
Place of birth for the foreign-born population - Other Eastern Europe (%)
Place of birth for the foreign-born population - China (%)
Place of birth for the foreign-born population - Hong Kong (%)
Place of birth for the foreign-born population - Taiwan (%)
Place of birth for the foreign-born population - Japan (%)
Place of birth for the foreign-born population - Korea (%)
Place of birth for the foreign-born population - Other Eastern Asia (%)
Place of birth for the foreign-born population - Afghanistan (%)
Place of birth for the foreign-born population - Bangladesh (%)
Place of birth for the foreign-born population - India (%)
Place of birth for the foreign-born population - Iran (%)
Place of birth for the foreign-born population - Kazakhstan (%)
Place of birth for the foreign-born population - Nepal (%)
Place of birth for the foreign-born population - Pakistan (%)
Place of birth for the foreign-born population - Sri Lanka (%)
Place of birth for the foreign-born population - Uzbekistan (%)
Place of birth for the foreign-born population - Other South Central Asia (%)
Place of birth for the foreign-born population - Burma (%)
Place of birth for the foreign-born population - Cambodia (%)
Place of birth for the foreign-born population - Indonesia (%)
Place of birth for the foreign-born population - Laos (%)
Place of birth for the foreign-born population - Malaysia (%)
Place of birth for the foreign-born population - Philippines (%)
Place of birth for the foreign-born population - Singapore (%)
Place of birth for the foreign-born population - Thailand (%)
Place of birth for the foreign-born population - Vietnam (%)
Place of birth for the foreign-born population - Other South Eastern Asia (%)
Place of birth for the foreign-born population - Armenia (%)
Place of birth for the foreign-born population - Iraq (%)
Place of birth for the foreign-born population - Israel (%)
Place of birth for the foreign-born population - Jordan (%)
Place of birth for the foreign-born population - Kuwait (%)
Place of birth for the foreign-born population - Lebanon (%)
Place of birth for the foreign-born population - Saudi Arabia (%)
Place of birth for the foreign-born population - Syria (%)
Place of birth for the foreign-born population - Turkey (%)
Place of birth for the foreign-born population - Yemen (%)
Place of birth for the foreign-born population - Other Western Asia (%)
Place of birth for the foreign-born population - Eritrea (%)
Place of birth for the foreign-born population - Ethiopia (%)
Place of birth for the foreign-born population - Kenya (%)
Place of birth for the foreign-born population - Somalia (%)
Place of birth for the foreign-born population - Uganda (%)
Place of birth for the foreign-born population - Zimbabwe (%)
Place of birth for the foreign-born population - Other Eastern Africa (%)
Place of birth for the foreign-born population - Cameroon (%)
Place of birth for the foreign-born population - Congo (%)
Place of birth for the foreign-born population - Democratic Republic of Congo (Zaire) (%)
Place of birth for the foreign-born population - Other Middle Africa (%)
Place of birth for the foreign-born population - Egypt (%)
Place of birth for the foreign-born population - Morocco (%)
Place of birth for the foreign-born population - Sudan (%)
Place of birth for the foreign-born population - Other Northern Africa (%)
Place of birth for the foreign-born population - South Africa (%)
Place of birth for the foreign-born population - Other Southern Africa (%)
Place of birth for the foreign-born population - Cabo Verde (%)
Place of birth for the foreign-born population - Ghana (%)
Place of birth for the foreign-born population - Liberia (%)
Place of birth for the foreign-born population - Nigeria (%)
Place of birth for the foreign-born population - Senegal (%)
Place of birth for the foreign-born population - Sierra Leone (%)
Place of birth for the foreign-born population - Other Western Africa (%)
Place of birth for the foreign-born population - Australia (%)
Place of birth for the foreign-born population - New Zealand (%)
Place of birth for the foreign-born population - Fiji (%)
Place of birth for the foreign-born population - Micronesia (%)
Place of birth for the foreign-born population - Bahamas (%)
Place of birth for the foreign-born population - Barbados (%)
Place of birth for the foreign-born population - Cuba (%)
Place of birth for the foreign-born population - Dominica (%)
Place of birth for the foreign-born population - Dominican Republic (%)
Place of birth for the foreign-born population - Grenada (%)
Place of birth for the foreign-born population - Haiti (%)
Place of birth for the foreign-born population - Jamaica (%)
Place of birth for the foreign-born population - St. Vincent and the Grenadines (%)
Place of birth for the foreign-born population - Trinidad and Tobago (%)
Place of birth for the foreign-born population - West Indies (%)
Place of birth for the foreign-born population - Other Caribbean (%)
Place of birth for the foreign-born population - Belize (%)
Place of birth for the foreign-born population - Costa Rica (%)
Place of birth for the foreign-born population - El Salvador (%)
Place of birth for the foreign-born population - Guatemala (%)
Place of birth for the foreign-born population - Honduras (%)
Place of birth for the foreign-born population - Mexico (%)
Place of birth for the foreign-born population - Nicaragua (%)
Place of birth for the foreign-born population - Panama (%)
Place of birth for the foreign-born population - Other Central America (%)
Place of birth for the foreign-born population - Argentina (%)
Place of birth for the foreign-born population - Bolivia (%)
Place of birth for the foreign-born population - Brazil (%)
Place of birth for the foreign-born population - Chile (%)
Place of birth for the foreign-born population - Colombia (%)
Place of birth for the foreign-born population - Ecuador (%)
Place of birth for the foreign-born population - Guyana (%)
Place of birth for the foreign-born population - Peru (%)
Place of birth for the foreign-born population - Uruguay (%)
Place of birth for the foreign-born population - Venezuela (%)
Place of birth for the foreign-born population - Other South America (%)
Place of birth for the foreign-born population - Canada (%)
Place of birth for the foreign-born population - Other Northern America (%)
Place of birth for the foreign-born population - Other (%)
Latest news about races in Coatesville, PA collected exclusively by city-data.com from local newspapers, TV, and radio stations
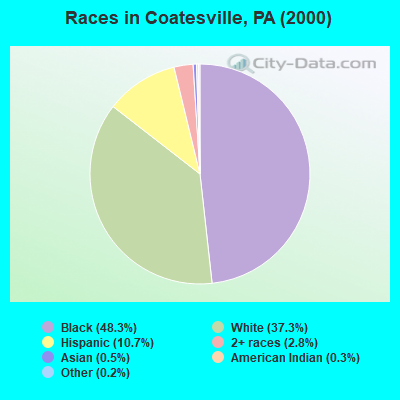
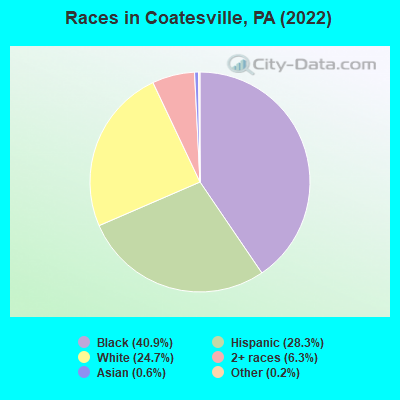
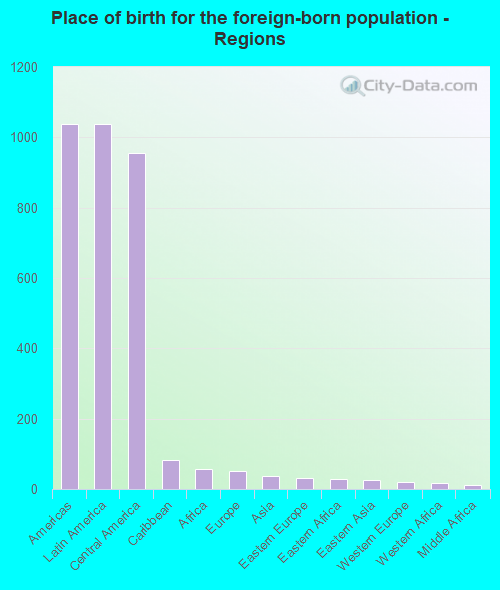
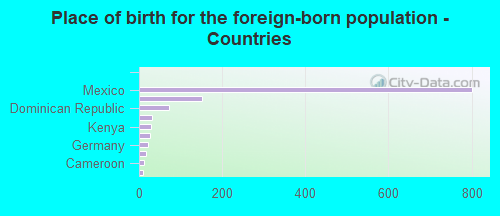
According to 2022 data, the most numerous races in Coatesville, PA are White alone (3,342 residents), Black alone (5,547 residents), and Hispanic (3,832 residents). 77.7% of Coatesville residents speak English at home. 8.7% of Coatesville, PA residents are foreign-born (7.5% born in Latin America), which is 20.0% greater than the foreign-born rate of 7.0% across the entire state of Pennsylvania.
Race distribution in Coatesville
2000 2022
10,322,455 84.1% White alone 1,202,437 9.8% Black alone 394,088 3.2% Hispanic 218,296 1.8% Asian alone 113,097 0.9% Two or more races 13,086 0.1% Other race alone 14,904 0.1% American Indian alone 2,691 0.02% Native Hawaiian and Other
9,487,228 73.1% White alone 1,311,581 10.1% Black alone 1,115,997 8.6% Hispanic 493,942 3.8% Two or more races 487,124 3.8% Asian alone 63,582 0.5% Other race alone 10,130 0.08% American Indian alone 2,424 0.02% Native Hawaiian and Other
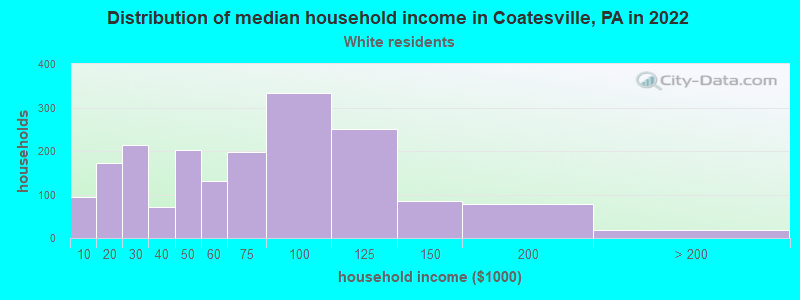
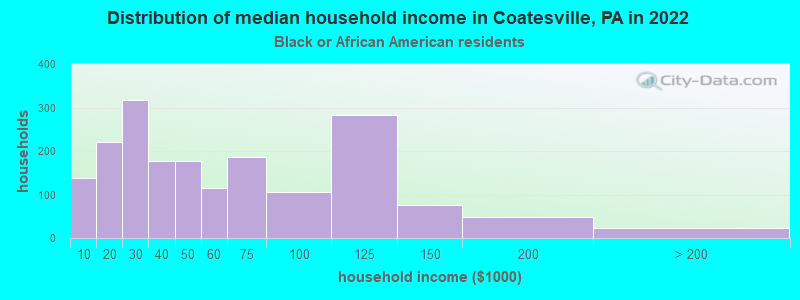
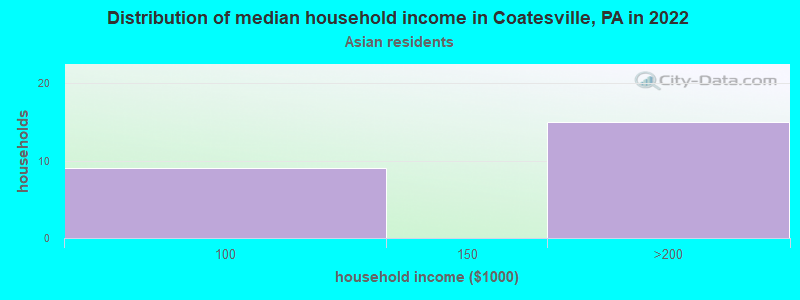
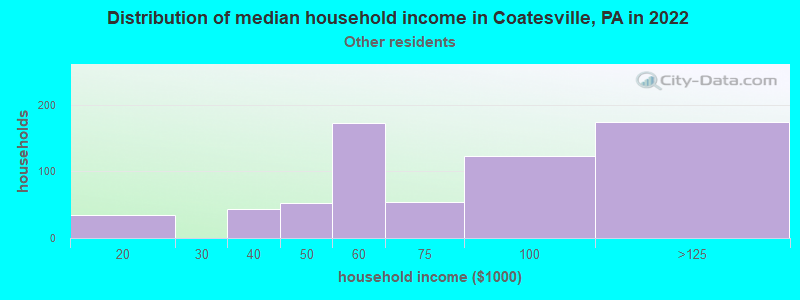
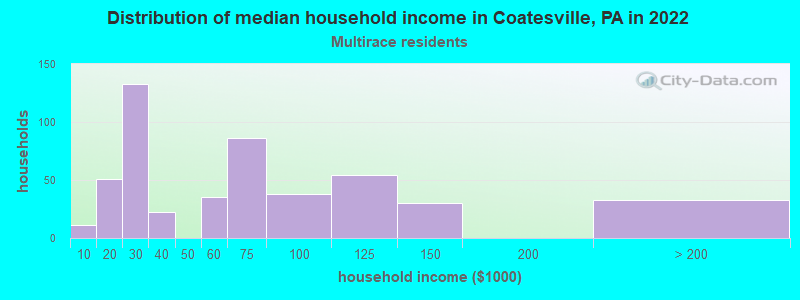
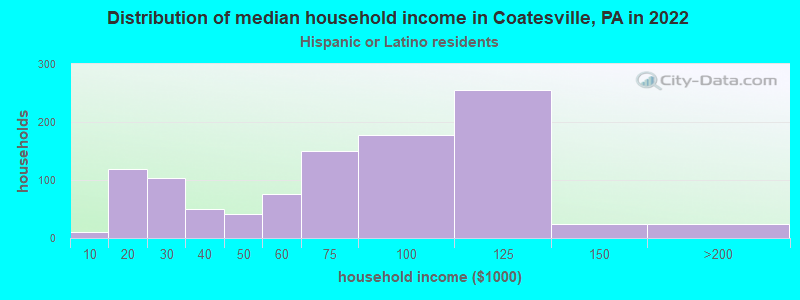
Income and house value in Coatesville Median household income in 2022 $53,877 White non-Hispanic householders$47,482 Black householders$179,709 Asian householders$73,406 Some other race householders$49,541 Two or more races householders$70,595 Hispanic or Latino race householdersMedian 2022 house value $159,504 White Non-Hispanic householders$147,143 Black or African American householders$168,078 American Indian or Alaska Native householders$140,364 Some other race householders$149,535 Two or more races householders$151,729 Hispanic or Latino householders
Median age by race in Coatesville
37.8 Median age for White residents37.4 37.8 30.0 Median age for Black or African American residents27.3 31.5 -591,549,295.2 Median age for American Indian / Alaska Native residents-596,491,227.5 -593,055,555.0 33.1 Median age for Asian residents32.3 -721,763,084.7 -596,045,197.1 Median age for Native Hawaiian / Pacific Islander residents-665,394,401.4 -747,474,746.7 35.2 Median age for Other race residents33.6 30.2 15.6 Median age for Two or more races residents16.1 10.5 40.7 Median age for White alone residents40.2 40.6 27.7 Median age for Hispanic or Latino residents30.0 22.6
Owner/renter occupied households by race in Coatesville
House owners and renters - White residents 906 49.9% Owner occupied910 50.1% Renter occupiedHouse owners and renters - Black or African American residents 590 34.1% Owner occupied1,138 65.9% Renter occupiedHouse owners and renters - American Indian / Alaska Native residents 11 100.0% Owner occupiedHouse owners and renters - Asian residents 10 46.0% Owner occupied12 54.0% Renter occupiedHouse owners and renters - Other race residents 262 52.3% Owner occupied239 47.7% Renter occupiedHouse owners and renters - Two or more races residents 169 32.2% Owner occupied356 67.8% Renter occupiedHouse owners and renters - White alone residents 848 50.8% Owner occupied820 49.2% Renter occupiedHouse owners and renters - Hispanic or Latino residents 366 37.3% Owner occupied616 62.7% Renter occupied
Language usage in Coatesville
English speakers - Total 77.7% of residents of Coatesville speak English at home.
19.7% of residents speak Spanish at home 1,327 53.7% Speak English very well1,144 46.3% Speak English less than very well1.1% of residents speak other language at home 133 100.0% Speak English very well
English speakers - Born in the United States 72.8% of residents of Coatesville speak English at home.
35.8% of residents speak Spanish at home 648 85.8% Speak English very well107 14.2% Speak English less than very well
English speakers - Native, born elsewhere 27.3% of residents of Coatesville speak English at home.
59.1% of residents speak Spanish at home 69 26.5% Speak English very well191 73.5% Speak English less than very well
English speakers - Foreign-born 10.9% of residents of Coatesville speak English at home.
75.7% of residents speak Spanish at home 259 28.5% Speak English very well649 71.5% Speak English less than very well5.8% of residents speak other language at home 70 100.0% Speak English very well
White (Caucasian) - Speak only English Native:
94.1% (3,460)Foreign-born:
8.6% (29)
White (Caucasian) - Speak another language Native:
6.2% (227)Foreign-born:
85.6% (285)
Black or African American - Speak only English Native:
92.9% (4,815)Foreign-born:
23.7% (32)
Black or African American - Speak another language Native:
8.4% (434)Foreign-born:
78.2% (104)
Asian - Speak only English Native:
74.4% (68)Foreign-born:
100.0% (37)
Asian - Speak another language Native:
22.2% (20)Foreign-born:
13.3% (5)
Other race - Speak only English Native:
15.9% (152)Foreign-born:
7.6% (55)
Other race - Speak another language Native:
79.3% (762)Foreign-born:
90.5% (648)
White alone - Speak only English Native:
97.4% (3,092)Foreign-born:
51.5% (28)
White alone - Speak another language Native:
2.3% (73)Foreign-born:
46.4% (25)
Hispanic or Latino - Speak only English Native:
42.5% (1,039)Foreign-born:
9.0% (90)
Hispanic or Latino - Speak another language Native:
54.4% (1,330)Foreign-born:
90.5% (896)
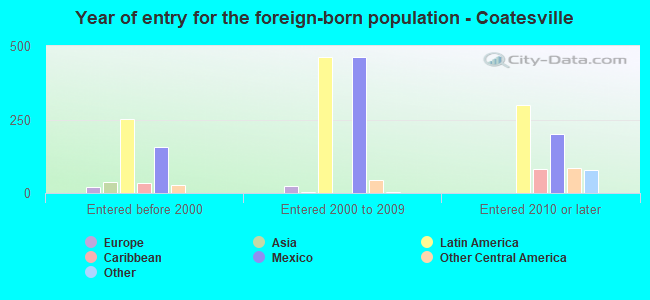
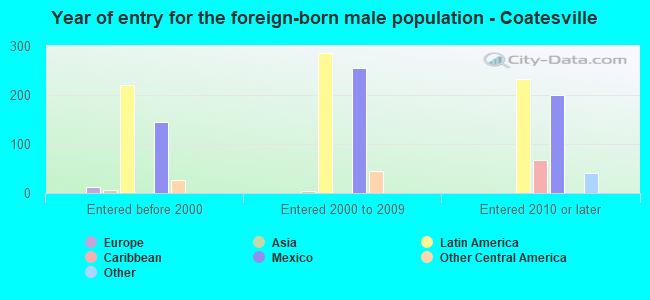
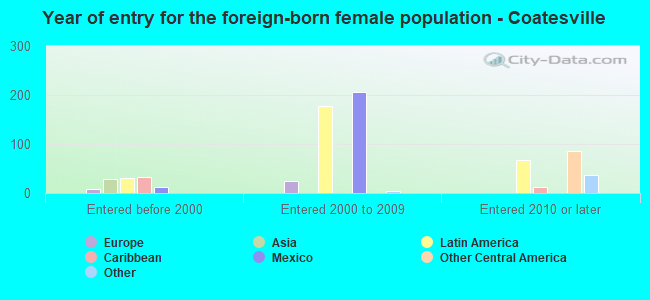
Foreign-born residents in Coatesville 1,185 residents are foreign born (7.5% Latin America ).
This city:
8.7%Pennsylvania:
7.3%
Marital status for residents in Coatesville Marital status - White (Caucasian) population 15 years and over
Males 52.3% Never married34.6% Now married2.5% Separated3.2% Widowed7.3% DivorcedFemales 43.9% Never married27.2% Now married2.5% Separated9.6% Widowed16.8% DivorcedWomen who gave birth in the past 12 months Now married:
100.0% (29)Unmarried:
0.0% (0)
Women who did not give birth in the past 12 months Now married:
23.6% (257)Unmarried:
76.4% (834)
Marital status - Black or African American population 15 years and over
Males 52.7% Never married33.8% Now married2.5% Separated0.5% Widowed10.6% DivorcedFemales 61.3% Never married26.3% Now married2.0% Separated2.0% Widowed8.4% DivorcedWomen who gave birth in the past 12 months Now married:
36.6% (24)Unmarried:
63.4% (42)
Women who did not give birth in the past 12 months Now married:
26.9% (402)Unmarried:
73.1% (1,092)
Marital status - Asian population 15 years and over
Males 91.5% Never married8.5% Now married0.0% Separated0.0% Widowed0.0% DivorcedFemales 65.0% Never married35.0% Now married0.0% Separated0.0% Widowed0.0% DivorcedWomen who did not give birth in the past 12 months Now married:
35.0% (15)Unmarried:
65.0% (29)
Marital status - Other race population 15 years and over
Males 40.8% Never married56.3% Now married2.8% Separated0.0% Widowed0.0% DivorcedFemales 42.0% Never married57.2% Now married0.0% Separated0.8% Widowed0.0% DivorcedWomen who gave birth in the past 12 months Now married:
100.0% (44)Unmarried:
0.0% (0)
Women who did not give birth in the past 12 months Now married:
45.0% (225)Unmarried:
55.0% (275)
Marital status - Two or more races population 15 years and over
Males 50.6% Never married27.7% Now married0.0% Separated9.3% Widowed12.3% DivorcedFemales 42.0% Never married30.2% Now married13.1% Separated0.0% Widowed14.7% DivorcedWomen who gave birth in the past 12 months Now married:
68.4% (19)Unmarried:
31.6% (9)
Women who did not give birth in the past 12 months Now married:
30.3% (78)Unmarried:
69.7% (179)
Marital status - White alone, not Hispanic / Latino population 15 years and over
Males 54.5% Never married29.4% Now married3.1% Separated3.9% Widowed9.1% DivorcedFemales 38.1% Never married30.7% Now married0.7% Separated11.3% Widowed19.2% DivorcedWomen who gave birth in the past 12 months Now married:
100.0% (29)Unmarried:
0.0% (0)
Women who did not give birth in the past 12 months Now married:
27.9% (243)Unmarried:
72.1% (629)
Marital status - Hispanic or Latino population 15 years and over
Males 44.2% Never married46.4% Now married1.4% Separated3.5% Widowed4.6% DivorcedFemales 52.1% Never married39.6% Now married5.3% Separated0.4% Widowed2.5% DivorcedWomen who gave birth in the past 12 months Now married:
100.0% (48)Unmarried:
0.0% (0)
Women who did not give birth in the past 12 months Now married:
32.8% (281)Unmarried:
67.2% (576)
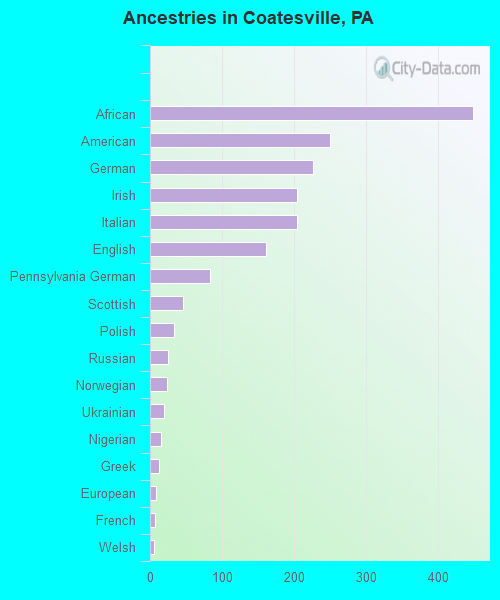
Ancestries in Coatesville
449 6.1% African250 3.4% American227 3.1% German204 2.8% Irish204 2.8% Italian161 2.2% English83 1.1% Pennsylvania German46 0.6% Scottish34 0.5% Polish25 0.3% Russian23 0.3% Norwegian20 0.3% Ukrainian15 0.2% Nigerian13 0.2% Greek9 0.1% European7 0.09% French6 0.08% Welsh4 0.05% Scotch-Irish1 0.01% Jamaican
Geographical mobility in Coatesville Same house 1 year ago 3,556 85.1% White (Caucasian)5,032 88.9% Black or African American12 99.6% American Indian / Alaska Native123 100.0% Asian9 100.0% Native Hawaiian / Pacific Islander1,766 89.3% Other race1,849 87.3% Two or more races2,858 85.8% White alone, not Hispanic / Latino3,129 82.5% Hispanic or LatinoMoved within same county 520 12.4% White / Caucasian522 9.2% Black or African American149 7.5% Other race162 7.6% Two or more races432 13.0% White alone, not Hispanic / Latino465 12.3% Hispanic or LatinoMoved within same state 61 1.5% White / Caucasian138 2.4% Black or African American64 1.9% White alone, not Hispanic / LatinoMoved from different state 32 0.8% White / Caucasian73 3.7% Other race58 2.7% Two or more races15 0.5% White alone, not Hispanic / Latino141 3.7% Hispanic or LatinoMoved from abroad 53 1.3% White40 0.7% Black or African American47 1.2% Hispanic or Latino
Children Nativity (place of birth) in Coatesville
Children under 6 years - Living with two parents Both parents native 400 100.0% NativeBoth parents foreign-born 68 100.0% NativeOne native, one foreign-born parent 97 100.0% NativeChildren under 6 years - Living with one parent Native parent 633 100.0% NativeForeign-born parent 48 100.0% NativeChildren 6 to 17 years - Living with two parents Both parents native 792 100.0% NativeBoth parents foreign-born 448 100.0% NativeOne native, one foreign-born parent 135 100.0% NativeChildren 6 to 17 years - Living with one parent Native parent 1,050 100.0% NativeForeign-born parent 187 47.6% Native205 52.4% Foreign-born
Grandparents responsible for own grandchildren in Coatesville
Grandparents (30 to 59 years) White / Caucasian 20 100.0% Not responsible for grandchildrenBlack or African American 31 17.0% Responsible for grandchildren149 83.0% Not responsible for grandchildrenTwo or more races 6 100.0% Not responsible for grandchildrenWhite alone, not Hispanic / Latino 24 100.0% Not responsible for grandchildrenGrandparents (60 years and over) White / Caucasian 28 47.1% Responsible for grandchildren31 52.9% Not responsible for grandchildrenBlack or African American 4 5.6% Responsible for grandchildren74 94.4% Not responsible for grandchildrenWhite alone, not Hispanic / Latino 29 47.0% Responsible for grandchildren32 53.0% Not responsible for grandchildren