Races in Cocoa Beach, Florida (FL) Detailed Stats
Data:
Races - White alone (%)
Races - White alone (% change since 2000)
Races - Black alone (%)
Races - Black alone (% change since 2000)
Races - American Indian alone (%)
Races - American Indian alone (% change since 2000)
Races - Asian alone (%)
Races - Asian alone (% change since 2000)
Races - Hispanic (%)
Races - Hispanic (% change since 2000)
Races - Native Hawaiian and Other Pacific Islander alone (%)
Races - Native Hawaiian and Other Pacific Islander alone (% change since 2000)
Races - Two or more races(%)
Races - Two or more races(% change since 2000)
Races - Other race alone (%)
Races - Other race alone (% change since 2000)
Racial diversity
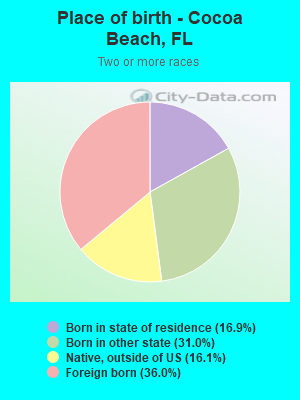
Place of birth - Born in state of residence (%)
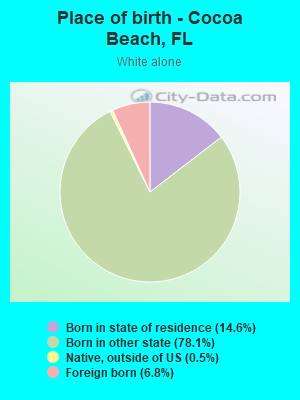
Place of birth - Born in state of residence (%) - White
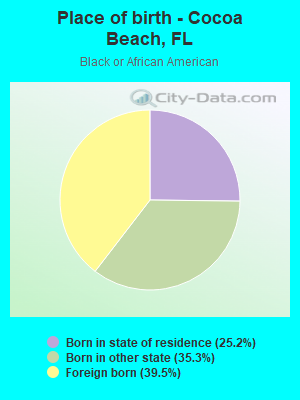
Place of birth - Born in state of residence (%) - Black or African American
Place of birth - Born in state of residence (%) - Asian
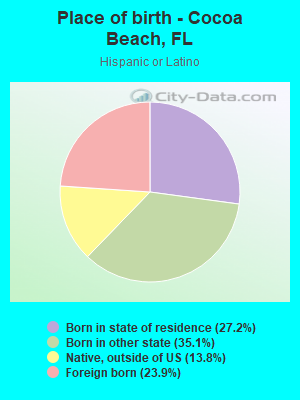
Place of birth - Born in state of residence (%) - Hispanic or Latino
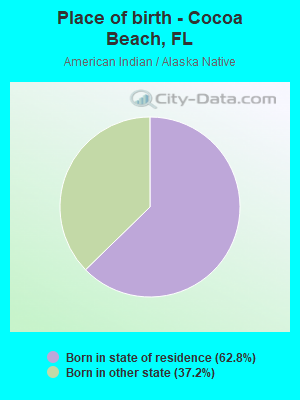
Place of birth - Born in state of residence (%) - American Indian and Alaska Native
Place of birth - Born in state of residence (%) - Multirace
Place of birth - Born in state of residence (%) - Other Race
Place of birth - Born in other state (%)
Place of birth - Born in other state (%) - White
Place of birth - Born in other state (%) - Black or African American
Place of birth - Born in other state (%) - Asian
Place of birth - Born in other state (%) - Hispanic or Latino
Place of birth - Born in other state (%) - American Indian and Alaska Native
Place of birth - Born in other state (%) - Multirace
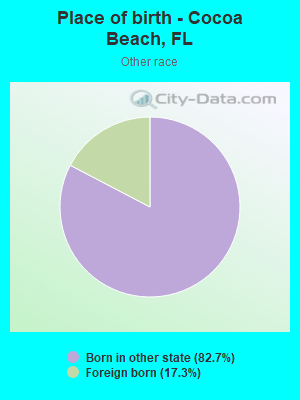
Place of birth - Born in other state (%) - Other Race
Place of birth - Native, outside of US (%)
Place of birth - Native, outside of US (%) - White
Place of birth - Native, outside of US (%) - Black or African American
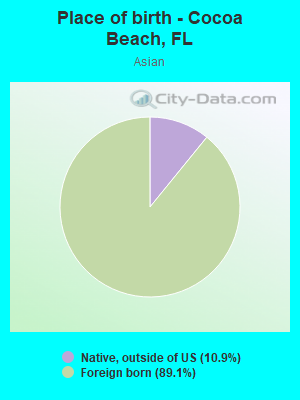
Place of birth - Native, outside of US (%) - Asian
Place of birth - Native, outside of US (%) - Hispanic or Latino
Place of birth - Native, outside of US (%) - American Indian and Alaska Native
Place of birth - Native, outside of US (%) - Multirace
Place of birth - Native, outside of US (%) - Other Race
Place of birth - Foreign born (%)
Place of birth - Foreign born (%) - White
Place of birth - Foreign born (%) - Black or African American
Place of birth - Foreign born (%) - Asian
Place of birth - Foreign born (%) - Hispanic or Latino
Place of birth - Foreign born (%) - American Indian and Alaska Native
Place of birth - Foreign born (%) - Multirace
Place of birth - Foreign born (%) - Other Race
Residents speaking English at home (%)
Residents speaking English at home - Born in the United States (%)
Residents speaking English at home - Native, born elsewhere (%)
Residents speaking English at home - Foreign born (%)
Residents speaking Spanish at home (%)
Residents speaking Spanish at home - Born in the United States (%)
Residents speaking Spanish at home - Native, born elsewhere (%)
Residents speaking Spanish at home - Foreign born (%)
Residents speaking other language at home (%)
Residents speaking other language at home - Born in the United States (%)
Residents speaking other language at home - Native, born elsewhere (%)
Residents speaking other language at home - Foreign born (%)
Marital status - Never married (%)
Marital status - Now married (%)
Marital status - Separated (%)
Marital status - Widowed (%)
Marital status - Divorced (%)
Ancestries Reported - Arab (%)
Ancestries Reported - Czech (%)
Ancestries Reported - Danish (%)
Ancestries Reported - Dutch (%)
Ancestries Reported - English (%)
Ancestries Reported - French (%)
Ancestries Reported - French Canadian (%)
Ancestries Reported - German (%)
Ancestries Reported - Greek (%)
Ancestries Reported - Hungarian (%)
Ancestries Reported - Irish (%)
Ancestries Reported - Italian (%)
Ancestries Reported - Lithuanian (%)
Ancestries Reported - Norwegian (%)
Ancestries Reported - Polish (%)
Ancestries Reported - Portuguese (%)
Ancestries Reported - Russian (%)
Ancestries Reported - Scotch-Irish (%)
Ancestries Reported - Scottish (%)
Ancestries Reported - Slovak (%)
Ancestries Reported - Subsaharan African (%)
Ancestries Reported - Swedish (%)
Ancestries Reported - Swiss (%)
Ancestries Reported - Ukrainian (%)
Ancestries Reported - United States (%)
Ancestries Reported - Welsh (%)
Ancestries Reported - West Indian (%)
Ancestries Reported - Other (%)
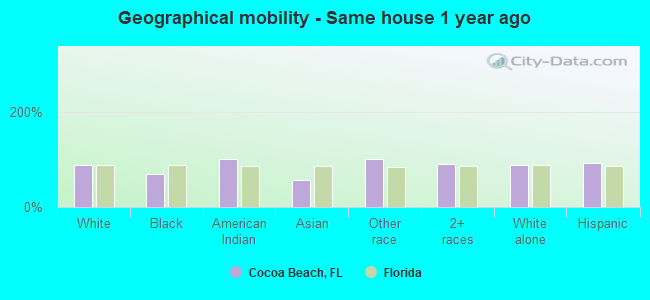
Geographical mobility - Same house 1 year ago (%)
Geographical mobility - Same house 1 year ago (%) - White
Geographical mobility - Same house 1 year ago (%) - Black or African American
Geographical mobility - Same house 1 year ago (%) - Asian
Geographical mobility - Same house 1 year ago (%) - Hispanic or Latino
Geographical mobility - Same house 1 year ago (%) - American Indian and Alaska Native
Geographical mobility - Same house 1 year ago (%) - Multirace
Geographical mobility - Same house 1 year ago (%) - Other Race
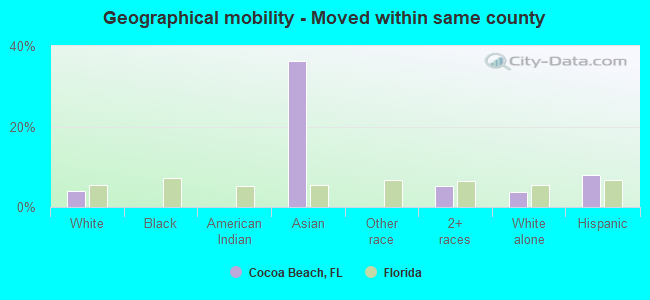
Geographical mobility - Moved within same county (%)
Geographical mobility - Moved within same county (%) - White
Geographical mobility - Moved within same county (%) - Black or African American
Geographical mobility - Moved within same county (%) - Asian
Geographical mobility - Moved within same county (%) - Hispanic or Latino
Geographical mobility - Moved within same county (%) - American Indian and Alaska Native
Geographical mobility - Moved within same county (%) - Multirace
Geographical mobility - Moved within same county (%) - Other Race
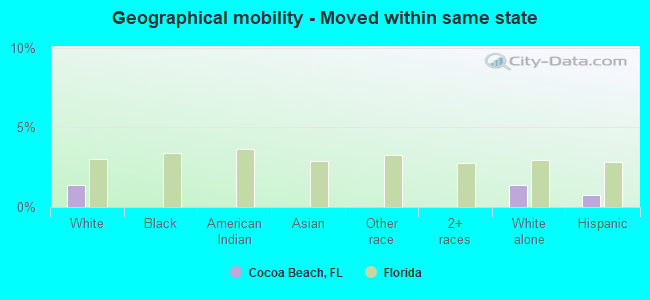
Geographical mobility - Moved from different county within same state (%)
Geographical mobility - Moved from different county within same state (%) - White
Geographical mobility - Moved from different county within same state (%) - Black or African American
Geographical mobility - Moved from different county within same state (%) - Asian
Geographical mobility - Moved from different county within same state (%) - Hispanic or Latino
Geographical mobility - Moved from different county within same state (%) - American Indian and Alaska Native
Geographical mobility - Moved from different county within same state (%) - Multirace
Geographical mobility - Moved from different county within same state (%) - Other Race
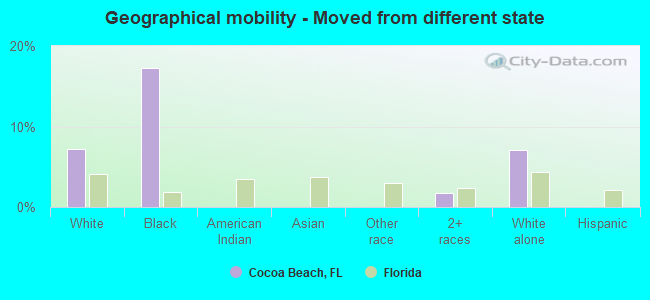
Geographical mobility - Moved from different state (%)
Geographical mobility - Moved from different state (%) - White
Geographical mobility - Moved from different state (%) - Black or African American
Geographical mobility - Moved from different state (%) - Asian
Geographical mobility - Moved from different state (%) - Hispanic or Latino
Geographical mobility - Moved from different state (%) - American Indian and Alaska Native
Geographical mobility - Moved from different state (%) - Multirace
Geographical mobility - Moved from different state (%) - Other Race
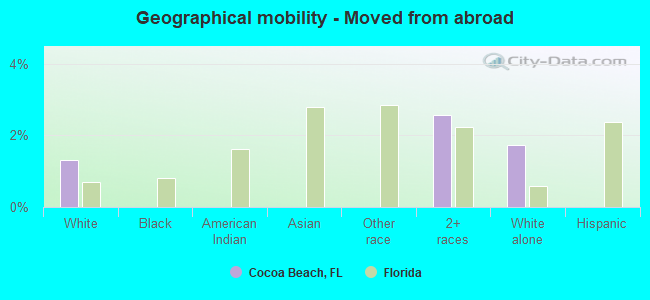
Geographical mobility - Moved from abroad (%)
Geographical mobility - Moved from abroad (%) - White
Geographical mobility - Moved from abroad (%) - Black or African American
Geographical mobility - Moved from abroad (%) - Asian
Geographical mobility - Moved from abroad (%) - Hispanic or Latino
Geographical mobility - Moved from abroad (%) - American Indian and Alaska Native
Geographical mobility - Moved from abroad (%) - Multirace
Geographical mobility - Moved from abroad (%) - Other Race
Place of birth for the foreign-born population - Ireland (%)
Place of birth for the foreign-born population - Denmark (%)
Place of birth for the foreign-born population - Norway (%)
Place of birth for the foreign-born population - Sweden (%)
Place of birth for the foreign-born population - United Kingdom (%)
Place of birth for the foreign-born population - England (%)
Place of birth for the foreign-born population - Scotland (%)
Place of birth for the foreign-born population - Other Northern Europe (%)
Place of birth for the foreign-born population - Austria (%)
Place of birth for the foreign-born population - Belgium (%)
Place of birth for the foreign-born population - France (%)
Place of birth for the foreign-born population - Germany (%)
Place of birth for the foreign-born population - Netherlands (%)
Place of birth for the foreign-born population - Switzerland (%)
Place of birth for the foreign-born population - Other Western Europe (%)
Place of birth for the foreign-born population - Greece (%)
Place of birth for the foreign-born population - Italy (%)
Place of birth for the foreign-born population - Portugal (%)
Place of birth for the foreign-born population - Spain (%)
Place of birth for the foreign-born population - Other Southern Europe (%)
Place of birth for the foreign-born population - Albania (%)
Place of birth for the foreign-born population - Belarus (%)
Place of birth for the foreign-born population - Bosnia and Herzegovina (%)
Place of birth for the foreign-born population - Bulgaria (%)
Place of birth for the foreign-born population - Croatia (%)
Place of birth for the foreign-born population - Czechoslovakia (%)
Place of birth for the foreign-born population - Hungary (%)
Place of birth for the foreign-born population - Latvia (%)
Place of birth for the foreign-born population - Lithuania (%)
Place of birth for the foreign-born population - North Macedonia (Macedonia) (%)
Place of birth for the foreign-born population - Moldova (%)
Place of birth for the foreign-born population - Poland (%)
Place of birth for the foreign-born population - Romania (%)
Place of birth for the foreign-born population - Russia (%)
Place of birth for the foreign-born population - Serbia (%)
Place of birth for the foreign-born population - Ukraine (%)
Place of birth for the foreign-born population - Other Eastern Europe (%)
Place of birth for the foreign-born population - China (%)
Place of birth for the foreign-born population - Hong Kong (%)
Place of birth for the foreign-born population - Taiwan (%)
Place of birth for the foreign-born population - Japan (%)
Place of birth for the foreign-born population - Korea (%)
Place of birth for the foreign-born population - Other Eastern Asia (%)
Place of birth for the foreign-born population - Afghanistan (%)
Place of birth for the foreign-born population - Bangladesh (%)
Place of birth for the foreign-born population - India (%)
Place of birth for the foreign-born population - Iran (%)
Place of birth for the foreign-born population - Kazakhstan (%)
Place of birth for the foreign-born population - Nepal (%)
Place of birth for the foreign-born population - Pakistan (%)
Place of birth for the foreign-born population - Sri Lanka (%)
Place of birth for the foreign-born population - Uzbekistan (%)
Place of birth for the foreign-born population - Other South Central Asia (%)
Place of birth for the foreign-born population - Burma (%)
Place of birth for the foreign-born population - Cambodia (%)
Place of birth for the foreign-born population - Indonesia (%)
Place of birth for the foreign-born population - Laos (%)
Place of birth for the foreign-born population - Malaysia (%)
Place of birth for the foreign-born population - Philippines (%)
Place of birth for the foreign-born population - Singapore (%)
Place of birth for the foreign-born population - Thailand (%)
Place of birth for the foreign-born population - Vietnam (%)
Place of birth for the foreign-born population - Other South Eastern Asia (%)
Place of birth for the foreign-born population - Armenia (%)
Place of birth for the foreign-born population - Iraq (%)
Place of birth for the foreign-born population - Israel (%)
Place of birth for the foreign-born population - Jordan (%)
Place of birth for the foreign-born population - Kuwait (%)
Place of birth for the foreign-born population - Lebanon (%)
Place of birth for the foreign-born population - Saudi Arabia (%)
Place of birth for the foreign-born population - Syria (%)
Place of birth for the foreign-born population - Turkey (%)
Place of birth for the foreign-born population - Yemen (%)
Place of birth for the foreign-born population - Other Western Asia (%)
Place of birth for the foreign-born population - Eritrea (%)
Place of birth for the foreign-born population - Ethiopia (%)
Place of birth for the foreign-born population - Kenya (%)
Place of birth for the foreign-born population - Somalia (%)
Place of birth for the foreign-born population - Uganda (%)
Place of birth for the foreign-born population - Zimbabwe (%)
Place of birth for the foreign-born population - Other Eastern Africa (%)
Place of birth for the foreign-born population - Cameroon (%)
Place of birth for the foreign-born population - Congo (%)
Place of birth for the foreign-born population - Democratic Republic of Congo (Zaire) (%)
Place of birth for the foreign-born population - Other Middle Africa (%)
Place of birth for the foreign-born population - Egypt (%)
Place of birth for the foreign-born population - Morocco (%)
Place of birth for the foreign-born population - Sudan (%)
Place of birth for the foreign-born population - Other Northern Africa (%)
Place of birth for the foreign-born population - South Africa (%)
Place of birth for the foreign-born population - Other Southern Africa (%)
Place of birth for the foreign-born population - Cabo Verde (%)
Place of birth for the foreign-born population - Ghana (%)
Place of birth for the foreign-born population - Liberia (%)
Place of birth for the foreign-born population - Nigeria (%)
Place of birth for the foreign-born population - Senegal (%)
Place of birth for the foreign-born population - Sierra Leone (%)
Place of birth for the foreign-born population - Other Western Africa (%)
Place of birth for the foreign-born population - Australia (%)
Place of birth for the foreign-born population - New Zealand (%)
Place of birth for the foreign-born population - Fiji (%)
Place of birth for the foreign-born population - Micronesia (%)
Place of birth for the foreign-born population - Bahamas (%)
Place of birth for the foreign-born population - Barbados (%)
Place of birth for the foreign-born population - Cuba (%)
Place of birth for the foreign-born population - Dominica (%)
Place of birth for the foreign-born population - Dominican Republic (%)
Place of birth for the foreign-born population - Grenada (%)
Place of birth for the foreign-born population - Haiti (%)
Place of birth for the foreign-born population - Jamaica (%)
Place of birth for the foreign-born population - St. Vincent and the Grenadines (%)
Place of birth for the foreign-born population - Trinidad and Tobago (%)
Place of birth for the foreign-born population - West Indies (%)
Place of birth for the foreign-born population - Other Caribbean (%)
Place of birth for the foreign-born population - Belize (%)
Place of birth for the foreign-born population - Costa Rica (%)
Place of birth for the foreign-born population - El Salvador (%)
Place of birth for the foreign-born population - Guatemala (%)
Place of birth for the foreign-born population - Honduras (%)
Place of birth for the foreign-born population - Mexico (%)
Place of birth for the foreign-born population - Nicaragua (%)
Place of birth for the foreign-born population - Panama (%)
Place of birth for the foreign-born population - Other Central America (%)
Place of birth for the foreign-born population - Argentina (%)
Place of birth for the foreign-born population - Bolivia (%)
Place of birth for the foreign-born population - Brazil (%)
Place of birth for the foreign-born population - Chile (%)
Place of birth for the foreign-born population - Colombia (%)
Place of birth for the foreign-born population - Ecuador (%)
Place of birth for the foreign-born population - Guyana (%)
Place of birth for the foreign-born population - Peru (%)
Place of birth for the foreign-born population - Uruguay (%)
Place of birth for the foreign-born population - Venezuela (%)
Place of birth for the foreign-born population - Other South America (%)
Place of birth for the foreign-born population - Canada (%)
Place of birth for the foreign-born population - Other Northern America (%)
Place of birth for the foreign-born population - Other (%)
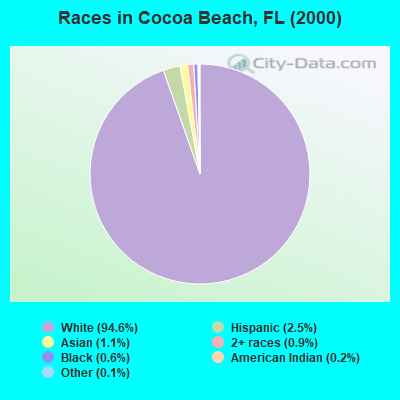
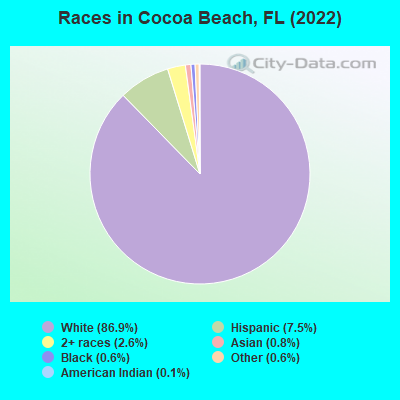
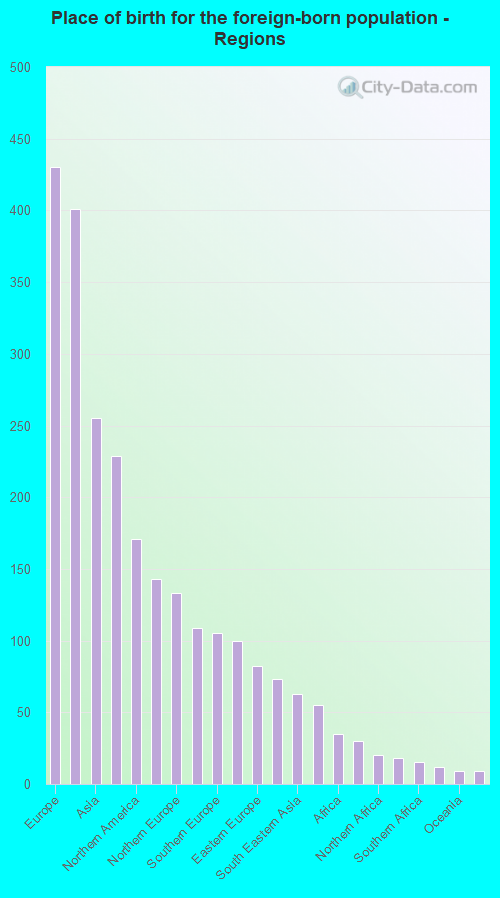
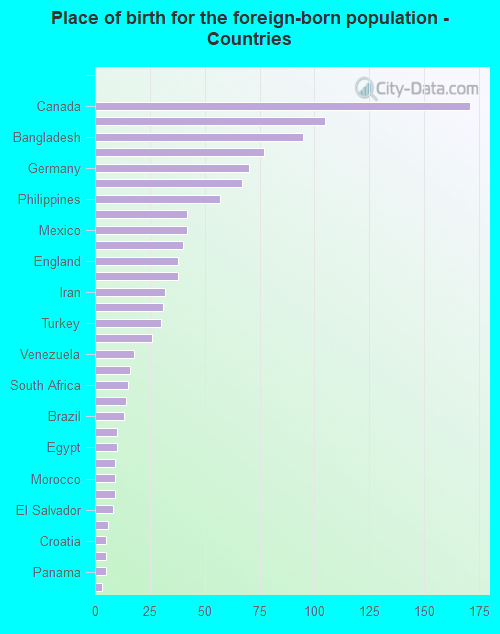
According to 2022 data, the most numerous races in Cocoa Beach, FL are White alone (10,175 residents), Hispanic (878 residents), and Black alone (70 residents). 87.2% of Cocoa Beach residents speak English at home. 9.7% of Cocoa Beach, FL residents are foreign-born (3.6% born in Europe, 2.1% born in Asia, 1.9% born in Latin America, 1.4% born in North America), which is 117.0% less than the foreign-born rate of 21.0% across the entire state of Florida.
Race distribution in Cocoa Beach
2000 2022
10,458,509 65.4% White alone 2,682,715 16.8% Hispanic 2,264,268 14.2% Black alone 261,693 1.6% Asian alone 236,954 1.5% Two or more races 42,358 0.3% American Indian alone 28,994 0.2% Other race alone 6,887 0.04% Native Hawaiian and Other
11,309,403 50.8% White alone 6,025,039 27.1% Hispanic 3,241,015 14.6% Black alone 861,630 3.9% Two or more races 623,692 2.8% Asian alone 152,054 0.7% Other race alone 22,504 0.1% American Indian alone 9,486 0.04% Native Hawaiian and Other
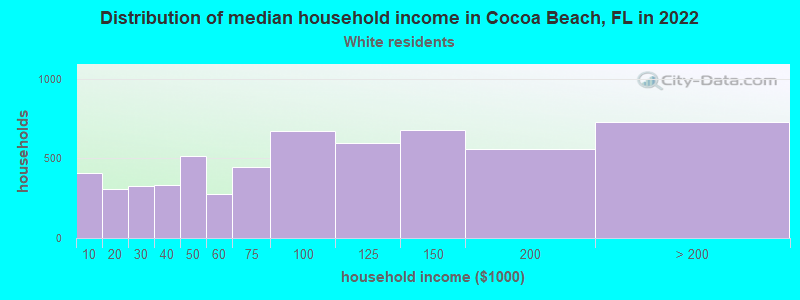
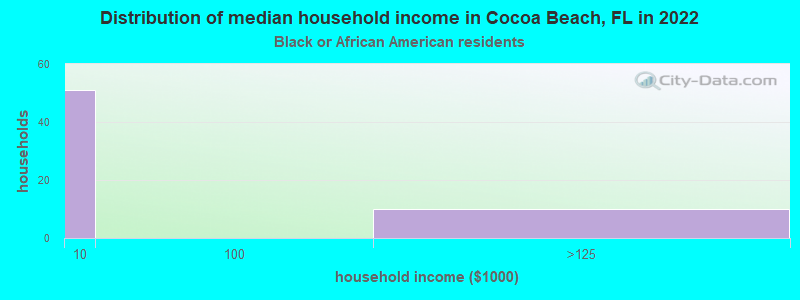
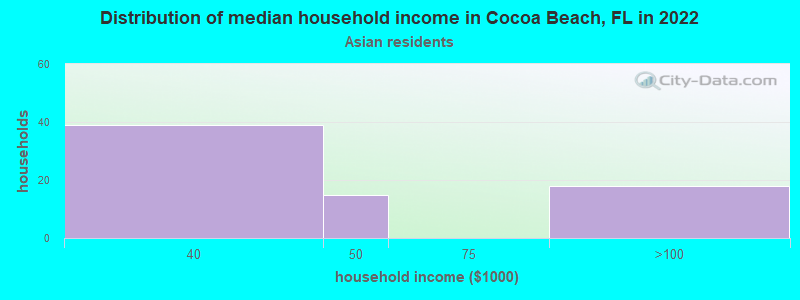
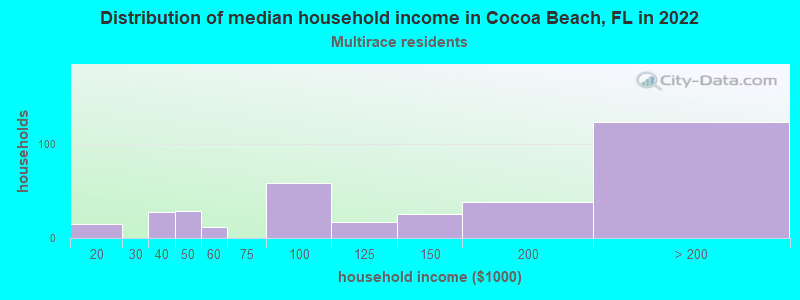
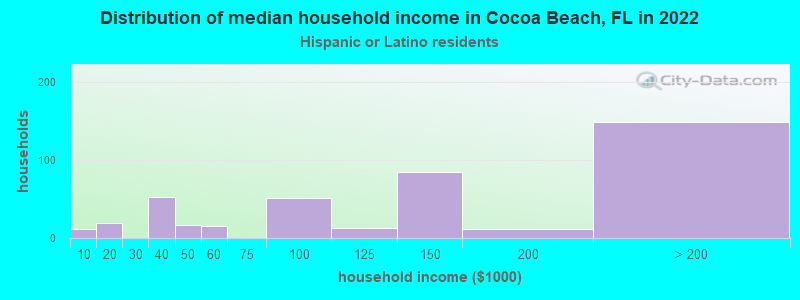
Income and house value in Cocoa Beach Median household income in 2022 $83,398 White non-Hispanic householders$45,283 Asian householders$149,645 Two or more races householders$114,204 Hispanic or Latino race householdersMedian 2022 house value $617,749 White Non-Hispanic householders$349,824 American Indian or Alaska Native householders $580,709 Asian householdersover $1,000,000 Two or more races householders$573,301 Hispanic or Latino householders
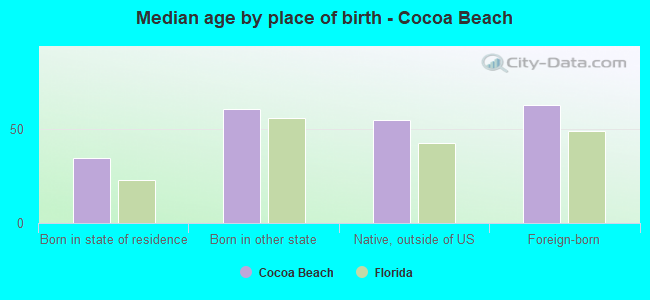
Median age by race in Cocoa Beach
60.8 Median age for White residents60.4 61.3 53.2 Median age for Black or African American residents15.7 -655,115,510.9 -598,566,307.6 Median age for American Indian / Alaska Native residents-611,418,047.3 -594,925,633.7 55.1 Median age for Asian residents71.5 55.6 -679,849,340.2 Median age for Native Hawaiian / Pacific Islander residents-858,307,848.3 -443,298,968.6 43.2 Median age for Other race residents16.4 58.7 54.2 Median age for Two or more races residents34.0 57.2 60.7 Median age for White alone residents60.3 61.3 47.2 Median age for Hispanic or Latino residents51.2 45.7
Owner/renter occupied households by race in Cocoa Beach
House owners and renters - White residents 4,467 77.7% Owner occupied1,280 22.3% Renter occupiedHouse owners and renters - Black or African American residents 15 22.5% Owner occupied50 77.5% Renter occupiedHouse owners and renters - Asian residents 18 33.8% Owner occupied36 66.2% Renter occupiedHouse owners and renters - Other race residents 17 100.0% Owner occupiedHouse owners and renters - Two or more races residents 269 79.7% Owner occupied68 20.3% Renter occupiedHouse owners and renters - White alone residents 4,448 77.8% Owner occupied1,267 22.2% Renter occupiedHouse owners and renters - Hispanic or Latino residents 252 73.3% Owner occupied92 26.7% Renter occupied
Language usage in Cocoa Beach
English speakers - Total 87.2% of residents of Cocoa Beach speak English at home.
5.2% of residents speak Spanish at home 487 81.2% Speak English very well113 18.8% Speak English less than very well7.2% of residents speak other language at home 645 77.1% Speak English very well192 22.9% Speak English less than very well
English speakers - Born in the United States 94.4% of residents of Cocoa Beach speak English at home.
2.6% of residents speak Spanish at home 193 88.1% Speak English very well26 11.9% Speak English less than very well2.4% of residents speak other language at home 169 82.0% Speak English very well37 18.0% Speak English less than very well
English speakers - Native, born elsewhere 33.5% of residents of Cocoa Beach speak English at home.
59.8% of residents speak Spanish at home 93 86.9% Speak English very well14 13.1% Speak English less than very well
English speakers - Foreign-born 31.7% of residents of Cocoa Beach speak English at home.
13.6% of residents speak Spanish at home 125 76.2% Speak English very well39 23.8% Speak English less than very well51.2% of residents speak other language at home 478 77.1% Speak English very well142 22.9% Speak English less than very well
White (Caucasian) - Speak only English Native:
95.8% (9,083)Foreign-born:
50.5% (332)
White (Caucasian) - Speak another language Native:
3.7% (348)Foreign-born:
49.6% (326)
Black or African American - Speak another language Native:
21.0% (12)Foreign-born:
100.0% (37)
Asian - Speak another language Native:
100.0% (15)Foreign-born:
89.7% (92)
Other race - Speak only English Native:
100.0% (105)Foreign-born:
61.8% (14)
Two or more races - Speak only English Native:
66.9% (389)Foreign-born:
7.4% (24)
Two or more races - Speak another language Native:
33.3% (193)Foreign-born:
89.2% (295)
White alone - Speak only English Native:
96.6% (9,085)Foreign-born:
46.8% (327)
White alone - Speak another language Native:
2.8% (260)Foreign-born:
52.7% (369)
Hispanic or Latino - Speak only English Native:
48.1% (307)Foreign-born:
19.3% (40)
Hispanic or Latino - Speak another language Native:
51.4% (328)Foreign-born:
80.1% (166)
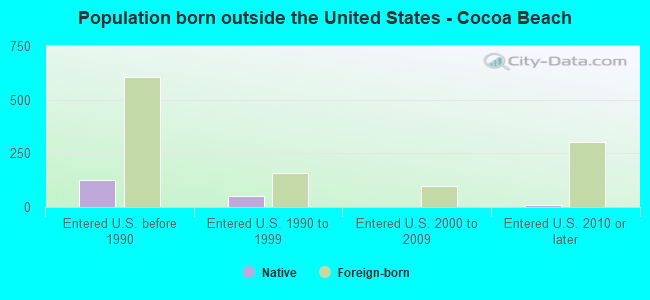
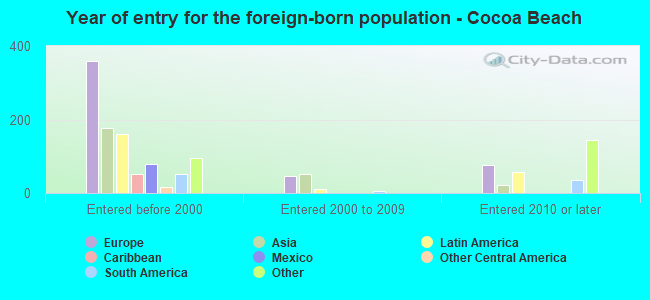
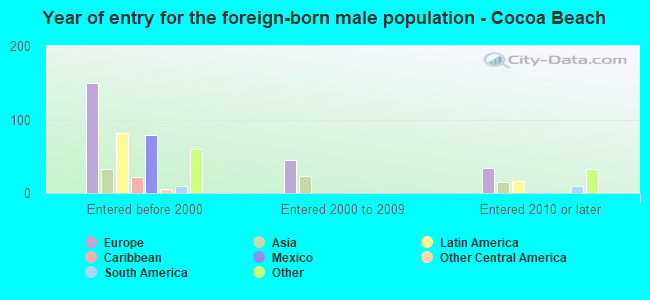
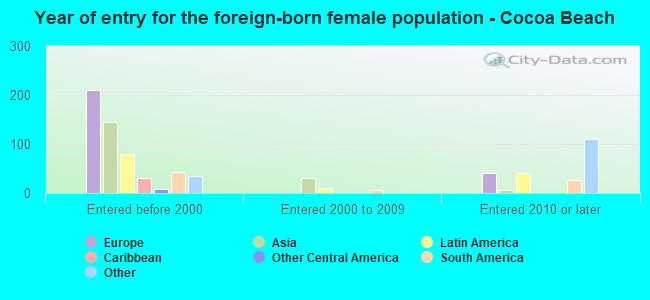
Foreign-born residents in Cocoa Beach 1,133 residents are foreign born (3.6% Europe , 2.1% Asia , 1.9% Latin America , 1.4% North America ).
This city:
9.7%Florida:
21.1%
Marital status for residents in Cocoa Beach Marital status - White (Caucasian) population 15 years and over
Males 23.0% Never married53.0% Now married0.7% Separated5.3% Widowed18.0% DivorcedFemales 15.6% Never married52.9% Now married2.6% Separated12.4% Widowed16.5% DivorcedWomen who gave birth in the past 12 months Now married:
41.9% (13)Unmarried:
58.1% (17)
Women who did not give birth in the past 12 months Now married:
38.9% (474)Unmarried:
61.1% (746)
Marital status - Black or African American population 15 years and over
Males 44.0% Never married56.0% Now married0.0% Separated0.0% Widowed0.0% DivorcedFemales 0.0% Never married28.6% Now married0.0% Separated0.0% Widowed71.4% DivorcedMarital status - Asian population 15 years and over
Males 0.0% Never married54.8% Now married45.2% Separated0.0% Widowed0.0% DivorcedFemales 36.5% Never married56.8% Now married6.8% Separated0.0% Widowed0.0% DivorcedWomen who did not give birth in the past 12 months Now married:
15.6% (6)Unmarried:
84.4% (31)
Marital status - Other race population 15 years and over
Males 0.0% Never married100.0% Now married0.0% Separated0.0% Widowed0.0% DivorcedFemales 0.0% Never married21.2% Now married0.0% Separated0.0% Widowed78.8% DivorcedWomen who did not give birth in the past 12 months Now married:
100.0% (14)Unmarried:
0.0% (0)
Marital status - Two or more races population 15 years and over
Males 40.3% Never married49.8% Now married0.0% Separated0.0% Widowed10.0% DivorcedFemales 19.2% Never married66.8% Now married2.6% Separated1.2% Widowed10.2% DivorcedWomen who did not give birth in the past 12 months Now married:
66.9% (267)Unmarried:
33.1% (132)
Marital status - White alone, not Hispanic / Latino population 15 years and over
Males 22.2% Never married53.1% Now married0.8% Separated5.3% Widowed18.6% DivorcedFemales 15.9% Never married52.3% Now married2.6% Separated12.6% Widowed16.6% DivorcedWomen who gave birth in the past 12 months Now married:
41.9% (13)Unmarried:
58.1% (18)
Women who did not give birth in the past 12 months Now married:
37.3% (460)Unmarried:
62.7% (773)
Marital status - Hispanic or Latino population 15 years and over
Males 39.7% Never married53.6% Now married0.0% Separated2.9% Widowed3.8% DivorcedFemales 12.2% Never married62.0% Now married0.0% Separated0.0% Widowed25.8% DivorcedWomen who did not give birth in the past 12 months Now married:
60.5% (107)Unmarried:
39.5% (70)
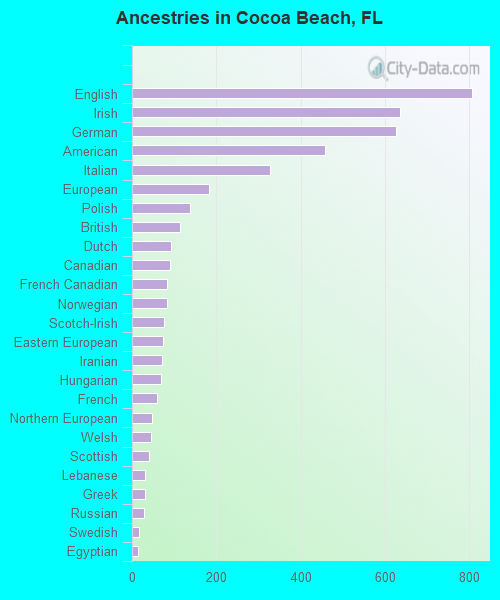
Ancestries in Cocoa Beach
806 16.6% English636 13.1% Irish626 12.9% German458 9.4% American327 6.7% Italian183 3.8% European138 2.8% Polish113 2.3% British93 1.9% Dutch91 1.9% Canadian84 1.7% French Canadian84 1.7% Norwegian75 1.5% Scotch-Irish73 1.5% Eastern European71 1.5% Iranian68 1.4% Hungarian59 1.2% French47 1.0% Northern European44 0.9% Welsh40 0.8% Scottish32 0.7% Lebanese31 0.6% Greek28 0.6% Russian17 0.4% Swedish14 0.3% Egyptian11 0.2% Moroccan10 0.2% Ukrainian9 0.2% Turkish8 0.2% Lithuanian7 0.1% Belgian7 0.1% Scandinavian4 0.08% Croatian
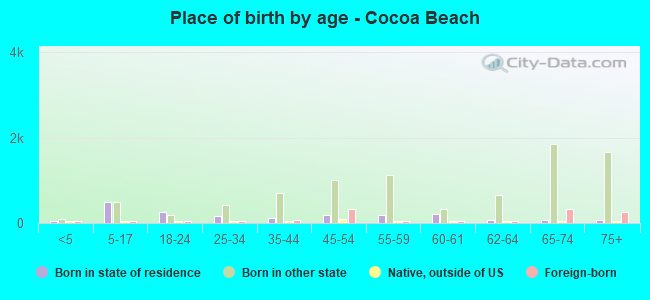
Children Nativity (place of birth) in Cocoa Beach
Children under 6 years - Living with two parents Both parents native 129 100.0% NativeChildren under 6 years - Living with one parent Native parent 54 100.0% NativeChildren 6 to 17 years - Living with two parents Both parents native 333 100.0% NativeBoth parents foreign-born 31 49.0% Native32 51.0% Foreign-bornOne native, one foreign-born parent 210 100.0% NativeChildren 6 to 17 years - Living with one parent Native parent 276 100.0% Native
Grandparents responsible for own grandchildren in Cocoa Beach
Grandparents (30 to 59 years) White / Caucasian 9 100.0% Not responsible for grandchildrenWhite alone, not Hispanic / Latino 8 100.0% Not responsible for grandchildrenGrandparents (60 years and over) White / Caucasian 56 86.5% Responsible for grandchildren9 13.5% Not responsible for grandchildrenWhite alone, not Hispanic / Latino 50 87.0% Responsible for grandchildren7 13.0% Not responsible for grandchildren