Races in Cohoes, New York (NY) Detailed Stats
Data:
Races - White alone (%)
Races - White alone (% change since 2000)
Races - Black alone (%)
Races - Black alone (% change since 2000)
Races - American Indian alone (%)
Races - American Indian alone (% change since 2000)
Races - Asian alone (%)
Races - Asian alone (% change since 2000)
Races - Hispanic (%)
Races - Hispanic (% change since 2000)
Races - Native Hawaiian and Other Pacific Islander alone (%)
Races - Native Hawaiian and Other Pacific Islander alone (% change since 2000)
Races - Two or more races(%)
Races - Two or more races(% change since 2000)
Races - Other race alone (%)
Races - Other race alone (% change since 2000)
Racial diversity
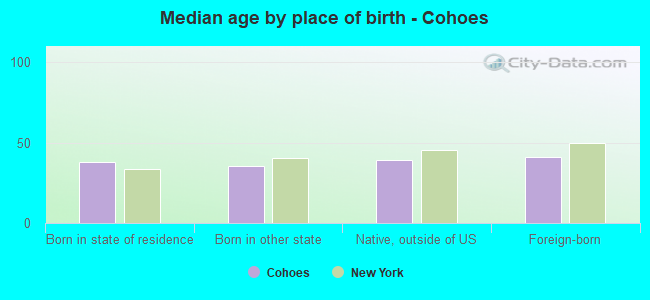
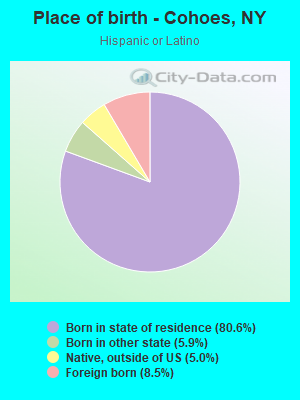
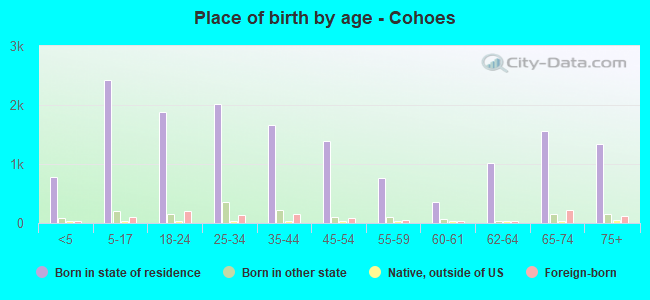
Place of birth - Born in state of residence (%)
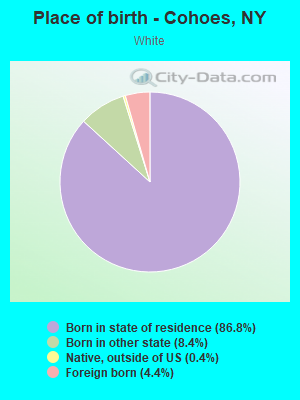
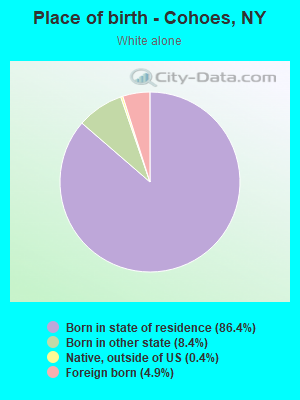
Place of birth - Born in state of residence (%) - White
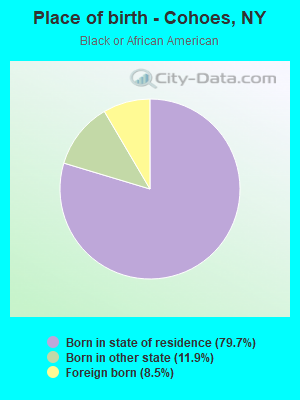
Place of birth - Born in state of residence (%) - Black or African American
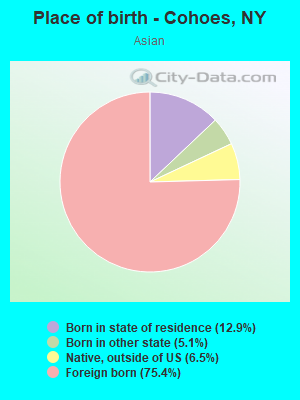
Place of birth - Born in state of residence (%) - Asian
Place of birth - Born in state of residence (%) - Hispanic or Latino
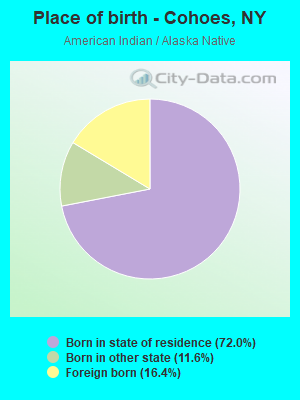
Place of birth - Born in state of residence (%) - American Indian and Alaska Native
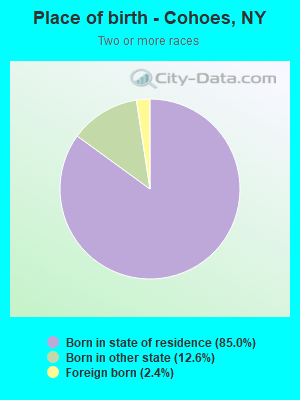
Place of birth - Born in state of residence (%) - Multirace
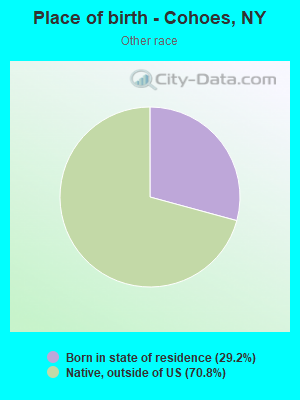
Place of birth - Born in state of residence (%) - Other Race
Place of birth - Born in other state (%)
Place of birth - Born in other state (%) - White
Place of birth - Born in other state (%) - Black or African American
Place of birth - Born in other state (%) - Asian
Place of birth - Born in other state (%) - Hispanic or Latino
Place of birth - Born in other state (%) - American Indian and Alaska Native
Place of birth - Born in other state (%) - Multirace
Place of birth - Born in other state (%) - Other Race
Place of birth - Native, outside of US (%)
Place of birth - Native, outside of US (%) - White
Place of birth - Native, outside of US (%) - Black or African American
Place of birth - Native, outside of US (%) - Asian
Place of birth - Native, outside of US (%) - Hispanic or Latino
Place of birth - Native, outside of US (%) - American Indian and Alaska Native
Place of birth - Native, outside of US (%) - Multirace
Place of birth - Native, outside of US (%) - Other Race
Place of birth - Foreign born (%)
Place of birth - Foreign born (%) - White
Place of birth - Foreign born (%) - Black or African American
Place of birth - Foreign born (%) - Asian
Place of birth - Foreign born (%) - Hispanic or Latino
Place of birth - Foreign born (%) - American Indian and Alaska Native
Place of birth - Foreign born (%) - Multirace
Place of birth - Foreign born (%) - Other Race
Residents speaking English at home (%)
Residents speaking English at home - Born in the United States (%)
Residents speaking English at home - Native, born elsewhere (%)
Residents speaking English at home - Foreign born (%)
Residents speaking Spanish at home (%)
Residents speaking Spanish at home - Born in the United States (%)
Residents speaking Spanish at home - Native, born elsewhere (%)
Residents speaking Spanish at home - Foreign born (%)
Residents speaking other language at home (%)
Residents speaking other language at home - Born in the United States (%)
Residents speaking other language at home - Native, born elsewhere (%)
Residents speaking other language at home - Foreign born (%)
Marital status - Never married (%)
Marital status - Now married (%)
Marital status - Separated (%)
Marital status - Widowed (%)
Marital status - Divorced (%)
Ancestries Reported - Arab (%)
Ancestries Reported - Czech (%)
Ancestries Reported - Danish (%)
Ancestries Reported - Dutch (%)
Ancestries Reported - English (%)
Ancestries Reported - French (%)
Ancestries Reported - French Canadian (%)
Ancestries Reported - German (%)
Ancestries Reported - Greek (%)
Ancestries Reported - Hungarian (%)
Ancestries Reported - Irish (%)
Ancestries Reported - Italian (%)
Ancestries Reported - Lithuanian (%)
Ancestries Reported - Norwegian (%)
Ancestries Reported - Polish (%)
Ancestries Reported - Portuguese (%)
Ancestries Reported - Russian (%)
Ancestries Reported - Scotch-Irish (%)
Ancestries Reported - Scottish (%)
Ancestries Reported - Slovak (%)
Ancestries Reported - Subsaharan African (%)
Ancestries Reported - Swedish (%)
Ancestries Reported - Swiss (%)
Ancestries Reported - Ukrainian (%)
Ancestries Reported - United States (%)
Ancestries Reported - Welsh (%)
Ancestries Reported - West Indian (%)
Ancestries Reported - Other (%)
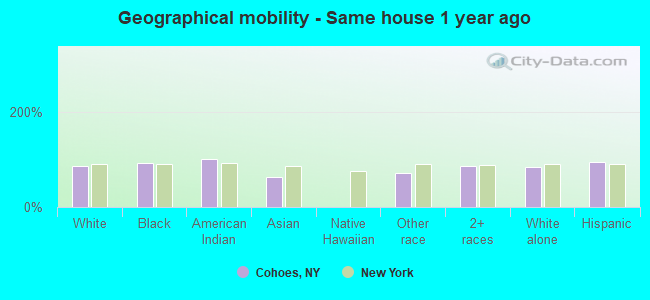
Geographical mobility - Same house 1 year ago (%)
Geographical mobility - Same house 1 year ago (%) - White
Geographical mobility - Same house 1 year ago (%) - Black or African American
Geographical mobility - Same house 1 year ago (%) - Asian
Geographical mobility - Same house 1 year ago (%) - Hispanic or Latino
Geographical mobility - Same house 1 year ago (%) - American Indian and Alaska Native
Geographical mobility - Same house 1 year ago (%) - Multirace
Geographical mobility - Same house 1 year ago (%) - Other Race
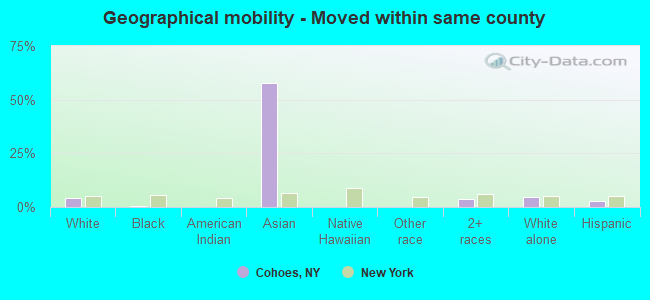
Geographical mobility - Moved within same county (%)
Geographical mobility - Moved within same county (%) - White
Geographical mobility - Moved within same county (%) - Black or African American
Geographical mobility - Moved within same county (%) - Asian
Geographical mobility - Moved within same county (%) - Hispanic or Latino
Geographical mobility - Moved within same county (%) - American Indian and Alaska Native
Geographical mobility - Moved within same county (%) - Multirace
Geographical mobility - Moved within same county (%) - Other Race
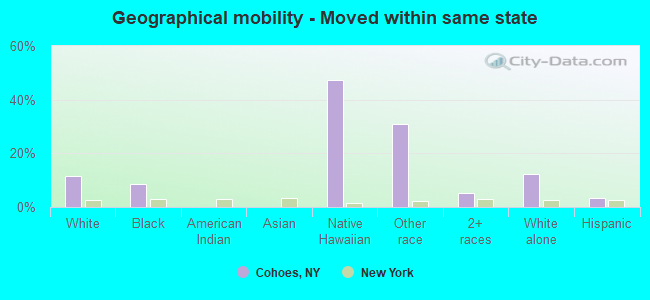
Geographical mobility - Moved from different county within same state (%)
Geographical mobility - Moved from different county within same state (%) - White
Geographical mobility - Moved from different county within same state (%) - Black or African American
Geographical mobility - Moved from different county within same state (%) - Asian
Geographical mobility - Moved from different county within same state (%) - Hispanic or Latino
Geographical mobility - Moved from different county within same state (%) - American Indian and Alaska Native
Geographical mobility - Moved from different county within same state (%) - Multirace
Geographical mobility - Moved from different county within same state (%) - Other Race
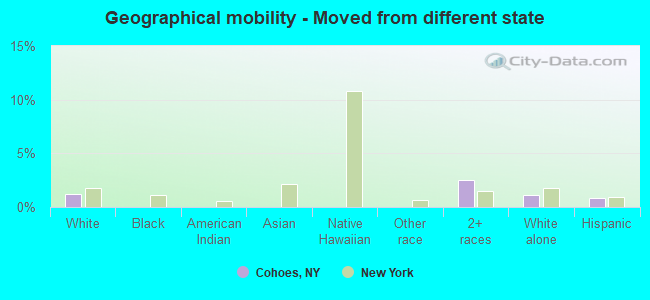
Geographical mobility - Moved from different state (%)
Geographical mobility - Moved from different state (%) - White
Geographical mobility - Moved from different state (%) - Black or African American
Geographical mobility - Moved from different state (%) - Asian
Geographical mobility - Moved from different state (%) - Hispanic or Latino
Geographical mobility - Moved from different state (%) - American Indian and Alaska Native
Geographical mobility - Moved from different state (%) - Multirace
Geographical mobility - Moved from different state (%) - Other Race
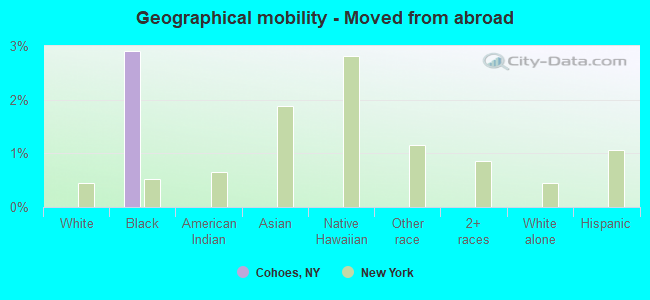
Geographical mobility - Moved from abroad (%)
Geographical mobility - Moved from abroad (%) - White
Geographical mobility - Moved from abroad (%) - Black or African American
Geographical mobility - Moved from abroad (%) - Asian
Geographical mobility - Moved from abroad (%) - Hispanic or Latino
Geographical mobility - Moved from abroad (%) - American Indian and Alaska Native
Geographical mobility - Moved from abroad (%) - Multirace
Geographical mobility - Moved from abroad (%) - Other Race
Place of birth for the foreign-born population - Ireland (%)
Place of birth for the foreign-born population - Denmark (%)
Place of birth for the foreign-born population - Norway (%)
Place of birth for the foreign-born population - Sweden (%)
Place of birth for the foreign-born population - United Kingdom (%)
Place of birth for the foreign-born population - England (%)
Place of birth for the foreign-born population - Scotland (%)
Place of birth for the foreign-born population - Other Northern Europe (%)
Place of birth for the foreign-born population - Austria (%)
Place of birth for the foreign-born population - Belgium (%)
Place of birth for the foreign-born population - France (%)
Place of birth for the foreign-born population - Germany (%)
Place of birth for the foreign-born population - Netherlands (%)
Place of birth for the foreign-born population - Switzerland (%)
Place of birth for the foreign-born population - Other Western Europe (%)
Place of birth for the foreign-born population - Greece (%)
Place of birth for the foreign-born population - Italy (%)
Place of birth for the foreign-born population - Portugal (%)
Place of birth for the foreign-born population - Spain (%)
Place of birth for the foreign-born population - Other Southern Europe (%)
Place of birth for the foreign-born population - Albania (%)
Place of birth for the foreign-born population - Belarus (%)
Place of birth for the foreign-born population - Bosnia and Herzegovina (%)
Place of birth for the foreign-born population - Bulgaria (%)
Place of birth for the foreign-born population - Croatia (%)
Place of birth for the foreign-born population - Czechoslovakia (%)
Place of birth for the foreign-born population - Hungary (%)
Place of birth for the foreign-born population - Latvia (%)
Place of birth for the foreign-born population - Lithuania (%)
Place of birth for the foreign-born population - North Macedonia (Macedonia) (%)
Place of birth for the foreign-born population - Moldova (%)
Place of birth for the foreign-born population - Poland (%)
Place of birth for the foreign-born population - Romania (%)
Place of birth for the foreign-born population - Russia (%)
Place of birth for the foreign-born population - Serbia (%)
Place of birth for the foreign-born population - Ukraine (%)
Place of birth for the foreign-born population - Other Eastern Europe (%)
Place of birth for the foreign-born population - China (%)
Place of birth for the foreign-born population - Hong Kong (%)
Place of birth for the foreign-born population - Taiwan (%)
Place of birth for the foreign-born population - Japan (%)
Place of birth for the foreign-born population - Korea (%)
Place of birth for the foreign-born population - Other Eastern Asia (%)
Place of birth for the foreign-born population - Afghanistan (%)
Place of birth for the foreign-born population - Bangladesh (%)
Place of birth for the foreign-born population - India (%)
Place of birth for the foreign-born population - Iran (%)
Place of birth for the foreign-born population - Kazakhstan (%)
Place of birth for the foreign-born population - Nepal (%)
Place of birth for the foreign-born population - Pakistan (%)
Place of birth for the foreign-born population - Sri Lanka (%)
Place of birth for the foreign-born population - Uzbekistan (%)
Place of birth for the foreign-born population - Other South Central Asia (%)
Place of birth for the foreign-born population - Burma (%)
Place of birth for the foreign-born population - Cambodia (%)
Place of birth for the foreign-born population - Indonesia (%)
Place of birth for the foreign-born population - Laos (%)
Place of birth for the foreign-born population - Malaysia (%)
Place of birth for the foreign-born population - Philippines (%)
Place of birth for the foreign-born population - Singapore (%)
Place of birth for the foreign-born population - Thailand (%)
Place of birth for the foreign-born population - Vietnam (%)
Place of birth for the foreign-born population - Other South Eastern Asia (%)
Place of birth for the foreign-born population - Armenia (%)
Place of birth for the foreign-born population - Iraq (%)
Place of birth for the foreign-born population - Israel (%)
Place of birth for the foreign-born population - Jordan (%)
Place of birth for the foreign-born population - Kuwait (%)
Place of birth for the foreign-born population - Lebanon (%)
Place of birth for the foreign-born population - Saudi Arabia (%)
Place of birth for the foreign-born population - Syria (%)
Place of birth for the foreign-born population - Turkey (%)
Place of birth for the foreign-born population - Yemen (%)
Place of birth for the foreign-born population - Other Western Asia (%)
Place of birth for the foreign-born population - Eritrea (%)
Place of birth for the foreign-born population - Ethiopia (%)
Place of birth for the foreign-born population - Kenya (%)
Place of birth for the foreign-born population - Somalia (%)
Place of birth for the foreign-born population - Uganda (%)
Place of birth for the foreign-born population - Zimbabwe (%)
Place of birth for the foreign-born population - Other Eastern Africa (%)
Place of birth for the foreign-born population - Cameroon (%)
Place of birth for the foreign-born population - Congo (%)
Place of birth for the foreign-born population - Democratic Republic of Congo (Zaire) (%)
Place of birth for the foreign-born population - Other Middle Africa (%)
Place of birth for the foreign-born population - Egypt (%)
Place of birth for the foreign-born population - Morocco (%)
Place of birth for the foreign-born population - Sudan (%)
Place of birth for the foreign-born population - Other Northern Africa (%)
Place of birth for the foreign-born population - South Africa (%)
Place of birth for the foreign-born population - Other Southern Africa (%)
Place of birth for the foreign-born population - Cabo Verde (%)
Place of birth for the foreign-born population - Ghana (%)
Place of birth for the foreign-born population - Liberia (%)
Place of birth for the foreign-born population - Nigeria (%)
Place of birth for the foreign-born population - Senegal (%)
Place of birth for the foreign-born population - Sierra Leone (%)
Place of birth for the foreign-born population - Other Western Africa (%)
Place of birth for the foreign-born population - Australia (%)
Place of birth for the foreign-born population - New Zealand (%)
Place of birth for the foreign-born population - Fiji (%)
Place of birth for the foreign-born population - Micronesia (%)
Place of birth for the foreign-born population - Bahamas (%)
Place of birth for the foreign-born population - Barbados (%)
Place of birth for the foreign-born population - Cuba (%)
Place of birth for the foreign-born population - Dominica (%)
Place of birth for the foreign-born population - Dominican Republic (%)
Place of birth for the foreign-born population - Grenada (%)
Place of birth for the foreign-born population - Haiti (%)
Place of birth for the foreign-born population - Jamaica (%)
Place of birth for the foreign-born population - St. Vincent and the Grenadines (%)
Place of birth for the foreign-born population - Trinidad and Tobago (%)
Place of birth for the foreign-born population - West Indies (%)
Place of birth for the foreign-born population - Other Caribbean (%)
Place of birth for the foreign-born population - Belize (%)
Place of birth for the foreign-born population - Costa Rica (%)
Place of birth for the foreign-born population - El Salvador (%)
Place of birth for the foreign-born population - Guatemala (%)
Place of birth for the foreign-born population - Honduras (%)
Place of birth for the foreign-born population - Mexico (%)
Place of birth for the foreign-born population - Nicaragua (%)
Place of birth for the foreign-born population - Panama (%)
Place of birth for the foreign-born population - Other Central America (%)
Place of birth for the foreign-born population - Argentina (%)
Place of birth for the foreign-born population - Bolivia (%)
Place of birth for the foreign-born population - Brazil (%)
Place of birth for the foreign-born population - Chile (%)
Place of birth for the foreign-born population - Colombia (%)
Place of birth for the foreign-born population - Ecuador (%)
Place of birth for the foreign-born population - Guyana (%)
Place of birth for the foreign-born population - Peru (%)
Place of birth for the foreign-born population - Uruguay (%)
Place of birth for the foreign-born population - Venezuela (%)
Place of birth for the foreign-born population - Other South America (%)
Place of birth for the foreign-born population - Canada (%)
Place of birth for the foreign-born population - Other Northern America (%)
Place of birth for the foreign-born population - Other (%)
Latest news about races in Cohoes, NY collected exclusively by city-data.com from local newspapers, TV, and radio stations
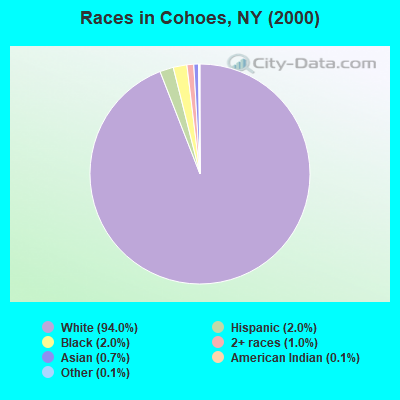
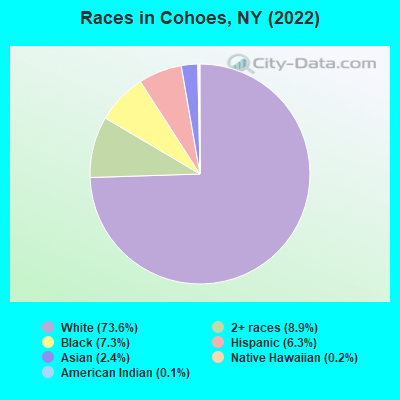
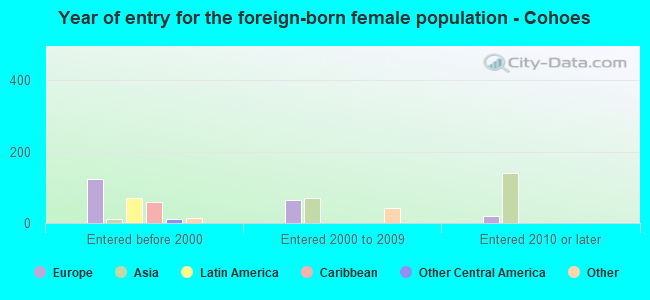
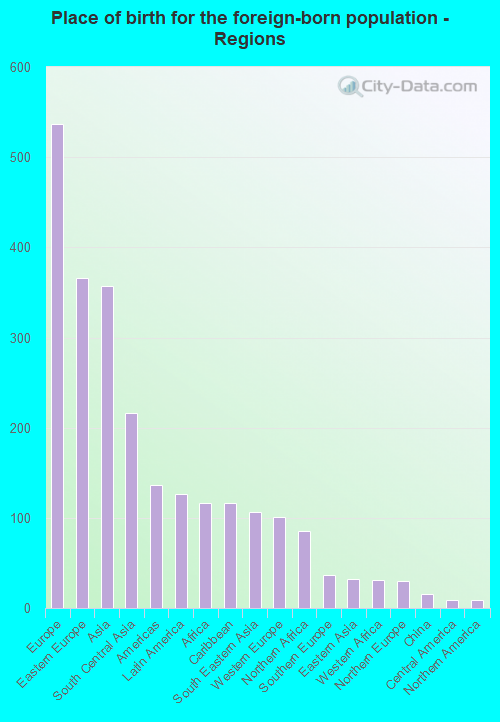
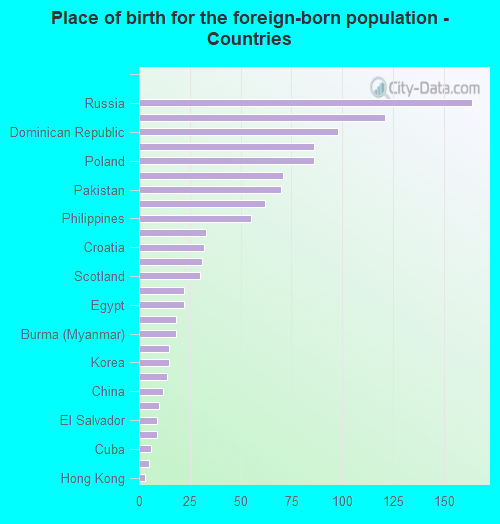
According to 2022 data, the most numerous races in Cohoes, NY are White alone (13,257 residents), Hispanic (1,129 residents), and Black alone (1,316 residents). 92.0% of Cohoes residents speak English at home. 6.4% of Cohoes, NY residents are foreign-born (3.0% born in Europe, 2.0% born in Asia, 0.7% born in Latin America, 0.7% born in Africa), which is 245.3% less than the foreign-born rate of 22.0% across the entire state of New York.
Race distribution in Cohoes
2000 2022
11,760,981 62.0% White alone 2,867,583 15.1% Hispanic 2,812,623 14.8% Black alone 1,035,926 5.5% Asian alone 366,116 1.9% Two or more races 75,499 0.4% Other race alone 52,499 0.3% American Indian alone 5,230 0.03% Native Hawaiian and Other
10,408,933 52.9% White alone 3,867,299 19.7% Hispanic 2,633,840 13.4% Black alone 1,776,286 9.0% Asian alone 732,670 3.7% Two or more races 216,110 1.1% Other race alone 35,082 0.2% American Indian alone 6,931 0.04% Native Hawaiian and Other
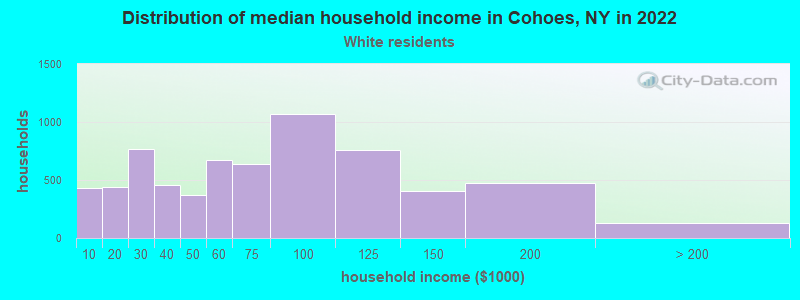
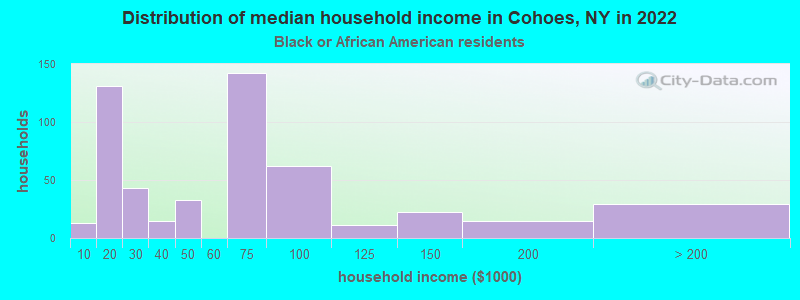
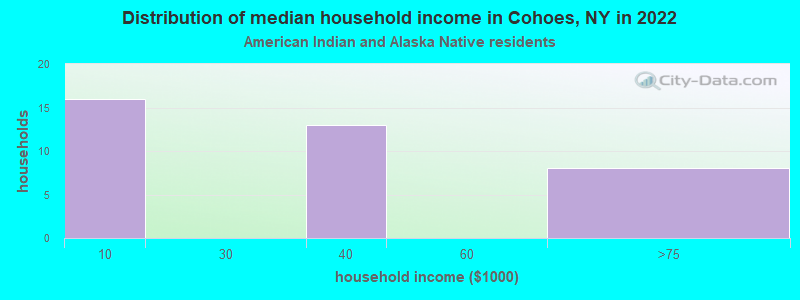
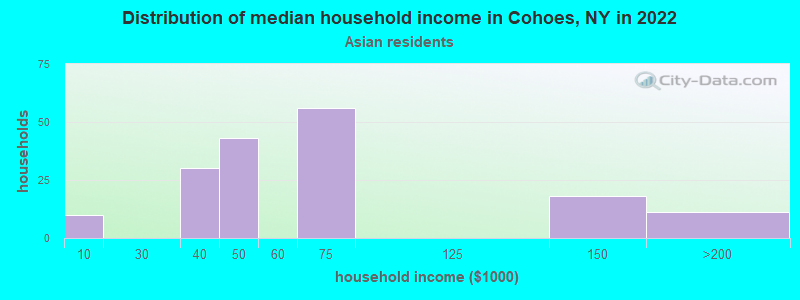
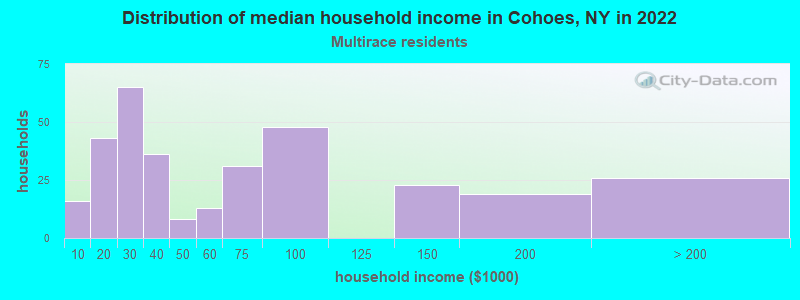
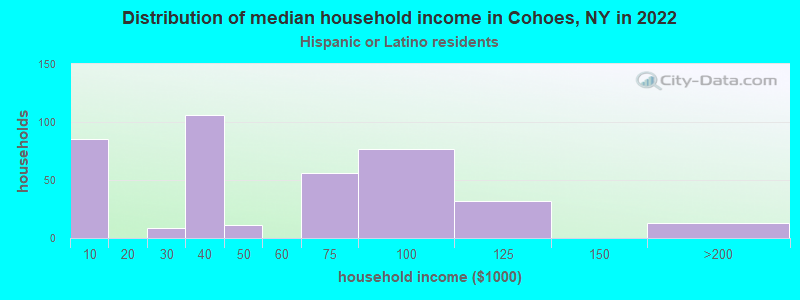
Income and house value in Cohoes Median household income in 2022 $61,426 White non-Hispanic householders$61,708 Black householders$44,203 Asian householders$45,390 Two or more races householders$51,268 Hispanic or Latino race householdersMedian 2022 house value $203,983 White Non-Hispanic householders$222,997 Black or African American householders$645,518 Two or more races householders$132,155 Hispanic or Latino householders
Median age by race in Cohoes
44.0 Median age for White residents43.0 45.2 30.7 Median age for Black or African American residents15.0 35.6 53.1 Median age for American Indian / Alaska Native residents-645,669,290.7 24.8 23.4 Median age for Asian residents35.5 22.9 -487,992,314.6 Median age for Native Hawaiian / Pacific Islander residents-477,502,295.2 -497,387,669.3 59.5 Median age for Other race residents-663,900,414.3 53.8 16.1 Median age for Two or more races residents28.7 12.4 44.5 Median age for White alone residents43.4 47.9 23.6 Median age for Hispanic or Latino residents18.5 24.8
Owner/renter occupied households by race in Cohoes
House owners and renters - White residents 2,963 44.1% Owner occupied3,757 55.9% Renter occupiedHouse owners and renters - Black or African American residents 75 13.1% Owner occupied500 86.9% Renter occupiedHouse owners and renters - American Indian / Alaska Native residents 31 100.0% Renter occupiedHouse owners and renters - Asian residents 38 26.2% Owner occupied108 73.8% Renter occupiedHouse owners and renters - Native Hawaiian / Pacific Islander residents 28 100.0% Renter occupiedHouse owners and renters - Other race residents 23 100.0% Renter occupiedHouse owners and renters - Two or more races residents 106 31.5% Owner occupied230 68.5% Renter occupiedHouse owners and renters - White alone residents 2,928 44.4% Owner occupied3,668 55.6% Renter occupiedHouse owners and renters - Hispanic or Latino residents 67 17.2% Owner occupied321 82.8% Renter occupied
Language usage in Cohoes
English speakers - Total 92.0% of residents of Cohoes speak English at home.
2.6% of residents speak Spanish at home 402 91.6% Speak English very well37 8.4% Speak English less than very well5.4% of residents speak other language at home 609 66.0% Speak English very well314 34.0% Speak English less than very well
English speakers - Born in the United States 97.1% of residents of Cohoes speak English at home.
English speakers - Native, born elsewhere 53.7% of residents of Cohoes speak English at home.
38.2% of residents speak Spanish at home 23 48.9% Speak English very well24 51.1% Speak English less than very well
English speakers - Foreign-born 32.6% of residents of Cohoes speak English at home.
6.6% of residents speak Spanish at home 65 90.3% Speak English very well7 9.7% Speak English less than very well60.3% of residents speak other language at home 361 55.3% Speak English very well292 44.7% Speak English less than very well
White (Caucasian) - Speak only English Native:
97.7% (12,214)Foreign-born:
37.8% (226)
White (Caucasian) - Speak another language Native:
2.4% (295)Foreign-born:
63.6% (380)
Black or African American - Speak only English Native:
85.3% (1,143)Foreign-born:
49.1% (63)
Black or African American - Speak another language Native:
16.3% (218)Foreign-born:
97.7% (126)
American Indian / Alaska Native - Speak only English Native:
65.6% (29)Foreign-born:
64.1% (7)
Asian - Speak only English Native:
84.6% (36)Foreign-born:
2.1% (7)
Two or more races - Speak only English Native:
96.0% (1,696)Foreign-born:
100.0% (53)
White alone - Speak only English Native:
98.0% (12,079)Foreign-born:
36.0% (234)
White alone - Speak another language Native:
1.9% (240)Foreign-born:
64.6% (420)
Hispanic or Latino - Speak only English Native:
71.8% (618)Foreign-born:
46.9% (46)
Hispanic or Latino - Speak another language Native:
28.3% (244)Foreign-born:
68.1% (66)
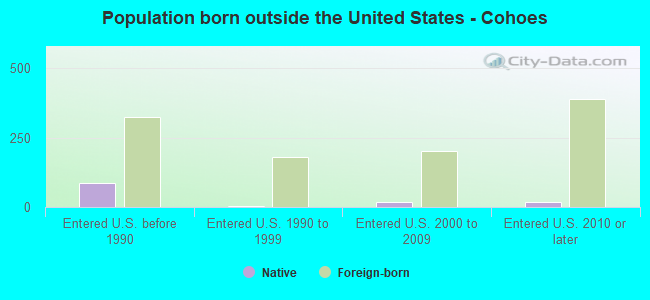
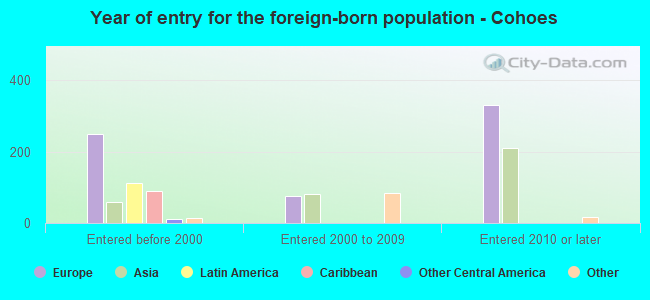
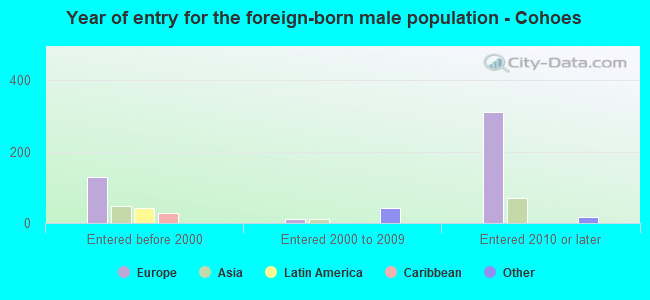
Foreign-born residents in Cohoes 1,147 residents are foreign born (3.0% Europe , 2.0% Asia , 0.7% Latin America , 0.7% Africa ).
This city:
6.4%New York:
22.6%
Marital status for residents in Cohoes Marital status - White (Caucasian) population 15 years and over
Males 47.9% Never married36.9% Now married1.1% Separated3.8% Widowed10.3% DivorcedFemales 36.5% Never married34.3% Now married1.3% Separated12.2% Widowed15.8% DivorcedWomen who gave birth in the past 12 months Now married:
42.5% (68)Unmarried:
57.5% (92)
Women who did not give birth in the past 12 months Now married:
29.3% (851)Unmarried:
70.7% (2,053)
Marital status - Black or African American population 15 years and over
Males 57.9% Never married32.4% Now married0.0% Separated0.0% Widowed9.7% DivorcedFemales 64.1% Never married15.0% Now married2.2% Separated4.9% Widowed13.9% DivorcedWomen who did not give birth in the past 12 months Now married:
13.4% (64)Unmarried:
86.6% (411)
Marital status - American Indian / Alaska Native population 15 years and over
Males 0.0% Never married0.0% Now married0.0% Separated0.0% Widowed100.0% DivorcedFemales 69.6% Never married0.0% Now married0.0% Separated0.0% Widowed30.4% DivorcedWomen who did not give birth in the past 12 months Now married:
0.0% (0)Unmarried:
100.0% (23)
Marital status - Asian population 15 years and over
Males 15.4% Never married61.8% Now married0.0% Separated0.0% Widowed22.8% DivorcedFemales 56.2% Never married33.3% Now married0.0% Separated10.5% Widowed0.0% DivorcedWomen who did not give birth in the past 12 months Now married:
37.2% (73)Unmarried:
62.8% (123)
Marital status - Other race population 15 years and over
Males 0.0% Never married100.0% Now married0.0% Separated0.0% Widowed0.0% DivorcedFemales 42.9% Never married17.9% Now married0.0% Separated39.3% Widowed0.0% DivorcedWomen who did not give birth in the past 12 months Now married:
0.0% (0)Unmarried:
100.0% (13)
Marital status - Two or more races population 15 years and over
Males 53.0% Never married39.6% Now married0.0% Separated0.0% Widowed7.4% DivorcedFemales 72.5% Never married20.3% Now married0.0% Separated2.0% Widowed5.2% DivorcedWomen who gave birth in the past 12 months Now married:
100.0% (18)Unmarried:
0.0% (0)
Women who did not give birth in the past 12 months Now married:
18.2% (106)Unmarried:
81.8% (476)
Marital status - White alone, not Hispanic / Latino population 15 years and over
Males 47.0% Never married37.4% Now married1.1% Separated3.9% Widowed10.5% DivorcedFemales 35.4% Never married34.7% Now married1.3% Separated12.5% Widowed16.1% DivorcedWomen who gave birth in the past 12 months Now married:
42.5% (69)Unmarried:
57.5% (93)
Women who did not give birth in the past 12 months Now married:
29.7% (852)Unmarried:
70.3% (2,013)
Marital status - Hispanic or Latino population 15 years and over
Males 65.8% Never married26.7% Now married0.0% Separated0.0% Widowed7.5% DivorcedFemales 60.1% Never married12.7% Now married0.0% Separated3.0% Widowed24.3% DivorcedWomen who did not give birth in the past 12 months Now married:
9.1% (30)Unmarried:
90.9% (301)
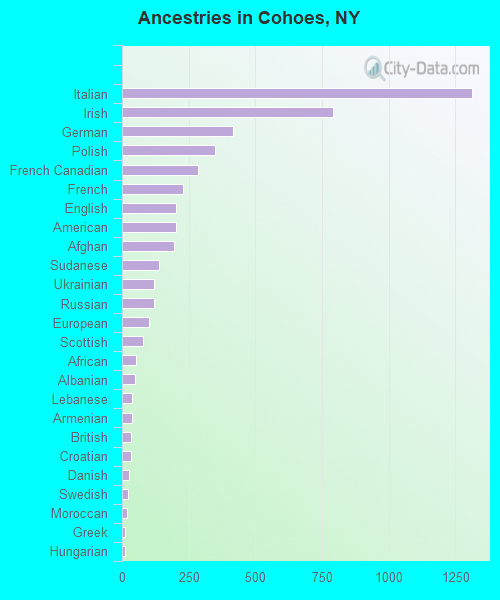
Ancestries in Cohoes
1,311 19.9% Italian790 12.0% Irish415 6.3% German347 5.3% Polish286 4.3% French Canadian230 3.5% French204 3.1% English201 3.0% American195 3.0% Afghan137 2.1% Sudanese120 1.8% Ukrainian119 1.8% Russian101 1.5% European78 1.2% Scottish51 0.8% African49 0.7% Albanian38 0.6% Lebanese38 0.6% Armenian33 0.5% British32 0.5% Croatian25 0.4% Danish23 0.3% Swedish18 0.3% Moroccan13 0.2% Greek13 0.2% Hungarian12 0.2% Syrian10 0.2% Jamaican9 0.1% Canadian8 0.1% Slovak4 0.06% Dutch3 0.05% Austrian
Geographical mobility in Cohoes Same house 1 year ago 11,364 84.9% White (Caucasian)1,411 92.4% Black or African American70 100.0% American Indian / Alaska Native243 62.5% Asian37 72.0% Other race1,726 85.9% Two or more races11,098 84.4% White alone, not Hispanic / Latino1,042 94.7% Hispanic or LatinoMoved within same county 561 4.2% White / Caucasian10 0.7% Black or African American225 57.7% Asian78 3.9% Two or more races583 4.4% White alone, not Hispanic / Latino33 3.0% Hispanic or LatinoMoved within same state 1,542 11.5% White / Caucasian129 8.5% Black or African American14 47.4% Native Hawaiian / Pacific Islander16 31.0% Other race107 5.3% Two or more races1,595 12.1% White alone, not Hispanic / Latino37 3.4% Hispanic or LatinoMoved from different state 159 1.2% White / Caucasian51 2.5% Two or more races150 1.1% White alone, not Hispanic / Latino9 0.8% Hispanic or LatinoMoved from abroad 44 2.9% Black or African American
Children Nativity (place of birth) in Cohoes
Children under 6 years - Living with two parents Both parents native 187 100.0% NativeBoth parents foreign-born 33 47.4% Native37 52.6% Foreign-bornOne native, one foreign-born parent 138 100.0% NativeChildren under 6 years - Living with one parent Native parent 532 100.0% NativeChildren 6 to 17 years - Living with two parents Both parents native 769 100.0% NativeBoth parents foreign-born 78 65.7% Native41 34.3% Foreign-bornChildren 6 to 17 years - Living with one parent Native parent 1,174 100.0% NativeForeign-born parent 61 46.7% Native70 53.3% Foreign-born
Grandparents responsible for own grandchildren in Cohoes
Grandparents (30 to 59 years) White / Caucasian 30 44.2% Responsible for grandchildren38 55.8% Not responsible for grandchildrenTwo or more races 98 100.0% Responsible for grandchildrenWhite alone, not Hispanic / Latino 32 41.7% Responsible for grandchildren44 58.3% Not responsible for grandchildrenGrandparents (60 years and over) White / Caucasian 41 51.2% Responsible for grandchildren39 48.8% Not responsible for grandchildrenTwo or more races 11 100.0% Not responsible for grandchildrenWhite alone, not Hispanic / Latino 44 51.4% Responsible for grandchildren42 48.6% Not responsible for grandchildren