Races in Collingswood, New Jersey (NJ) Detailed Stats
Data:
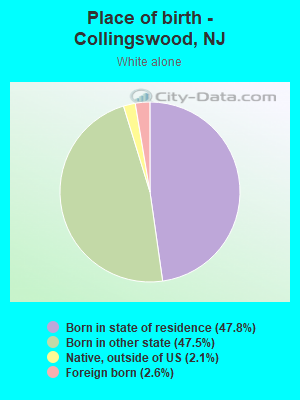
Races - White alone (%)
Races - White alone (% change since 2000)
Races - Black alone (%)
Races - Black alone (% change since 2000)
Races - American Indian alone (%)
Races - American Indian alone (% change since 2000)
Races - Asian alone (%)
Races - Asian alone (% change since 2000)
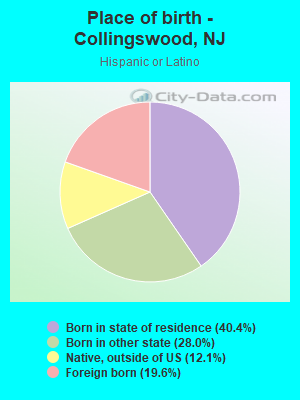
Races - Hispanic (%)
Races - Hispanic (% change since 2000)
Races - Native Hawaiian and Other Pacific Islander alone (%)
Races - Native Hawaiian and Other Pacific Islander alone (% change since 2000)
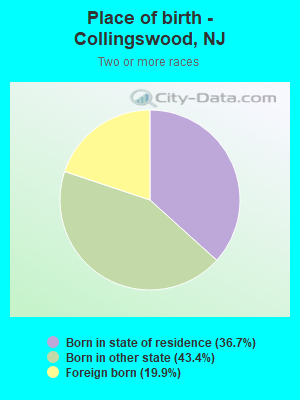
Races - Two or more races(%)
Races - Two or more races(% change since 2000)
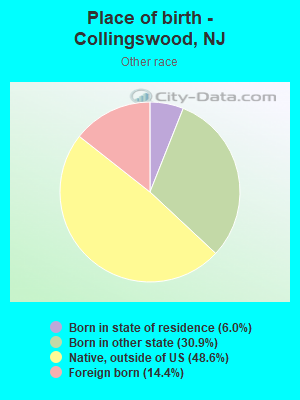
Races - Other race alone (%)
Races - Other race alone (% change since 2000)
Racial diversity
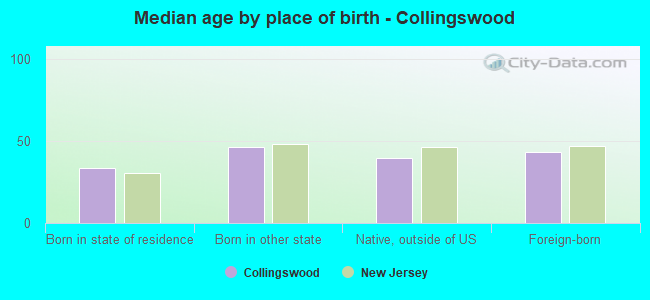
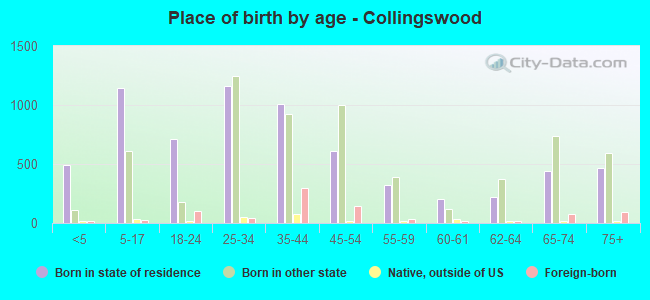
Place of birth - Born in state of residence (%)
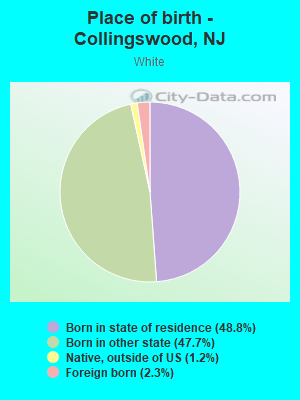
Place of birth - Born in state of residence (%) - White
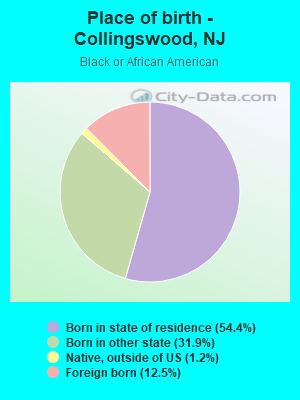
Place of birth - Born in state of residence (%) - Black or African American
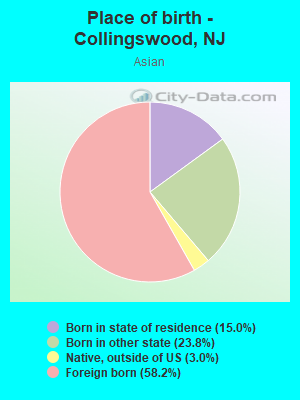
Place of birth - Born in state of residence (%) - Asian
Place of birth - Born in state of residence (%) - Hispanic or Latino
Place of birth - Born in state of residence (%) - American Indian and Alaska Native
Place of birth - Born in state of residence (%) - Multirace
Place of birth - Born in state of residence (%) - Other Race
Place of birth - Born in other state (%)
Place of birth - Born in other state (%) - White
Place of birth - Born in other state (%) - Black or African American
Place of birth - Born in other state (%) - Asian
Place of birth - Born in other state (%) - Hispanic or Latino
Place of birth - Born in other state (%) - American Indian and Alaska Native
Place of birth - Born in other state (%) - Multirace
Place of birth - Born in other state (%) - Other Race
Place of birth - Native, outside of US (%)
Place of birth - Native, outside of US (%) - White
Place of birth - Native, outside of US (%) - Black or African American
Place of birth - Native, outside of US (%) - Asian
Place of birth - Native, outside of US (%) - Hispanic or Latino
Place of birth - Native, outside of US (%) - American Indian and Alaska Native
Place of birth - Native, outside of US (%) - Multirace
Place of birth - Native, outside of US (%) - Other Race
Place of birth - Foreign born (%)
Place of birth - Foreign born (%) - White
Place of birth - Foreign born (%) - Black or African American
Place of birth - Foreign born (%) - Asian
Place of birth - Foreign born (%) - Hispanic or Latino
Place of birth - Foreign born (%) - American Indian and Alaska Native
Place of birth - Foreign born (%) - Multirace
Place of birth - Foreign born (%) - Other Race
Residents speaking English at home (%)
Residents speaking English at home - Born in the United States (%)
Residents speaking English at home - Native, born elsewhere (%)
Residents speaking English at home - Foreign born (%)
Residents speaking Spanish at home (%)
Residents speaking Spanish at home - Born in the United States (%)
Residents speaking Spanish at home - Native, born elsewhere (%)
Residents speaking Spanish at home - Foreign born (%)
Residents speaking other language at home (%)
Residents speaking other language at home - Born in the United States (%)
Residents speaking other language at home - Native, born elsewhere (%)
Residents speaking other language at home - Foreign born (%)
Marital status - Never married (%)
Marital status - Now married (%)
Marital status - Separated (%)
Marital status - Widowed (%)
Marital status - Divorced (%)
Ancestries Reported - Arab (%)
Ancestries Reported - Czech (%)
Ancestries Reported - Danish (%)
Ancestries Reported - Dutch (%)
Ancestries Reported - English (%)
Ancestries Reported - French (%)
Ancestries Reported - French Canadian (%)
Ancestries Reported - German (%)
Ancestries Reported - Greek (%)
Ancestries Reported - Hungarian (%)
Ancestries Reported - Irish (%)
Ancestries Reported - Italian (%)
Ancestries Reported - Lithuanian (%)
Ancestries Reported - Norwegian (%)
Ancestries Reported - Polish (%)
Ancestries Reported - Portuguese (%)
Ancestries Reported - Russian (%)
Ancestries Reported - Scotch-Irish (%)
Ancestries Reported - Scottish (%)
Ancestries Reported - Slovak (%)
Ancestries Reported - Subsaharan African (%)
Ancestries Reported - Swedish (%)
Ancestries Reported - Swiss (%)
Ancestries Reported - Ukrainian (%)
Ancestries Reported - United States (%)
Ancestries Reported - Welsh (%)
Ancestries Reported - West Indian (%)
Ancestries Reported - Other (%)
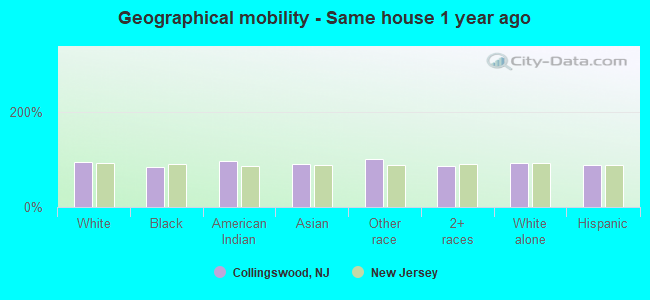
Geographical mobility - Same house 1 year ago (%)
Geographical mobility - Same house 1 year ago (%) - White
Geographical mobility - Same house 1 year ago (%) - Black or African American
Geographical mobility - Same house 1 year ago (%) - Asian
Geographical mobility - Same house 1 year ago (%) - Hispanic or Latino
Geographical mobility - Same house 1 year ago (%) - American Indian and Alaska Native
Geographical mobility - Same house 1 year ago (%) - Multirace
Geographical mobility - Same house 1 year ago (%) - Other Race
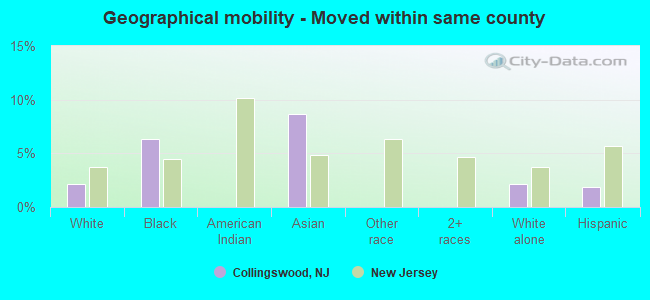
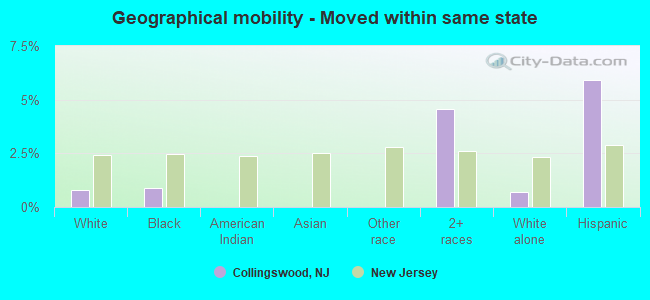
Geographical mobility - Moved within same county (%)
Geographical mobility - Moved within same county (%) - White
Geographical mobility - Moved within same county (%) - Black or African American
Geographical mobility - Moved within same county (%) - Asian
Geographical mobility - Moved within same county (%) - Hispanic or Latino
Geographical mobility - Moved within same county (%) - American Indian and Alaska Native
Geographical mobility - Moved within same county (%) - Multirace
Geographical mobility - Moved within same county (%) - Other Race
Geographical mobility - Moved from different county within same state (%)
Geographical mobility - Moved from different county within same state (%) - White
Geographical mobility - Moved from different county within same state (%) - Black or African American
Geographical mobility - Moved from different county within same state (%) - Asian
Geographical mobility - Moved from different county within same state (%) - Hispanic or Latino
Geographical mobility - Moved from different county within same state (%) - American Indian and Alaska Native
Geographical mobility - Moved from different county within same state (%) - Multirace
Geographical mobility - Moved from different county within same state (%) - Other Race
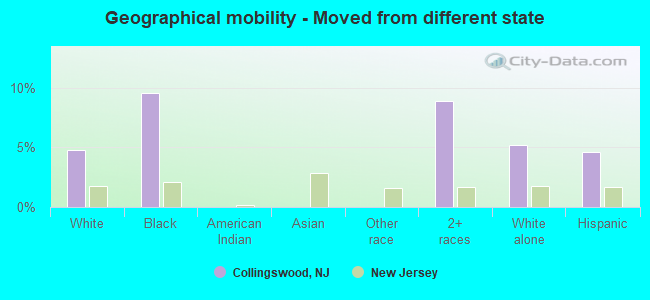
Geographical mobility - Moved from different state (%)
Geographical mobility - Moved from different state (%) - White
Geographical mobility - Moved from different state (%) - Black or African American
Geographical mobility - Moved from different state (%) - Asian
Geographical mobility - Moved from different state (%) - Hispanic or Latino
Geographical mobility - Moved from different state (%) - American Indian and Alaska Native
Geographical mobility - Moved from different state (%) - Multirace
Geographical mobility - Moved from different state (%) - Other Race
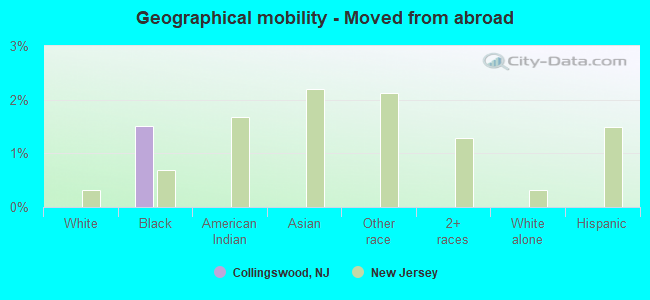
Geographical mobility - Moved from abroad (%)
Geographical mobility - Moved from abroad (%) - White
Geographical mobility - Moved from abroad (%) - Black or African American
Geographical mobility - Moved from abroad (%) - Asian
Geographical mobility - Moved from abroad (%) - Hispanic or Latino
Geographical mobility - Moved from abroad (%) - American Indian and Alaska Native
Geographical mobility - Moved from abroad (%) - Multirace
Geographical mobility - Moved from abroad (%) - Other Race
Place of birth for the foreign-born population - Ireland (%)
Place of birth for the foreign-born population - Denmark (%)
Place of birth for the foreign-born population - Norway (%)
Place of birth for the foreign-born population - Sweden (%)
Place of birth for the foreign-born population - United Kingdom (%)
Place of birth for the foreign-born population - England (%)
Place of birth for the foreign-born population - Scotland (%)
Place of birth for the foreign-born population - Other Northern Europe (%)
Place of birth for the foreign-born population - Austria (%)
Place of birth for the foreign-born population - Belgium (%)
Place of birth for the foreign-born population - France (%)
Place of birth for the foreign-born population - Germany (%)
Place of birth for the foreign-born population - Netherlands (%)
Place of birth for the foreign-born population - Switzerland (%)
Place of birth for the foreign-born population - Other Western Europe (%)
Place of birth for the foreign-born population - Greece (%)
Place of birth for the foreign-born population - Italy (%)
Place of birth for the foreign-born population - Portugal (%)
Place of birth for the foreign-born population - Spain (%)
Place of birth for the foreign-born population - Other Southern Europe (%)
Place of birth for the foreign-born population - Albania (%)
Place of birth for the foreign-born population - Belarus (%)
Place of birth for the foreign-born population - Bosnia and Herzegovina (%)
Place of birth for the foreign-born population - Bulgaria (%)
Place of birth for the foreign-born population - Croatia (%)
Place of birth for the foreign-born population - Czechoslovakia (%)
Place of birth for the foreign-born population - Hungary (%)
Place of birth for the foreign-born population - Latvia (%)
Place of birth for the foreign-born population - Lithuania (%)
Place of birth for the foreign-born population - North Macedonia (Macedonia) (%)
Place of birth for the foreign-born population - Moldova (%)
Place of birth for the foreign-born population - Poland (%)
Place of birth for the foreign-born population - Romania (%)
Place of birth for the foreign-born population - Russia (%)
Place of birth for the foreign-born population - Serbia (%)
Place of birth for the foreign-born population - Ukraine (%)
Place of birth for the foreign-born population - Other Eastern Europe (%)
Place of birth for the foreign-born population - China (%)
Place of birth for the foreign-born population - Hong Kong (%)
Place of birth for the foreign-born population - Taiwan (%)
Place of birth for the foreign-born population - Japan (%)
Place of birth for the foreign-born population - Korea (%)
Place of birth for the foreign-born population - Other Eastern Asia (%)
Place of birth for the foreign-born population - Afghanistan (%)
Place of birth for the foreign-born population - Bangladesh (%)
Place of birth for the foreign-born population - India (%)
Place of birth for the foreign-born population - Iran (%)
Place of birth for the foreign-born population - Kazakhstan (%)
Place of birth for the foreign-born population - Nepal (%)
Place of birth for the foreign-born population - Pakistan (%)
Place of birth for the foreign-born population - Sri Lanka (%)
Place of birth for the foreign-born population - Uzbekistan (%)
Place of birth for the foreign-born population - Other South Central Asia (%)
Place of birth for the foreign-born population - Burma (%)
Place of birth for the foreign-born population - Cambodia (%)
Place of birth for the foreign-born population - Indonesia (%)
Place of birth for the foreign-born population - Laos (%)
Place of birth for the foreign-born population - Malaysia (%)
Place of birth for the foreign-born population - Philippines (%)
Place of birth for the foreign-born population - Singapore (%)
Place of birth for the foreign-born population - Thailand (%)
Place of birth for the foreign-born population - Vietnam (%)
Place of birth for the foreign-born population - Other South Eastern Asia (%)
Place of birth for the foreign-born population - Armenia (%)
Place of birth for the foreign-born population - Iraq (%)
Place of birth for the foreign-born population - Israel (%)
Place of birth for the foreign-born population - Jordan (%)
Place of birth for the foreign-born population - Kuwait (%)
Place of birth for the foreign-born population - Lebanon (%)
Place of birth for the foreign-born population - Saudi Arabia (%)
Place of birth for the foreign-born population - Syria (%)
Place of birth for the foreign-born population - Turkey (%)
Place of birth for the foreign-born population - Yemen (%)
Place of birth for the foreign-born population - Other Western Asia (%)
Place of birth for the foreign-born population - Eritrea (%)
Place of birth for the foreign-born population - Ethiopia (%)
Place of birth for the foreign-born population - Kenya (%)
Place of birth for the foreign-born population - Somalia (%)
Place of birth for the foreign-born population - Uganda (%)
Place of birth for the foreign-born population - Zimbabwe (%)
Place of birth for the foreign-born population - Other Eastern Africa (%)
Place of birth for the foreign-born population - Cameroon (%)
Place of birth for the foreign-born population - Congo (%)
Place of birth for the foreign-born population - Democratic Republic of Congo (Zaire) (%)
Place of birth for the foreign-born population - Other Middle Africa (%)
Place of birth for the foreign-born population - Egypt (%)
Place of birth for the foreign-born population - Morocco (%)
Place of birth for the foreign-born population - Sudan (%)
Place of birth for the foreign-born population - Other Northern Africa (%)
Place of birth for the foreign-born population - South Africa (%)
Place of birth for the foreign-born population - Other Southern Africa (%)
Place of birth for the foreign-born population - Cabo Verde (%)
Place of birth for the foreign-born population - Ghana (%)
Place of birth for the foreign-born population - Liberia (%)
Place of birth for the foreign-born population - Nigeria (%)
Place of birth for the foreign-born population - Senegal (%)
Place of birth for the foreign-born population - Sierra Leone (%)
Place of birth for the foreign-born population - Other Western Africa (%)
Place of birth for the foreign-born population - Australia (%)
Place of birth for the foreign-born population - New Zealand (%)
Place of birth for the foreign-born population - Fiji (%)
Place of birth for the foreign-born population - Micronesia (%)
Place of birth for the foreign-born population - Bahamas (%)
Place of birth for the foreign-born population - Barbados (%)
Place of birth for the foreign-born population - Cuba (%)
Place of birth for the foreign-born population - Dominica (%)
Place of birth for the foreign-born population - Dominican Republic (%)
Place of birth for the foreign-born population - Grenada (%)
Place of birth for the foreign-born population - Haiti (%)
Place of birth for the foreign-born population - Jamaica (%)
Place of birth for the foreign-born population - St. Vincent and the Grenadines (%)
Place of birth for the foreign-born population - Trinidad and Tobago (%)
Place of birth for the foreign-born population - West Indies (%)
Place of birth for the foreign-born population - Other Caribbean (%)
Place of birth for the foreign-born population - Belize (%)
Place of birth for the foreign-born population - Costa Rica (%)
Place of birth for the foreign-born population - El Salvador (%)
Place of birth for the foreign-born population - Guatemala (%)
Place of birth for the foreign-born population - Honduras (%)
Place of birth for the foreign-born population - Mexico (%)
Place of birth for the foreign-born population - Nicaragua (%)
Place of birth for the foreign-born population - Panama (%)
Place of birth for the foreign-born population - Other Central America (%)
Place of birth for the foreign-born population - Argentina (%)
Place of birth for the foreign-born population - Bolivia (%)
Place of birth for the foreign-born population - Brazil (%)
Place of birth for the foreign-born population - Chile (%)
Place of birth for the foreign-born population - Colombia (%)
Place of birth for the foreign-born population - Ecuador (%)
Place of birth for the foreign-born population - Guyana (%)
Place of birth for the foreign-born population - Peru (%)
Place of birth for the foreign-born population - Uruguay (%)
Place of birth for the foreign-born population - Venezuela (%)
Place of birth for the foreign-born population - Other South America (%)
Place of birth for the foreign-born population - Canada (%)
Place of birth for the foreign-born population - Other Northern America (%)
Place of birth for the foreign-born population - Other (%)
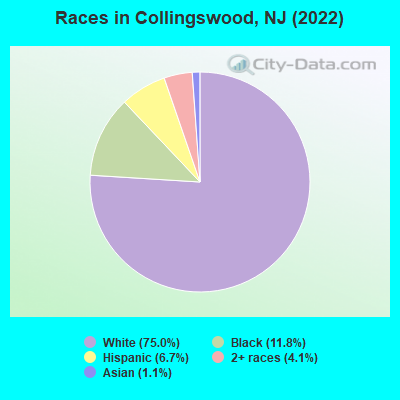
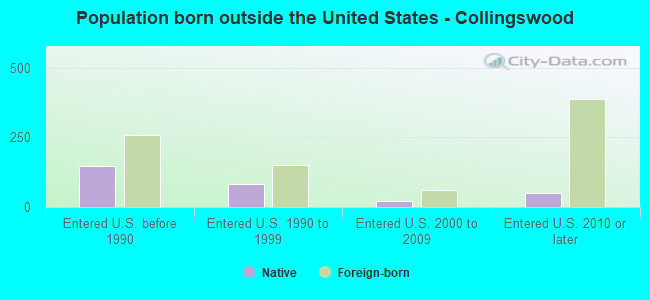
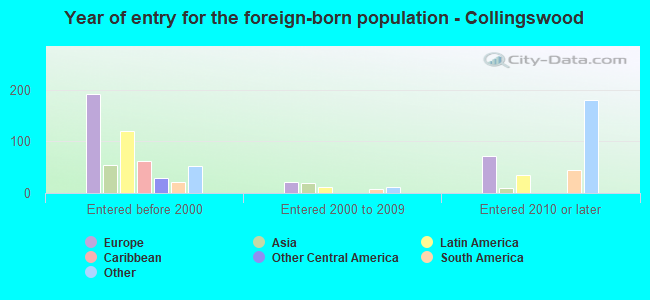
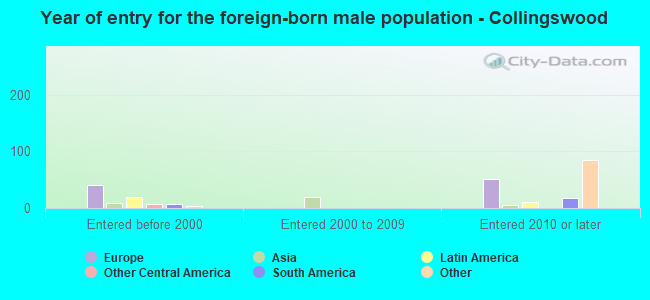
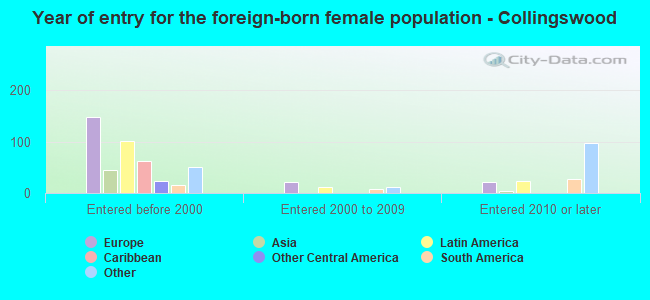
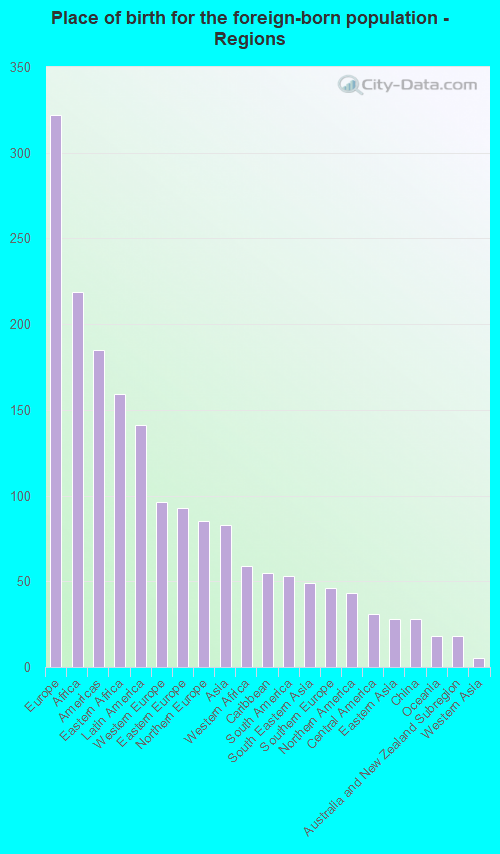
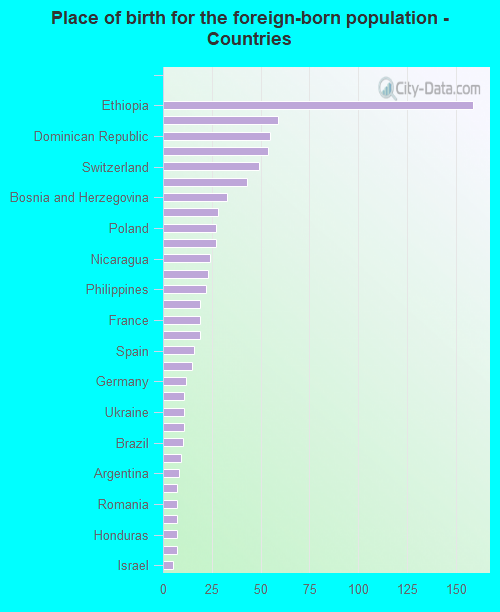
According to 2022 data, the most numerous races in Collingswood, NJ are White alone (10,649 residents), Hispanic (954 residents), and Black alone (1,676 residents). 86.8% of Collingswood residents speak English at home. 5.8% of Collingswood, NJ residents are foreign-born (2.2% born in Europe, 1.5% born in Africa, 1.0% born in Latin America), which is 294.4% less than the foreign-born rate of 23.0% across the entire state of New Jersey.
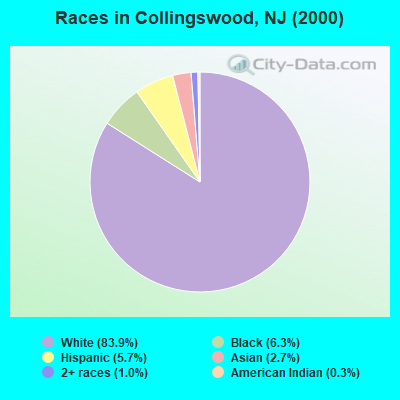
Race distribution in Collingswood
2000 2022
5,557,209 66.0% White alone 1,117,191 13.3% Hispanic 1,096,171 13.0% Black alone 477,012 5.7% Asian alone 133,689 1.6% Two or more races 19,565 0.2% Other race alone 11,338 0.1% American Indian alone 2,175 0.03% Native Hawaiian and Other
4,766,476 51.5% White alone 2,028,470 21.9% Hispanic 1,111,632 12.0% Black alone 923,546 10.0% Asian alone 332,237 3.6% Two or more races 89,847 1.0% Other race alone 8,557 0.09% American Indian alone 934 0.01% Native Hawaiian and Other
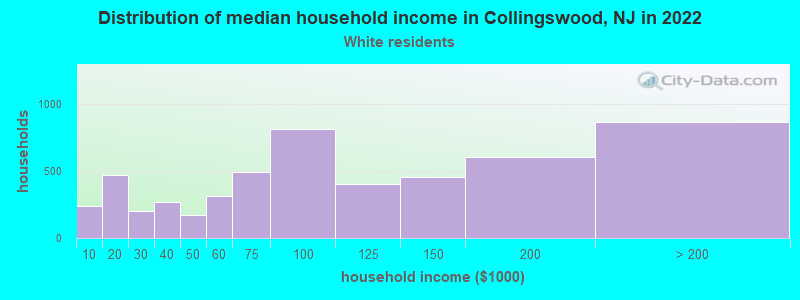
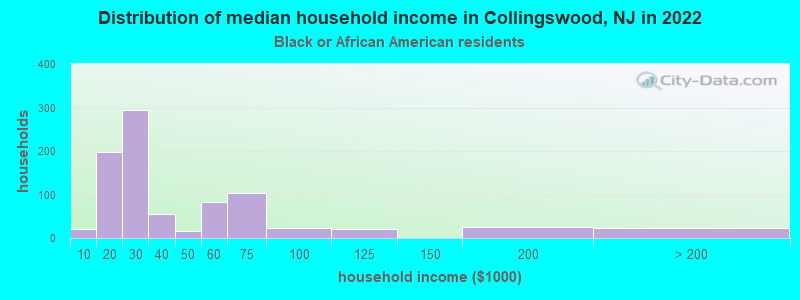
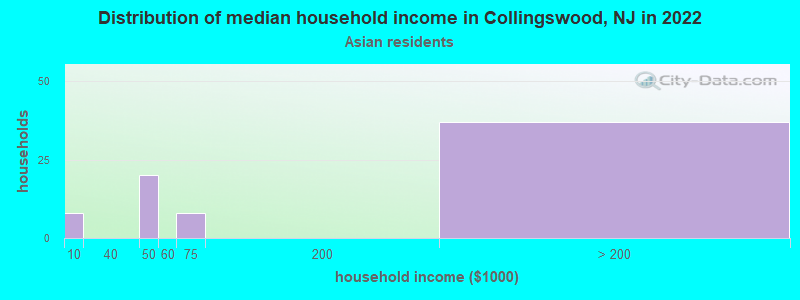
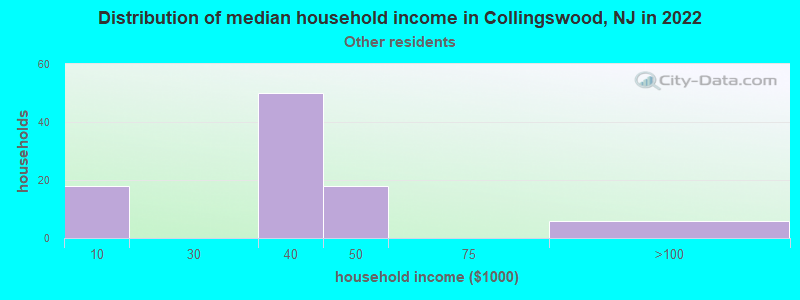
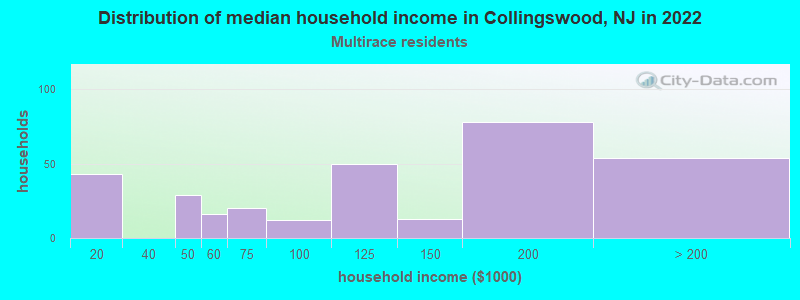
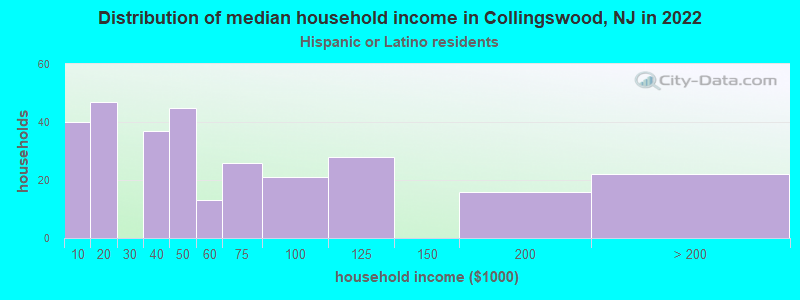
Income and house value in Collingswood Median household income in 2022 $88,402 White non-Hispanic householders$28,062 Black householders$38,213 Some other race householders$110,019 Two or more races householders$48,468 Hispanic or Latino race householdersMedian 2022 house value $354,576 White Non-Hispanic householders$354,920 Black or African American householders $270,579 Asian householders$167,305 Some other race householders$288,136 Two or more races householders$257,498 Hispanic or Latino householders
Median age by race in Collingswood
41.5 Median age for White residents41.0 42.3 30.6 Median age for Black or African American residents29.2 33.9 -676,272,813.9 Median age for American Indian / Alaska Native residents-670,465,336.5 -688,298,917.7 48.7 Median age for Asian residents36.9 49.8 -701,509,871.5 Median age for Native Hawaiian / Pacific Islander residents-860,335,194.7 -668,881,505.4 61.3 Median age for Other race residents59.9 59.7 41.3 Median age for Two or more races residents38.3 43.5 41.9 Median age for White alone residents41.0 43.8 36.6 Median age for Hispanic or Latino residents33.4 38.6
Owner/renter occupied households by race in Collingswood
House owners and renters - White residents 3,378 64.6% Owner occupied1,851 35.4% Renter occupiedHouse owners and renters - Black or African American residents 55 5.5% Owner occupied936 94.5% Renter occupiedHouse owners and renters - American Indian / Alaska Native residents 18 100.0% Renter occupiedHouse owners and renters - Asian residents 48 61.3% Owner occupied30 38.7% Renter occupiedHouse owners and renters - Other race residents 36 37.9% Owner occupied58 62.1% Renter occupiedHouse owners and renters - Two or more races residents 119 40.8% Owner occupied173 59.2% Renter occupiedHouse owners and renters - White alone residents 3,396 63.7% Owner occupied1,933 36.3% Renter occupiedHouse owners and renters - Hispanic or Latino residents 99 31.5% Owner occupied215 68.5% Renter occupied
Language usage in Collingswood
English speakers - Total 86.8% of residents of Collingswood speak English at home.
6.5% of residents speak Spanish at home 588 66.3% Speak English very well299 33.7% Speak English less than very well5.9% of residents speak other language at home 456 56.5% Speak English very well351 43.5% Speak English less than very well
English speakers - Born in the United States 92.4% of residents of Collingswood speak English at home.
3.9% of residents speak Spanish at home 191 79.9% Speak English very well48 20.1% Speak English less than very well4.1% of residents speak other language at home 123 49.6% Speak English very well125 50.4% Speak English less than very well
English speakers - Native, born elsewhere 54.3% of residents of Collingswood speak English at home.
41.2% of residents speak Spanish at home 75 63.0% Speak English very well44 37.0% Speak English less than very well4.8% of residents speak other language at home 14 100.0% Speak English very well
English speakers - Foreign-born 29.6% of residents of Collingswood speak English at home.
17.8% of residents speak Spanish at home 116 76.8% Speak English very well35 23.2% Speak English less than very well44.9% of residents speak other language at home 165 43.3% Speak English very well216 56.7% Speak English less than very well
White (Caucasian) - Speak only English Native:
93.6% (9,403)Foreign-born:
58.7% (144)
White (Caucasian) - Speak another language Native:
6.2% (622)Foreign-born:
40.0% (98)
Black or African American - Speak another language Native:
7.4% (105)Foreign-born:
86.6% (185)
Asian - Speak only English Native:
54.7% (39)Foreign-born:
37.3% (33)
Asian - Speak another language Native:
44.4% (32)Foreign-born:
67.0% (58)
Other race - Speak another language Native:
80.2% (142)Foreign-born:
99.7% (24)
Two or more races - Speak only English Native:
80.0% (574)Foreign-born:
7.0% (14)
Two or more races - Speak another language Native:
20.7% (149)Foreign-born:
90.6% (179)
White alone - Speak only English Native:
93.7% (9,299)Foreign-born:
58.7% (165)
White alone - Speak another language Native:
7.1% (707)Foreign-born:
38.0% (107)
Hispanic or Latino - Speak only English Native:
43.6% (309)Foreign-born:
8.0% (14)
Hispanic or Latino - Speak another language Native:
56.3% (399)Foreign-born:
91.1% (162)
Foreign-born residents in Collingswood 828 residents are foreign born (2.2% Europe , 1.5% Africa , 1.0% Latin America ).
This city:
5.8%New Jersey:
23.2%
Marital status for residents in Collingswood Marital status - White (Caucasian) population 15 years and over
Males 39.6% Never married49.8% Now married0.4% Separated1.0% Widowed9.2% DivorcedFemales 24.6% Never married48.1% Now married1.9% Separated13.5% Widowed11.9% DivorcedWomen who gave birth in the past 12 months Now married:
62.9% (36)Unmarried:
37.1% (21)
Women who did not give birth in the past 12 months Now married:
50.7% (1,290)Unmarried:
49.3% (1,255)
Marital status - Black or African American population 15 years and over
Males 64.5% Never married25.4% Now married0.0% Separated0.0% Widowed10.1% DivorcedFemales 56.0% Never married10.0% Now married6.7% Separated10.2% Widowed17.1% DivorcedWomen who did not give birth in the past 12 months Now married:
5.9% (31)Unmarried:
94.1% (494)
Marital status - Asian population 15 years and over
Males 54.5% Never married45.5% Now married0.0% Separated0.0% Widowed0.0% DivorcedFemales 20.5% Never married44.6% Now married0.0% Separated0.0% Widowed34.9% DivorcedWomen who did not give birth in the past 12 months Now married:
22.0% (11)Unmarried:
78.0% (40)
Marital status - Other race population 15 years and over
Males 50.0% Never married50.0% Now married0.0% Separated0.0% Widowed0.0% DivorcedFemales 19.8% Never married55.2% Now married0.0% Separated15.6% Widowed9.4% DivorcedWomen who did not give birth in the past 12 months Now married:
24.3% (10)Unmarried:
75.7% (31)
Marital status - Two or more races population 15 years and over
Males 42.2% Never married57.8% Now married0.0% Separated0.0% Widowed0.0% DivorcedFemales 44.2% Never married48.6% Now married0.0% Separated0.0% Widowed7.2% DivorcedWomen who did not give birth in the past 12 months Now married:
63.7% (140)Unmarried:
36.2% (79)
Marital status - White alone, not Hispanic / Latino population 15 years and over
Males 39.4% Never married50.2% Now married0.4% Separated1.0% Widowed9.1% DivorcedFemales 24.0% Never married48.3% Now married1.5% Separated14.0% Widowed12.2% DivorcedWomen who gave birth in the past 12 months Now married:
62.9% (38)Unmarried:
37.1% (22)
Women who did not give birth in the past 12 months Now married:
50.9% (1,265)Unmarried:
49.1% (1,220)
Marital status - Hispanic or Latino population 15 years and over
Males 42.5% Never married52.9% Now married0.0% Separated0.0% Widowed4.6% DivorcedFemales 39.3% Never married44.7% Now married4.8% Separated3.2% Widowed8.0% DivorcedWomen who did not give birth in the past 12 months Now married:
51.1% (145)Unmarried:
48.9% (139)
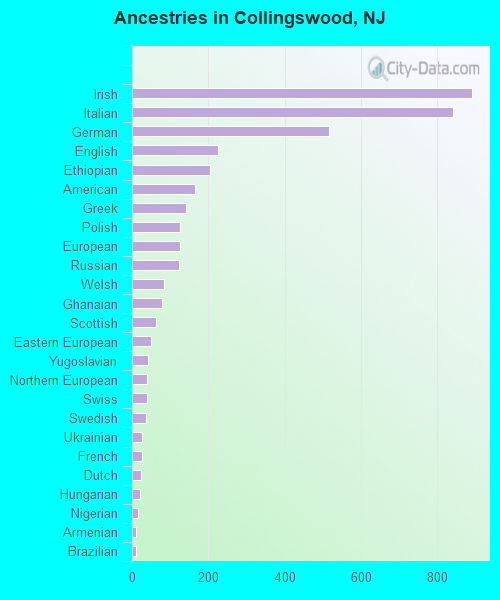
Ancestries in Collingswood
891 15.6% Irish842 14.8% Italian516 9.0% German226 4.0% English204 3.6% Ethiopian164 2.9% American142 2.5% Greek126 2.2% Polish125 2.2% European122 2.1% Russian84 1.5% Welsh78 1.4% Ghanaian64 1.1% Scottish50 0.9% Eastern European41 0.7% Yugoslavian40 0.7% Northern European39 0.7% Swiss37 0.6% Swedish27 0.5% Ukrainian25 0.4% French24 0.4% Dutch22 0.4% Hungarian17 0.3% Nigerian10 0.2% Armenian10 0.2% Brazilian8 0.1% Syrian8 0.1% Lithuanian7 0.1% Norwegian7 0.1% Romanian7 0.1% Scandinavian7 0.1% British6 0.1% Scotch-Irish5 0.09% Palestinian5 0.09% Celtic
Children Nativity (place of birth) in Collingswood
Children under 6 years - Living with two parents Both parents native 477 100.0% NativeBoth parents foreign-born 14 100.0% NativeOne native, one foreign-born parent 43 100.0% NativeChildren under 6 years - Living with one parent Native parent 138 100.0% NativeChildren 6 to 17 years - Living with two parents Both parents native 879 100.0% NativeBoth parents foreign-born 25 70.4% Native10 29.6% Foreign-bornOne native, one foreign-born parent 211 100.0% NativeChildren 6 to 17 years - Living with one parent Native parent 429 100.0% NativeForeign-born parent 12 51.5% Native11 48.5% Foreign-born
Grandparents responsible for own grandchildren in Collingswood
Grandparents (30 to 59 years) White / Caucasian 22 76.5% Responsible for grandchildren7 23.5% Not responsible for grandchildrenAsian 4 100.0% Responsible for grandchildrenWhite alone, not Hispanic / Latino 23 78.2% Responsible for grandchildren7 21.8% Not responsible for grandchildrenGrandparents (60 years and over) White / Caucasian 10 31.1% Responsible for grandchildren22 68.9% Not responsible for grandchildrenWhite alone, not Hispanic / Latino 10 29.0% Responsible for grandchildren25 71.0% Not responsible for grandchildren