Races in Colonial Park, Pennsylvania (PA) Detailed Stats
Data:
Races - White alone (%)
Races - White alone (% change since 2000)
Races - Black alone (%)
Races - Black alone (% change since 2000)
Races - American Indian alone (%)
Races - American Indian alone (% change since 2000)
Races - Asian alone (%)
Races - Asian alone (% change since 2000)
Races - Hispanic (%)
Races - Hispanic (% change since 2000)
Races - Native Hawaiian and Other Pacific Islander alone (%)
Races - Native Hawaiian and Other Pacific Islander alone (% change since 2000)
Races - Two or more races(%)
Races - Two or more races(% change since 2000)
Races - Other race alone (%)
Races - Other race alone (% change since 2000)
Racial diversity
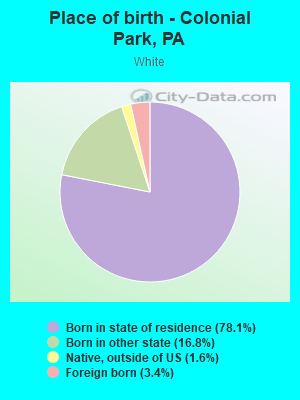
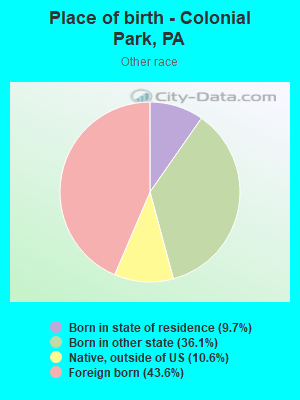
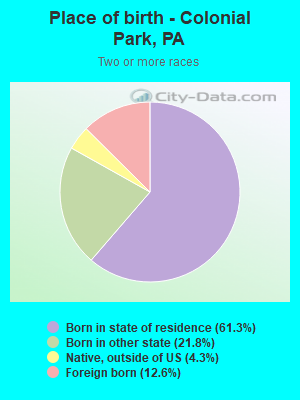
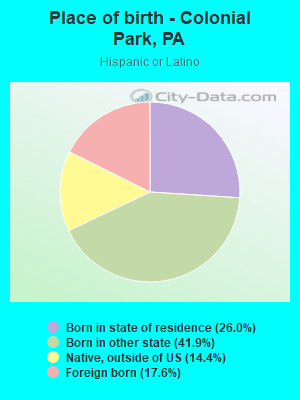
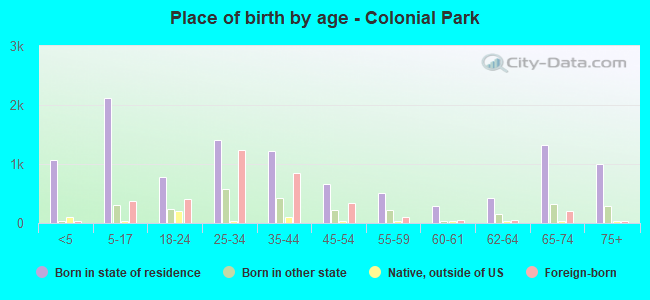
Place of birth - Born in state of residence (%)
Place of birth - Born in state of residence (%) - White
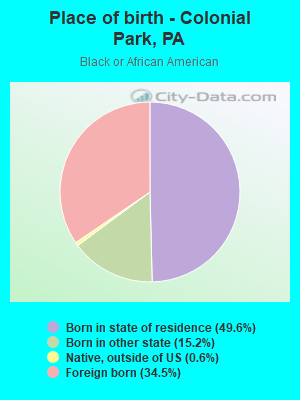
Place of birth - Born in state of residence (%) - Black or African American
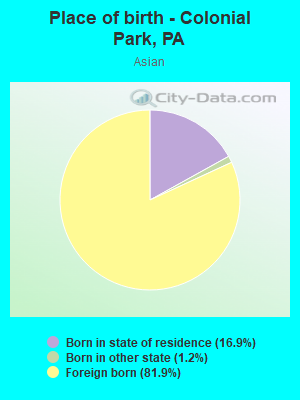
Place of birth - Born in state of residence (%) - Asian
Place of birth - Born in state of residence (%) - Hispanic or Latino
Place of birth - Born in state of residence (%) - American Indian and Alaska Native
Place of birth - Born in state of residence (%) - Multirace
Place of birth - Born in state of residence (%) - Other Race
Place of birth - Born in other state (%)
Place of birth - Born in other state (%) - White
Place of birth - Born in other state (%) - Black or African American
Place of birth - Born in other state (%) - Asian
Place of birth - Born in other state (%) - Hispanic or Latino
Place of birth - Born in other state (%) - American Indian and Alaska Native
Place of birth - Born in other state (%) - Multirace
Place of birth - Born in other state (%) - Other Race
Place of birth - Native, outside of US (%)
Place of birth - Native, outside of US (%) - White
Place of birth - Native, outside of US (%) - Black or African American
Place of birth - Native, outside of US (%) - Asian
Place of birth - Native, outside of US (%) - Hispanic or Latino
Place of birth - Native, outside of US (%) - American Indian and Alaska Native
Place of birth - Native, outside of US (%) - Multirace
Place of birth - Native, outside of US (%) - Other Race
Place of birth - Foreign born (%)
Place of birth - Foreign born (%) - White
Place of birth - Foreign born (%) - Black or African American
Place of birth - Foreign born (%) - Asian
Place of birth - Foreign born (%) - Hispanic or Latino
Place of birth - Foreign born (%) - American Indian and Alaska Native
Place of birth - Foreign born (%) - Multirace
Place of birth - Foreign born (%) - Other Race
Residents speaking English at home (%)
Residents speaking English at home - Born in the United States (%)
Residents speaking English at home - Native, born elsewhere (%)
Residents speaking English at home - Foreign born (%)
Residents speaking Spanish at home (%)
Residents speaking Spanish at home - Born in the United States (%)
Residents speaking Spanish at home - Native, born elsewhere (%)
Residents speaking Spanish at home - Foreign born (%)
Residents speaking other language at home (%)
Residents speaking other language at home - Born in the United States (%)
Residents speaking other language at home - Native, born elsewhere (%)
Residents speaking other language at home - Foreign born (%)
Marital status - Never married (%)
Marital status - Now married (%)
Marital status - Separated (%)
Marital status - Widowed (%)
Marital status - Divorced (%)
Ancestries Reported - Arab (%)
Ancestries Reported - Czech (%)
Ancestries Reported - Danish (%)
Ancestries Reported - Dutch (%)
Ancestries Reported - English (%)
Ancestries Reported - French (%)
Ancestries Reported - French Canadian (%)
Ancestries Reported - German (%)
Ancestries Reported - Greek (%)
Ancestries Reported - Hungarian (%)
Ancestries Reported - Irish (%)
Ancestries Reported - Italian (%)
Ancestries Reported - Lithuanian (%)
Ancestries Reported - Norwegian (%)
Ancestries Reported - Polish (%)
Ancestries Reported - Portuguese (%)
Ancestries Reported - Russian (%)
Ancestries Reported - Scotch-Irish (%)
Ancestries Reported - Scottish (%)
Ancestries Reported - Slovak (%)
Ancestries Reported - Subsaharan African (%)
Ancestries Reported - Swedish (%)
Ancestries Reported - Swiss (%)
Ancestries Reported - Ukrainian (%)
Ancestries Reported - United States (%)
Ancestries Reported - Welsh (%)
Ancestries Reported - West Indian (%)
Ancestries Reported - Other (%)
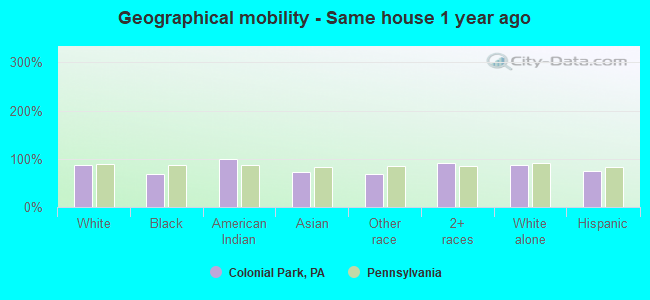
Geographical mobility - Same house 1 year ago (%)
Geographical mobility - Same house 1 year ago (%) - White
Geographical mobility - Same house 1 year ago (%) - Black or African American
Geographical mobility - Same house 1 year ago (%) - Asian
Geographical mobility - Same house 1 year ago (%) - Hispanic or Latino
Geographical mobility - Same house 1 year ago (%) - American Indian and Alaska Native
Geographical mobility - Same house 1 year ago (%) - Multirace
Geographical mobility - Same house 1 year ago (%) - Other Race
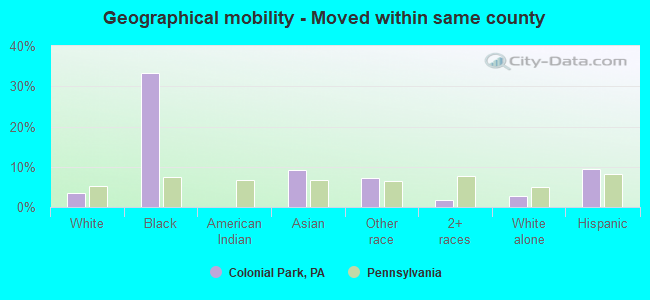
Geographical mobility - Moved within same county (%)
Geographical mobility - Moved within same county (%) - White
Geographical mobility - Moved within same county (%) - Black or African American
Geographical mobility - Moved within same county (%) - Asian
Geographical mobility - Moved within same county (%) - Hispanic or Latino
Geographical mobility - Moved within same county (%) - American Indian and Alaska Native
Geographical mobility - Moved within same county (%) - Multirace
Geographical mobility - Moved within same county (%) - Other Race
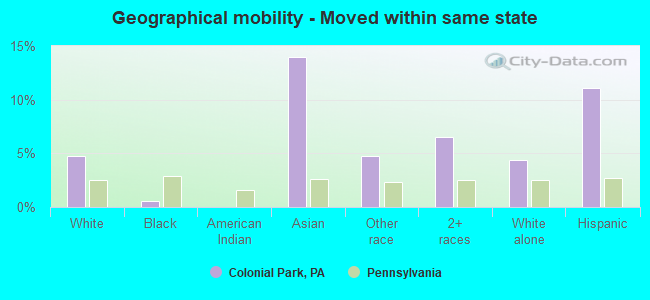
Geographical mobility - Moved from different county within same state (%)
Geographical mobility - Moved from different county within same state (%) - White
Geographical mobility - Moved from different county within same state (%) - Black or African American
Geographical mobility - Moved from different county within same state (%) - Asian
Geographical mobility - Moved from different county within same state (%) - Hispanic or Latino
Geographical mobility - Moved from different county within same state (%) - American Indian and Alaska Native
Geographical mobility - Moved from different county within same state (%) - Multirace
Geographical mobility - Moved from different county within same state (%) - Other Race
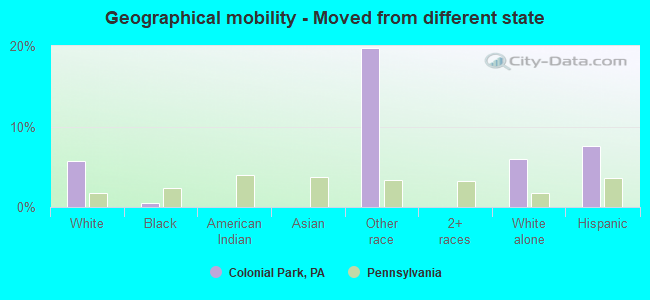
Geographical mobility - Moved from different state (%)
Geographical mobility - Moved from different state (%) - White
Geographical mobility - Moved from different state (%) - Black or African American
Geographical mobility - Moved from different state (%) - Asian
Geographical mobility - Moved from different state (%) - Hispanic or Latino
Geographical mobility - Moved from different state (%) - American Indian and Alaska Native
Geographical mobility - Moved from different state (%) - Multirace
Geographical mobility - Moved from different state (%) - Other Race
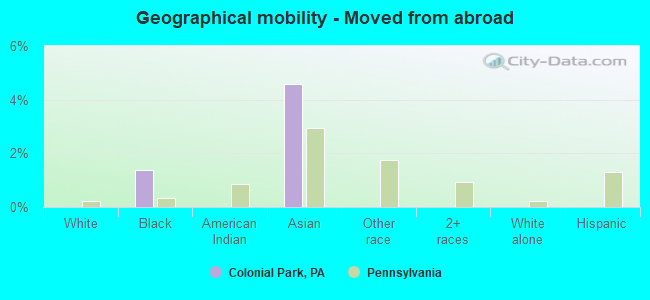
Geographical mobility - Moved from abroad (%)
Geographical mobility - Moved from abroad (%) - White
Geographical mobility - Moved from abroad (%) - Black or African American
Geographical mobility - Moved from abroad (%) - Asian
Geographical mobility - Moved from abroad (%) - Hispanic or Latino
Geographical mobility - Moved from abroad (%) - American Indian and Alaska Native
Geographical mobility - Moved from abroad (%) - Multirace
Geographical mobility - Moved from abroad (%) - Other Race
Place of birth for the foreign-born population - Ireland (%)
Place of birth for the foreign-born population - Denmark (%)
Place of birth for the foreign-born population - Norway (%)
Place of birth for the foreign-born population - Sweden (%)
Place of birth for the foreign-born population - United Kingdom (%)
Place of birth for the foreign-born population - England (%)
Place of birth for the foreign-born population - Scotland (%)
Place of birth for the foreign-born population - Other Northern Europe (%)
Place of birth for the foreign-born population - Austria (%)
Place of birth for the foreign-born population - Belgium (%)
Place of birth for the foreign-born population - France (%)
Place of birth for the foreign-born population - Germany (%)
Place of birth for the foreign-born population - Netherlands (%)
Place of birth for the foreign-born population - Switzerland (%)
Place of birth for the foreign-born population - Other Western Europe (%)
Place of birth for the foreign-born population - Greece (%)
Place of birth for the foreign-born population - Italy (%)
Place of birth for the foreign-born population - Portugal (%)
Place of birth for the foreign-born population - Spain (%)
Place of birth for the foreign-born population - Other Southern Europe (%)
Place of birth for the foreign-born population - Albania (%)
Place of birth for the foreign-born population - Belarus (%)
Place of birth for the foreign-born population - Bosnia and Herzegovina (%)
Place of birth for the foreign-born population - Bulgaria (%)
Place of birth for the foreign-born population - Croatia (%)
Place of birth for the foreign-born population - Czechoslovakia (%)
Place of birth for the foreign-born population - Hungary (%)
Place of birth for the foreign-born population - Latvia (%)
Place of birth for the foreign-born population - Lithuania (%)
Place of birth for the foreign-born population - North Macedonia (Macedonia) (%)
Place of birth for the foreign-born population - Moldova (%)
Place of birth for the foreign-born population - Poland (%)
Place of birth for the foreign-born population - Romania (%)
Place of birth for the foreign-born population - Russia (%)
Place of birth for the foreign-born population - Serbia (%)
Place of birth for the foreign-born population - Ukraine (%)
Place of birth for the foreign-born population - Other Eastern Europe (%)
Place of birth for the foreign-born population - China (%)
Place of birth for the foreign-born population - Hong Kong (%)
Place of birth for the foreign-born population - Taiwan (%)
Place of birth for the foreign-born population - Japan (%)
Place of birth for the foreign-born population - Korea (%)
Place of birth for the foreign-born population - Other Eastern Asia (%)
Place of birth for the foreign-born population - Afghanistan (%)
Place of birth for the foreign-born population - Bangladesh (%)
Place of birth for the foreign-born population - India (%)
Place of birth for the foreign-born population - Iran (%)
Place of birth for the foreign-born population - Kazakhstan (%)
Place of birth for the foreign-born population - Nepal (%)
Place of birth for the foreign-born population - Pakistan (%)
Place of birth for the foreign-born population - Sri Lanka (%)
Place of birth for the foreign-born population - Uzbekistan (%)
Place of birth for the foreign-born population - Other South Central Asia (%)
Place of birth for the foreign-born population - Burma (%)
Place of birth for the foreign-born population - Cambodia (%)
Place of birth for the foreign-born population - Indonesia (%)
Place of birth for the foreign-born population - Laos (%)
Place of birth for the foreign-born population - Malaysia (%)
Place of birth for the foreign-born population - Philippines (%)
Place of birth for the foreign-born population - Singapore (%)
Place of birth for the foreign-born population - Thailand (%)
Place of birth for the foreign-born population - Vietnam (%)
Place of birth for the foreign-born population - Other South Eastern Asia (%)
Place of birth for the foreign-born population - Armenia (%)
Place of birth for the foreign-born population - Iraq (%)
Place of birth for the foreign-born population - Israel (%)
Place of birth for the foreign-born population - Jordan (%)
Place of birth for the foreign-born population - Kuwait (%)
Place of birth for the foreign-born population - Lebanon (%)
Place of birth for the foreign-born population - Saudi Arabia (%)
Place of birth for the foreign-born population - Syria (%)
Place of birth for the foreign-born population - Turkey (%)
Place of birth for the foreign-born population - Yemen (%)
Place of birth for the foreign-born population - Other Western Asia (%)
Place of birth for the foreign-born population - Eritrea (%)
Place of birth for the foreign-born population - Ethiopia (%)
Place of birth for the foreign-born population - Kenya (%)
Place of birth for the foreign-born population - Somalia (%)
Place of birth for the foreign-born population - Uganda (%)
Place of birth for the foreign-born population - Zimbabwe (%)
Place of birth for the foreign-born population - Other Eastern Africa (%)
Place of birth for the foreign-born population - Cameroon (%)
Place of birth for the foreign-born population - Congo (%)
Place of birth for the foreign-born population - Democratic Republic of Congo (Zaire) (%)
Place of birth for the foreign-born population - Other Middle Africa (%)
Place of birth for the foreign-born population - Egypt (%)
Place of birth for the foreign-born population - Morocco (%)
Place of birth for the foreign-born population - Sudan (%)
Place of birth for the foreign-born population - Other Northern Africa (%)
Place of birth for the foreign-born population - South Africa (%)
Place of birth for the foreign-born population - Other Southern Africa (%)
Place of birth for the foreign-born population - Cabo Verde (%)
Place of birth for the foreign-born population - Ghana (%)
Place of birth for the foreign-born population - Liberia (%)
Place of birth for the foreign-born population - Nigeria (%)
Place of birth for the foreign-born population - Senegal (%)
Place of birth for the foreign-born population - Sierra Leone (%)
Place of birth for the foreign-born population - Other Western Africa (%)
Place of birth for the foreign-born population - Australia (%)
Place of birth for the foreign-born population - New Zealand (%)
Place of birth for the foreign-born population - Fiji (%)
Place of birth for the foreign-born population - Micronesia (%)
Place of birth for the foreign-born population - Bahamas (%)
Place of birth for the foreign-born population - Barbados (%)
Place of birth for the foreign-born population - Cuba (%)
Place of birth for the foreign-born population - Dominica (%)
Place of birth for the foreign-born population - Dominican Republic (%)
Place of birth for the foreign-born population - Grenada (%)
Place of birth for the foreign-born population - Haiti (%)
Place of birth for the foreign-born population - Jamaica (%)
Place of birth for the foreign-born population - St. Vincent and the Grenadines (%)
Place of birth for the foreign-born population - Trinidad and Tobago (%)
Place of birth for the foreign-born population - West Indies (%)
Place of birth for the foreign-born population - Other Caribbean (%)
Place of birth for the foreign-born population - Belize (%)
Place of birth for the foreign-born population - Costa Rica (%)
Place of birth for the foreign-born population - El Salvador (%)
Place of birth for the foreign-born population - Guatemala (%)
Place of birth for the foreign-born population - Honduras (%)
Place of birth for the foreign-born population - Mexico (%)
Place of birth for the foreign-born population - Nicaragua (%)
Place of birth for the foreign-born population - Panama (%)
Place of birth for the foreign-born population - Other Central America (%)
Place of birth for the foreign-born population - Argentina (%)
Place of birth for the foreign-born population - Bolivia (%)
Place of birth for the foreign-born population - Brazil (%)
Place of birth for the foreign-born population - Chile (%)
Place of birth for the foreign-born population - Colombia (%)
Place of birth for the foreign-born population - Ecuador (%)
Place of birth for the foreign-born population - Guyana (%)
Place of birth for the foreign-born population - Peru (%)
Place of birth for the foreign-born population - Uruguay (%)
Place of birth for the foreign-born population - Venezuela (%)
Place of birth for the foreign-born population - Other South America (%)
Place of birth for the foreign-born population - Canada (%)
Place of birth for the foreign-born population - Other Northern America (%)
Place of birth for the foreign-born population - Other (%)
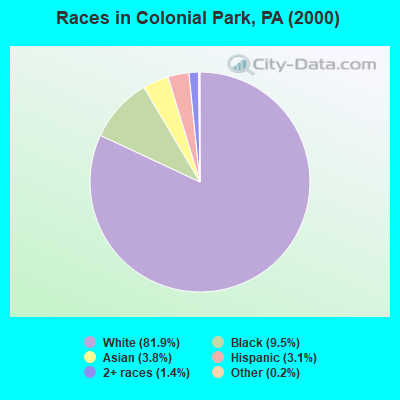
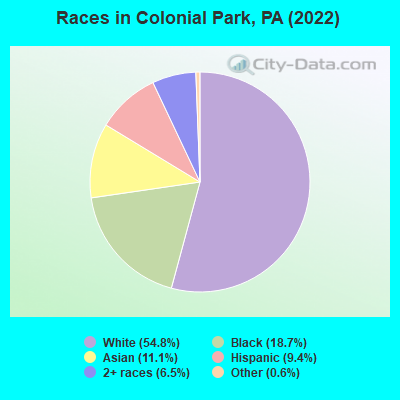
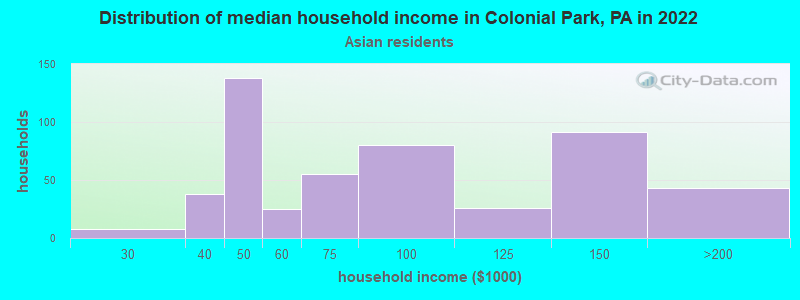
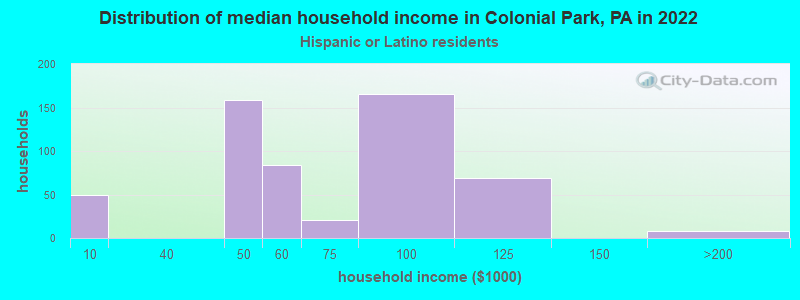
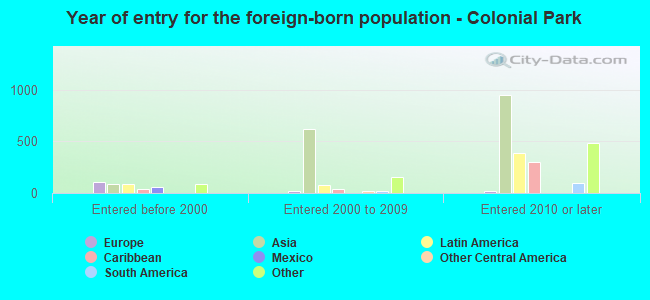
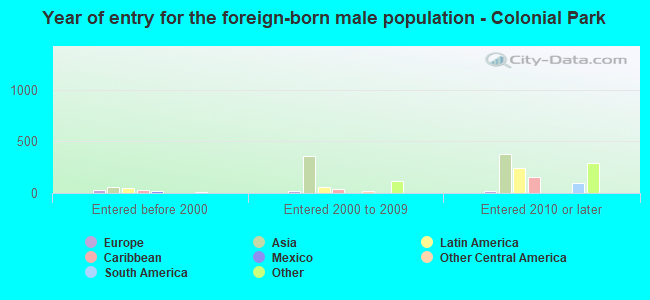
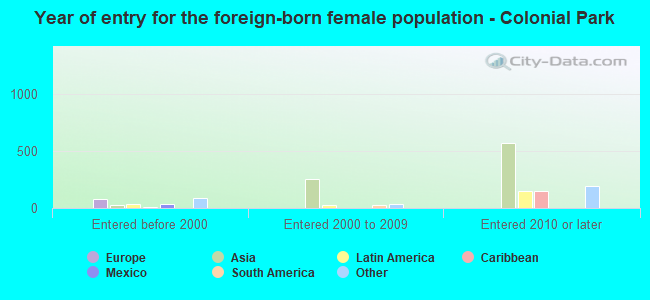
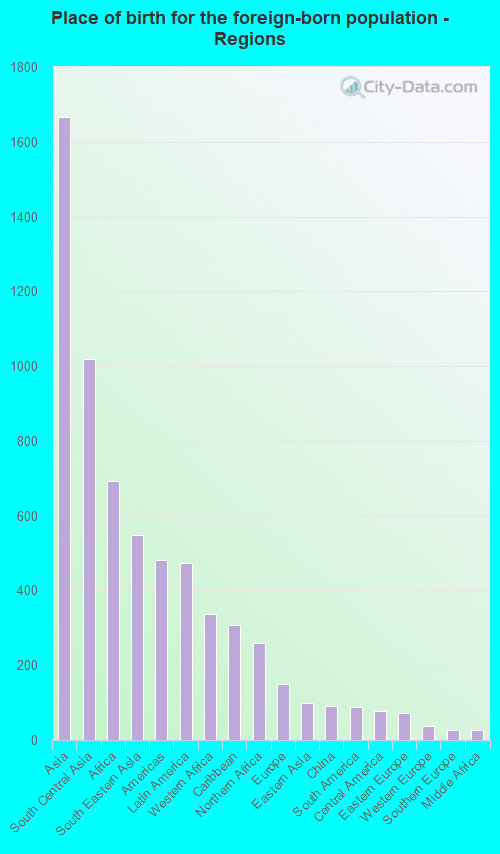
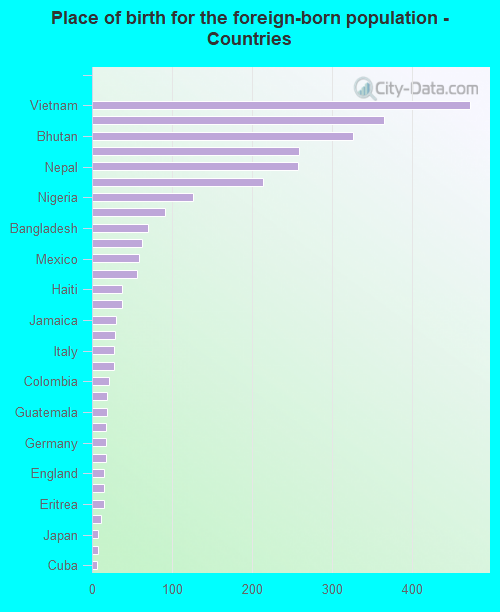
According to 2022 data, the most numerous races in Colonial Park, PA are White alone (9,347 residents), Black alone (3,183 residents), and Hispanic (1,611 residents). 80.9% of Colonial Park residents speak English at home. 17.6% of Colonial Park, PA residents are foreign-born (9.5% born in Asia, 4.0% born in Africa, 2.7% born in Latin America), which is 60.2% greater than the foreign-born rate of 7.0% across the entire state of Pennsylvania.
Race distribution in Colonial Park
2000 2022
10,322,455 84.1% White alone 1,202,437 9.8% Black alone 394,088 3.2% Hispanic 218,296 1.8% Asian alone 113,097 0.9% Two or more races 13,086 0.1% Other race alone 14,904 0.1% American Indian alone 2,691 0.02% Native Hawaiian and Other
9,487,228 73.1% White alone 1,311,581 10.1% Black alone 1,115,997 8.6% Hispanic 493,942 3.8% Two or more races 487,124 3.8% Asian alone 63,582 0.5% Other race alone 10,130 0.08% American Indian alone 2,424 0.02% Native Hawaiian and Other
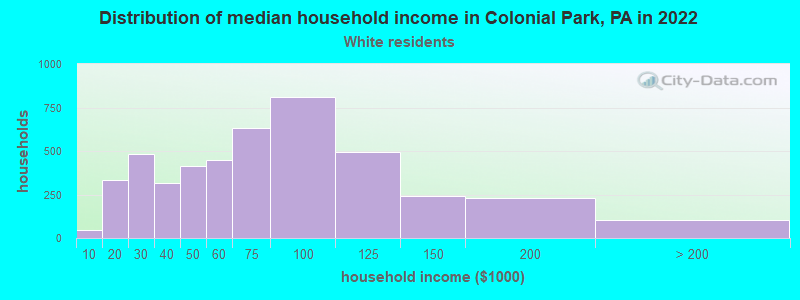
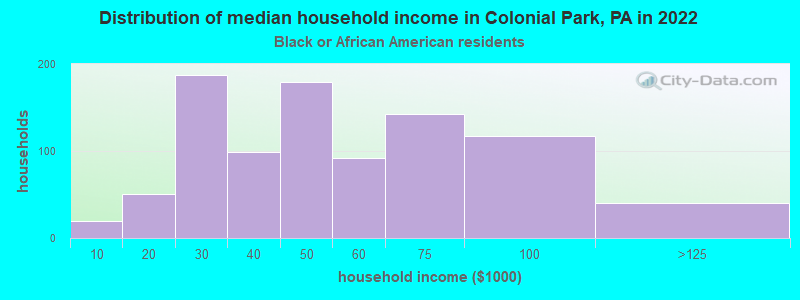
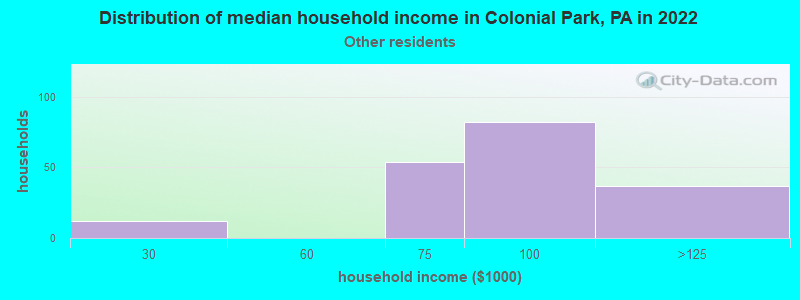
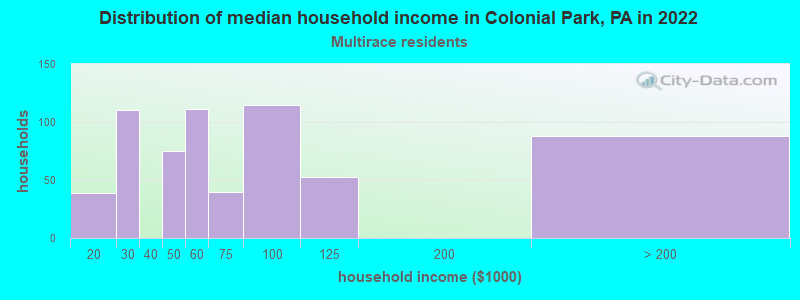
Income and house value in Colonial Park Median household income in 2022 $65,249 White non-Hispanic householders$43,033 Black householders$81,999 Asian householders$108,613 Some other race householders$48,209 Two or more races householders$67,787 Hispanic or Latino race householdersMedian 2022 house value $210,349 White Non-Hispanic householders$224,617 Black or African American householders $242,961 Asian householders$229,305 Some other race householders$215,852 Two or more races householders$229,305 Hispanic or Latino householders
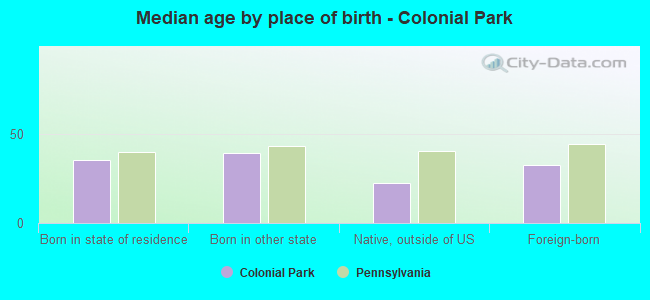
Median age by race in Colonial Park
41.8 Median age for White residents42.8 41.2 31.9 Median age for Black or African American residents27.4 35.5 -465,804,066.1 Median age for American Indian / Alaska Native residents-964,080,458.8 -577,519,379.3 30.6 Median age for Asian residents29.5 32.8 -680,432,644.4 Median age for Native Hawaiian / Pacific Islander residents-649,523,808.9 -747,474,746.7 17.2 Median age for Other race residents16.4 24.2 24.9 Median age for Two or more races residents37.5 20.3 42.3 Median age for White alone residents41.8 42.4 26.7 Median age for Hispanic or Latino residents31.5 25.8
Owner/renter occupied households by race in Colonial Park
House owners and renters - White residents 2,837 62.9% Owner occupied1,676 37.1% Renter occupiedHouse owners and renters - Black or African American residents 77 7.7% Owner occupied925 92.3% Renter occupiedHouse owners and renters - American Indian / Alaska Native residents 78 100.0% Renter occupiedHouse owners and renters - Asian residents 151 21.7% Owner occupied545 78.3% Renter occupiedHouse owners and renters - Other race residents 43 24.0% Owner occupied136 76.0% Renter occupiedHouse owners and renters - Two or more races residents 384 58.8% Owner occupied269 41.2% Renter occupiedHouse owners and renters - White alone residents 2,776 63.1% Owner occupied1,620 36.9% Renter occupiedHouse owners and renters - Hispanic or Latino residents 154 33.6% Owner occupied304 66.4% Renter occupied
Language usage in Colonial Park
English speakers - Total 80.9% of residents of Colonial Park speak English at home.
4.1% of residents speak Spanish at home 424 64.3% Speak English very well235 35.7% Speak English less than very well14.0% of residents speak other language at home 1,210 54.2% Speak English very well1,022 45.8% Speak English less than very well
English speakers - Born in the United States 92.7% of residents of Colonial Park speak English at home.
5.8% of residents speak Spanish at home 146 91.2% Speak English very well14 8.8% Speak English less than very well
English speakers - Native, born elsewhere 57.8% of residents of Colonial Park speak English at home.
42.5% of residents speak Spanish at home 4 3.1% Speak English very well124 96.9% Speak English less than very well
English speakers - Foreign-born 28.6% of residents of Colonial Park speak English at home.
6.8% of residents speak Spanish at home 162 67.5% Speak English very well78 32.5% Speak English less than very well60.6% of residents speak other language at home 1,146 53.4% Speak English very well1,002 46.6% Speak English less than very well
White (Caucasian) - Speak only English Native:
98.4% (8,986)Foreign-born:
16.4% (55)
White (Caucasian) - Speak another language Native:
1.6% (142)Foreign-born:
72.1% (243)
Black or African American - Speak only English Native:
100.0% (1,905)Foreign-born:
34.2% (396)
Black or African American - Speak another language Native:
2.1% (41)Foreign-born:
48.8% (566)
Asian - Speak only English Native:
42.5% (45)Foreign-born:
20.5% (313)
Asian - Speak another language Native:
51.7% (54)Foreign-born:
79.0% (1,209)
Other race - Speak only English Native:
27.0% (81)Foreign-born:
27.0% (104)
Other race - Speak another language Native:
69.5% (210)Foreign-born:
53.4% (206)
Two or more races - Speak another language Native:
4.3% (59)Foreign-born:
100.0% (198)
White alone - Speak only English Native:
99.3% (8,610)Foreign-born:
15.9% (59)
White alone - Speak another language Native:
0.6% (55)Foreign-born:
72.4% (271)
Hispanic or Latino - Speak only English Native:
53.3% (595)Foreign-born:
18.0% (53)
Hispanic or Latino - Speak another language Native:
32.3% (361)Foreign-born:
82.2% (242)
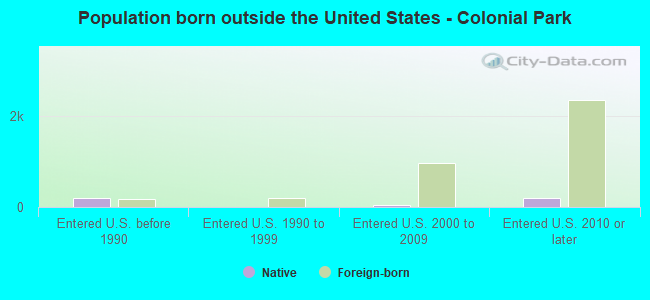
Foreign-born residents in Colonial Park 2,996 residents are foreign born (9.5% Asia , 4.0% Africa , 2.7% Latin America ).
This city:
17.6%Pennsylvania:
7.3%
Marital status for residents in Colonial Park Marital status - White (Caucasian) population 15 years and over
Males 32.0% Never married51.7% Now married1.1% Separated4.4% Widowed10.9% DivorcedFemales 27.9% Never married43.1% Now married3.3% Separated13.8% Widowed11.9% DivorcedWomen who gave birth in the past 12 months Now married:
47.5% (36)Unmarried:
52.5% (40)
Women who did not give birth in the past 12 months Now married:
44.7% (1,079)Unmarried:
55.3% (1,336)
Marital status - Black or African American population 15 years and over
Males 53.9% Never married41.2% Now married0.0% Separated0.6% Widowed4.3% DivorcedFemales 31.3% Never married36.5% Now married2.8% Separated11.6% Widowed17.8% DivorcedWomen who did not give birth in the past 12 months Now married:
56.7% (351)Unmarried:
43.3% (268)
Marital status - Asian population 15 years and over
Males 26.4% Never married73.6% Now married0.0% Separated0.0% Widowed0.0% DivorcedFemales 15.8% Never married80.9% Now married0.0% Separated2.1% Widowed1.1% DivorcedWomen who gave birth in the past 12 months Now married:
100.0% (45)Unmarried:
0.0% (0)
Women who did not give birth in the past 12 months Now married:
75.7% (409)Unmarried:
24.3% (131)
Marital status - Other race population 15 years and over
Males 57.9% Never married32.1% Now married0.0% Separated0.0% Widowed10.0% DivorcedFemales 26.2% Never married73.8% Now married0.0% Separated0.0% Widowed0.0% DivorcedWomen who gave birth in the past 12 months Now married:
100.0% (29)Unmarried:
0.0% (0)
Women who did not give birth in the past 12 months Now married:
74.5% (87)Unmarried:
25.5% (30)
Marital status - Two or more races population 15 years and over
Males 59.4% Never married40.6% Now married0.0% Separated0.0% Widowed0.0% DivorcedFemales 63.8% Never married25.7% Now married10.5% Separated0.0% Widowed0.0% DivorcedWomen who did not give birth in the past 12 months Now married:
29.4% (172)Unmarried:
70.6% (413)
Marital status - White alone, not Hispanic / Latino population 15 years and over
Males 31.0% Never married51.7% Now married1.1% Separated4.6% Widowed11.5% DivorcedFemales 25.9% Never married44.0% Now married3.5% Separated14.4% Widowed12.1% DivorcedWomen who gave birth in the past 12 months Now married:
36.4% (23)Unmarried:
63.6% (41)
Women who did not give birth in the past 12 months Now married:
46.7% (1,077)Unmarried:
53.3% (1,227)
Marital status - Hispanic or Latino population 15 years and over
Males 57.8% Never married38.0% Now married0.0% Separated0.0% Widowed4.1% DivorcedFemales 55.4% Never married38.9% Now married2.9% Separated0.0% Widowed2.9% DivorcedWomen who gave birth in the past 12 months Now married:
100.0% (37)Unmarried:
0.0% (0)
Women who did not give birth in the past 12 months Now married:
34.7% (162)Unmarried:
65.3% (305)
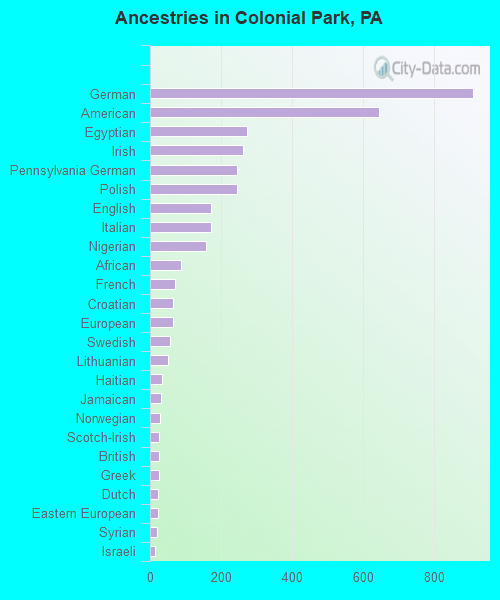
Ancestries in Colonial Park
910 10.9% German645 7.7% American272 3.2% Egyptian261 3.1% Irish246 2.9% Pennsylvania German244 2.9% Polish171 2.0% English171 2.0% Italian158 1.9% Nigerian86 1.0% African71 0.8% French64 0.8% Croatian64 0.8% European57 0.7% Swedish52 0.6% Lithuanian33 0.4% Haitian30 0.4% Jamaican29 0.3% Norwegian25 0.3% Scotch-Irish24 0.3% British24 0.3% Greek23 0.3% Dutch22 0.3% Eastern European21 0.3% Syrian15 0.2% Israeli15 0.2% Ukrainian12 0.1% Brazilian11 0.1% Slavic9 0.1% Czechoslovakian9 0.1% Serbian
Geographical mobility in Colonial Park Same house 1 year ago 8,521 86.8% White (Caucasian)2,140 68.9% Black or African American83 99.6% American Indian / Alaska Native1,134 71.6% Asian472 67.6% Other race1,413 91.1% Two or more races8,163 87.5% White alone, not Hispanic / Latino1,187 75.4% Hispanic or LatinoMoved within same county 340 3.5% White / Caucasian1,033 33.3% Black or African American145 9.1% Asian51 7.3% Other race25 1.6% Two or more races262 2.8% White alone, not Hispanic / Latino149 9.5% Hispanic or LatinoMoved within same state 465 4.7% White / Caucasian18 0.6% Black or African American222 14.0% Asian33 4.7% Other race101 6.5% Two or more races408 4.4% White alone, not Hispanic / Latino174 11.1% Hispanic or LatinoMoved from different state 557 5.7% White / Caucasian15 0.5% Black or African American138 19.7% Other race560 6.0% White alone, not Hispanic / Latino119 7.5% Hispanic or LatinoMoved from abroad 42 1.4% Black or African American72 4.6% Asian
Children Nativity (place of birth) in Colonial Park
Children under 6 years - Living with two parents Both parents native 497 99.8% Native1 0.2% Foreign-bornBoth parents foreign-born 426 93.9% Native28 6.1% Foreign-bornChildren under 6 years - Living with one parent Native parent 185 100.0% NativeForeign-born parent 129 100.0% NativeChildren 6 to 17 years - Living with two parents Both parents native 1,116 100.0% NativeBoth parents foreign-born 378 63.7% Native215 36.3% Foreign-bornOne native, one foreign-born parent 35 100.0% NativeChildren 6 to 17 years - Living with one parent Native parent 506 100.0% NativeForeign-born parent 202 58.8% Native141 41.2% Foreign-born
Grandparents responsible for own grandchildren in Colonial Park
Grandparents (30 to 59 years) White / Caucasian 5 100.0% Responsible for grandchildrenAsian 11 100.0% Not responsible for grandchildrenWhite alone, not Hispanic / Latino 6 100.0% Responsible for grandchildrenGrandparents (60 years and over) White / Caucasian 285 80.1% Responsible for grandchildren71 19.9% Not responsible for grandchildrenAsian 152 100.0% Not responsible for grandchildrenWhite alone, not Hispanic / Latino 284 79.6% Responsible for grandchildren73 20.4% Not responsible for grandchildren