Races in Columbia Heights, Minnesota (MN) Detailed Stats
Data:
Races - White alone (%)
Races - White alone (% change since 2000)
Races - Black alone (%)
Races - Black alone (% change since 2000)
Races - American Indian alone (%)
Races - American Indian alone (% change since 2000)
Races - Asian alone (%)
Races - Asian alone (% change since 2000)
Races - Hispanic (%)
Races - Hispanic (% change since 2000)
Races - Native Hawaiian and Other Pacific Islander alone (%)
Races - Native Hawaiian and Other Pacific Islander alone (% change since 2000)
Races - Two or more races(%)
Races - Two or more races(% change since 2000)
Races - Other race alone (%)
Races - Other race alone (% change since 2000)
Racial diversity
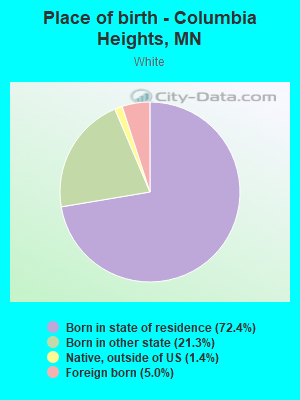
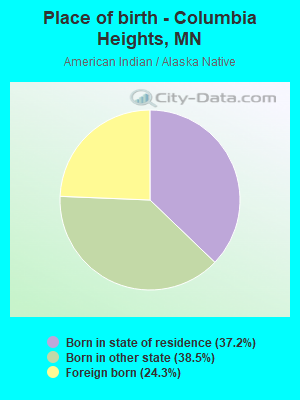
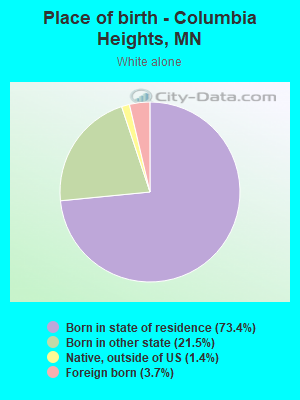
Place of birth - Born in state of residence (%)
Place of birth - Born in state of residence (%) - White
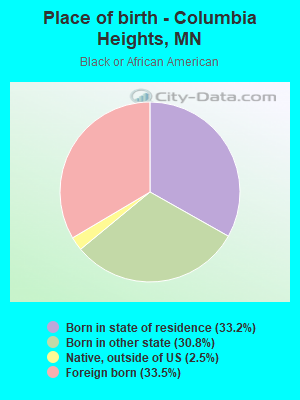
Place of birth - Born in state of residence (%) - Black or African American
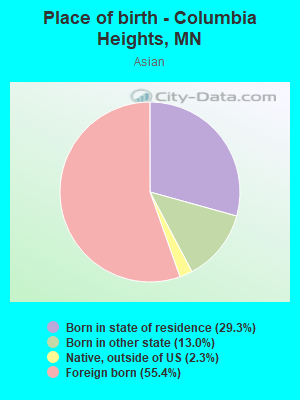
Place of birth - Born in state of residence (%) - Asian
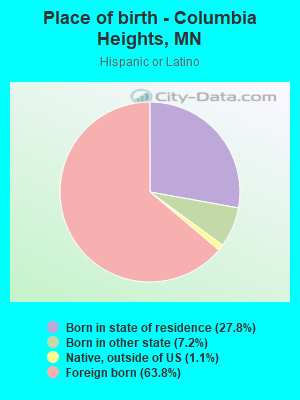
Place of birth - Born in state of residence (%) - Hispanic or Latino
Place of birth - Born in state of residence (%) - American Indian and Alaska Native
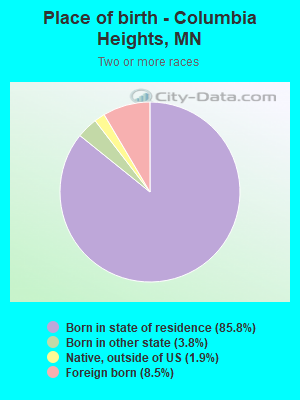
Place of birth - Born in state of residence (%) - Multirace
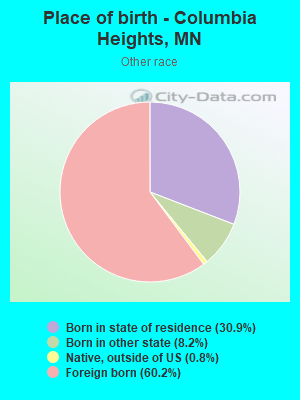
Place of birth - Born in state of residence (%) - Other Race
Place of birth - Born in other state (%)
Place of birth - Born in other state (%) - White
Place of birth - Born in other state (%) - Black or African American
Place of birth - Born in other state (%) - Asian
Place of birth - Born in other state (%) - Hispanic or Latino
Place of birth - Born in other state (%) - American Indian and Alaska Native
Place of birth - Born in other state (%) - Multirace
Place of birth - Born in other state (%) - Other Race
Place of birth - Native, outside of US (%)
Place of birth - Native, outside of US (%) - White
Place of birth - Native, outside of US (%) - Black or African American
Place of birth - Native, outside of US (%) - Asian
Place of birth - Native, outside of US (%) - Hispanic or Latino
Place of birth - Native, outside of US (%) - American Indian and Alaska Native
Place of birth - Native, outside of US (%) - Multirace
Place of birth - Native, outside of US (%) - Other Race
Place of birth - Foreign born (%)
Place of birth - Foreign born (%) - White
Place of birth - Foreign born (%) - Black or African American
Place of birth - Foreign born (%) - Asian
Place of birth - Foreign born (%) - Hispanic or Latino
Place of birth - Foreign born (%) - American Indian and Alaska Native
Place of birth - Foreign born (%) - Multirace
Place of birth - Foreign born (%) - Other Race
Residents speaking English at home (%)
Residents speaking English at home - Born in the United States (%)
Residents speaking English at home - Native, born elsewhere (%)
Residents speaking English at home - Foreign born (%)
Residents speaking Spanish at home (%)
Residents speaking Spanish at home - Born in the United States (%)
Residents speaking Spanish at home - Native, born elsewhere (%)
Residents speaking Spanish at home - Foreign born (%)
Residents speaking other language at home (%)
Residents speaking other language at home - Born in the United States (%)
Residents speaking other language at home - Native, born elsewhere (%)
Residents speaking other language at home - Foreign born (%)
Marital status - Never married (%)
Marital status - Now married (%)
Marital status - Separated (%)
Marital status - Widowed (%)
Marital status - Divorced (%)
Ancestries Reported - Arab (%)
Ancestries Reported - Czech (%)
Ancestries Reported - Danish (%)
Ancestries Reported - Dutch (%)
Ancestries Reported - English (%)
Ancestries Reported - French (%)
Ancestries Reported - French Canadian (%)
Ancestries Reported - German (%)
Ancestries Reported - Greek (%)
Ancestries Reported - Hungarian (%)
Ancestries Reported - Irish (%)
Ancestries Reported - Italian (%)
Ancestries Reported - Lithuanian (%)
Ancestries Reported - Norwegian (%)
Ancestries Reported - Polish (%)
Ancestries Reported - Portuguese (%)
Ancestries Reported - Russian (%)
Ancestries Reported - Scotch-Irish (%)
Ancestries Reported - Scottish (%)
Ancestries Reported - Slovak (%)
Ancestries Reported - Subsaharan African (%)
Ancestries Reported - Swedish (%)
Ancestries Reported - Swiss (%)
Ancestries Reported - Ukrainian (%)
Ancestries Reported - United States (%)
Ancestries Reported - Welsh (%)
Ancestries Reported - West Indian (%)
Ancestries Reported - Other (%)
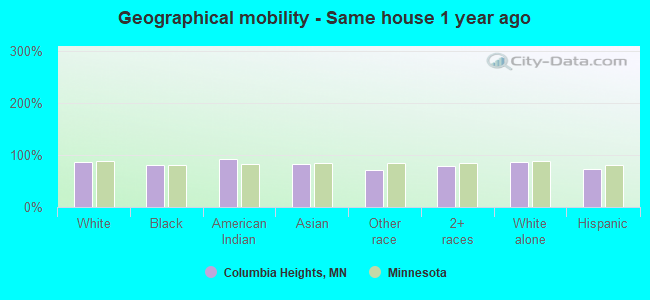
Geographical mobility - Same house 1 year ago (%)
Geographical mobility - Same house 1 year ago (%) - White
Geographical mobility - Same house 1 year ago (%) - Black or African American
Geographical mobility - Same house 1 year ago (%) - Asian
Geographical mobility - Same house 1 year ago (%) - Hispanic or Latino
Geographical mobility - Same house 1 year ago (%) - American Indian and Alaska Native
Geographical mobility - Same house 1 year ago (%) - Multirace
Geographical mobility - Same house 1 year ago (%) - Other Race
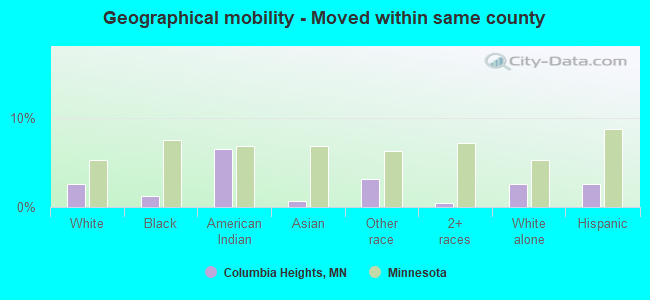
Geographical mobility - Moved within same county (%)
Geographical mobility - Moved within same county (%) - White
Geographical mobility - Moved within same county (%) - Black or African American
Geographical mobility - Moved within same county (%) - Asian
Geographical mobility - Moved within same county (%) - Hispanic or Latino
Geographical mobility - Moved within same county (%) - American Indian and Alaska Native
Geographical mobility - Moved within same county (%) - Multirace
Geographical mobility - Moved within same county (%) - Other Race
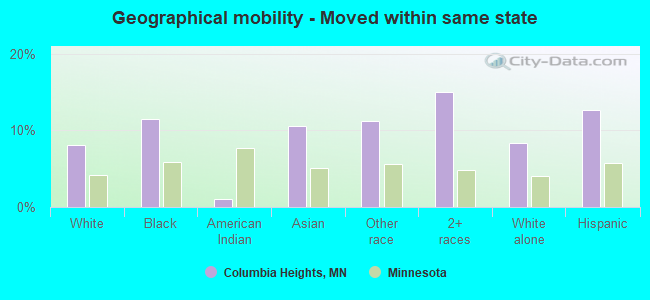
Geographical mobility - Moved from different county within same state (%)
Geographical mobility - Moved from different county within same state (%) - White
Geographical mobility - Moved from different county within same state (%) - Black or African American
Geographical mobility - Moved from different county within same state (%) - Asian
Geographical mobility - Moved from different county within same state (%) - Hispanic or Latino
Geographical mobility - Moved from different county within same state (%) - American Indian and Alaska Native
Geographical mobility - Moved from different county within same state (%) - Multirace
Geographical mobility - Moved from different county within same state (%) - Other Race
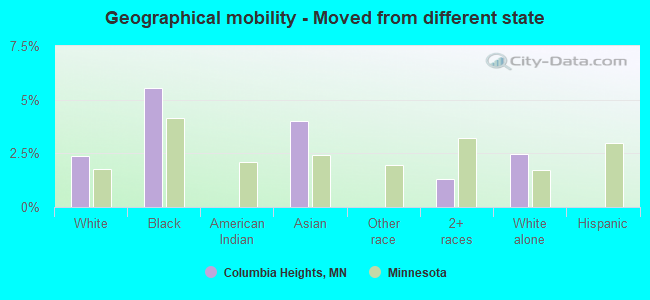
Geographical mobility - Moved from different state (%)
Geographical mobility - Moved from different state (%) - White
Geographical mobility - Moved from different state (%) - Black or African American
Geographical mobility - Moved from different state (%) - Asian
Geographical mobility - Moved from different state (%) - Hispanic or Latino
Geographical mobility - Moved from different state (%) - American Indian and Alaska Native
Geographical mobility - Moved from different state (%) - Multirace
Geographical mobility - Moved from different state (%) - Other Race
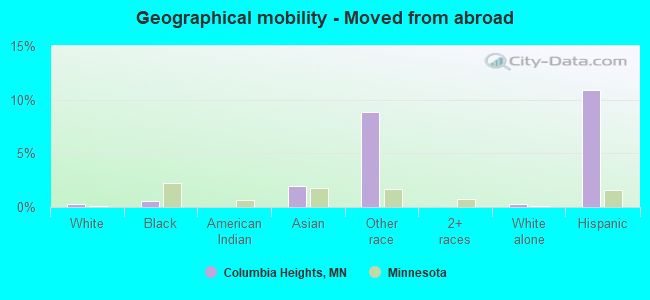
Geographical mobility - Moved from abroad (%)
Geographical mobility - Moved from abroad (%) - White
Geographical mobility - Moved from abroad (%) - Black or African American
Geographical mobility - Moved from abroad (%) - Asian
Geographical mobility - Moved from abroad (%) - Hispanic or Latino
Geographical mobility - Moved from abroad (%) - American Indian and Alaska Native
Geographical mobility - Moved from abroad (%) - Multirace
Geographical mobility - Moved from abroad (%) - Other Race
Place of birth for the foreign-born population - Ireland (%)
Place of birth for the foreign-born population - Denmark (%)
Place of birth for the foreign-born population - Norway (%)
Place of birth for the foreign-born population - Sweden (%)
Place of birth for the foreign-born population - United Kingdom (%)
Place of birth for the foreign-born population - England (%)
Place of birth for the foreign-born population - Scotland (%)
Place of birth for the foreign-born population - Other Northern Europe (%)
Place of birth for the foreign-born population - Austria (%)
Place of birth for the foreign-born population - Belgium (%)
Place of birth for the foreign-born population - France (%)
Place of birth for the foreign-born population - Germany (%)
Place of birth for the foreign-born population - Netherlands (%)
Place of birth for the foreign-born population - Switzerland (%)
Place of birth for the foreign-born population - Other Western Europe (%)
Place of birth for the foreign-born population - Greece (%)
Place of birth for the foreign-born population - Italy (%)
Place of birth for the foreign-born population - Portugal (%)
Place of birth for the foreign-born population - Spain (%)
Place of birth for the foreign-born population - Other Southern Europe (%)
Place of birth for the foreign-born population - Albania (%)
Place of birth for the foreign-born population - Belarus (%)
Place of birth for the foreign-born population - Bosnia and Herzegovina (%)
Place of birth for the foreign-born population - Bulgaria (%)
Place of birth for the foreign-born population - Croatia (%)
Place of birth for the foreign-born population - Czechoslovakia (%)
Place of birth for the foreign-born population - Hungary (%)
Place of birth for the foreign-born population - Latvia (%)
Place of birth for the foreign-born population - Lithuania (%)
Place of birth for the foreign-born population - North Macedonia (Macedonia) (%)
Place of birth for the foreign-born population - Moldova (%)
Place of birth for the foreign-born population - Poland (%)
Place of birth for the foreign-born population - Romania (%)
Place of birth for the foreign-born population - Russia (%)
Place of birth for the foreign-born population - Serbia (%)
Place of birth for the foreign-born population - Ukraine (%)
Place of birth for the foreign-born population - Other Eastern Europe (%)
Place of birth for the foreign-born population - China (%)
Place of birth for the foreign-born population - Hong Kong (%)
Place of birth for the foreign-born population - Taiwan (%)
Place of birth for the foreign-born population - Japan (%)
Place of birth for the foreign-born population - Korea (%)
Place of birth for the foreign-born population - Other Eastern Asia (%)
Place of birth for the foreign-born population - Afghanistan (%)
Place of birth for the foreign-born population - Bangladesh (%)
Place of birth for the foreign-born population - India (%)
Place of birth for the foreign-born population - Iran (%)
Place of birth for the foreign-born population - Kazakhstan (%)
Place of birth for the foreign-born population - Nepal (%)
Place of birth for the foreign-born population - Pakistan (%)
Place of birth for the foreign-born population - Sri Lanka (%)
Place of birth for the foreign-born population - Uzbekistan (%)
Place of birth for the foreign-born population - Other South Central Asia (%)
Place of birth for the foreign-born population - Burma (%)
Place of birth for the foreign-born population - Cambodia (%)
Place of birth for the foreign-born population - Indonesia (%)
Place of birth for the foreign-born population - Laos (%)
Place of birth for the foreign-born population - Malaysia (%)
Place of birth for the foreign-born population - Philippines (%)
Place of birth for the foreign-born population - Singapore (%)
Place of birth for the foreign-born population - Thailand (%)
Place of birth for the foreign-born population - Vietnam (%)
Place of birth for the foreign-born population - Other South Eastern Asia (%)
Place of birth for the foreign-born population - Armenia (%)
Place of birth for the foreign-born population - Iraq (%)
Place of birth for the foreign-born population - Israel (%)
Place of birth for the foreign-born population - Jordan (%)
Place of birth for the foreign-born population - Kuwait (%)
Place of birth for the foreign-born population - Lebanon (%)
Place of birth for the foreign-born population - Saudi Arabia (%)
Place of birth for the foreign-born population - Syria (%)
Place of birth for the foreign-born population - Turkey (%)
Place of birth for the foreign-born population - Yemen (%)
Place of birth for the foreign-born population - Other Western Asia (%)
Place of birth for the foreign-born population - Eritrea (%)
Place of birth for the foreign-born population - Ethiopia (%)
Place of birth for the foreign-born population - Kenya (%)
Place of birth for the foreign-born population - Somalia (%)
Place of birth for the foreign-born population - Uganda (%)
Place of birth for the foreign-born population - Zimbabwe (%)
Place of birth for the foreign-born population - Other Eastern Africa (%)
Place of birth for the foreign-born population - Cameroon (%)
Place of birth for the foreign-born population - Congo (%)
Place of birth for the foreign-born population - Democratic Republic of Congo (Zaire) (%)
Place of birth for the foreign-born population - Other Middle Africa (%)
Place of birth for the foreign-born population - Egypt (%)
Place of birth for the foreign-born population - Morocco (%)
Place of birth for the foreign-born population - Sudan (%)
Place of birth for the foreign-born population - Other Northern Africa (%)
Place of birth for the foreign-born population - South Africa (%)
Place of birth for the foreign-born population - Other Southern Africa (%)
Place of birth for the foreign-born population - Cabo Verde (%)
Place of birth for the foreign-born population - Ghana (%)
Place of birth for the foreign-born population - Liberia (%)
Place of birth for the foreign-born population - Nigeria (%)
Place of birth for the foreign-born population - Senegal (%)
Place of birth for the foreign-born population - Sierra Leone (%)
Place of birth for the foreign-born population - Other Western Africa (%)
Place of birth for the foreign-born population - Australia (%)
Place of birth for the foreign-born population - New Zealand (%)
Place of birth for the foreign-born population - Fiji (%)
Place of birth for the foreign-born population - Micronesia (%)
Place of birth for the foreign-born population - Bahamas (%)
Place of birth for the foreign-born population - Barbados (%)
Place of birth for the foreign-born population - Cuba (%)
Place of birth for the foreign-born population - Dominica (%)
Place of birth for the foreign-born population - Dominican Republic (%)
Place of birth for the foreign-born population - Grenada (%)
Place of birth for the foreign-born population - Haiti (%)
Place of birth for the foreign-born population - Jamaica (%)
Place of birth for the foreign-born population - St. Vincent and the Grenadines (%)
Place of birth for the foreign-born population - Trinidad and Tobago (%)
Place of birth for the foreign-born population - West Indies (%)
Place of birth for the foreign-born population - Other Caribbean (%)
Place of birth for the foreign-born population - Belize (%)
Place of birth for the foreign-born population - Costa Rica (%)
Place of birth for the foreign-born population - El Salvador (%)
Place of birth for the foreign-born population - Guatemala (%)
Place of birth for the foreign-born population - Honduras (%)
Place of birth for the foreign-born population - Mexico (%)
Place of birth for the foreign-born population - Nicaragua (%)
Place of birth for the foreign-born population - Panama (%)
Place of birth for the foreign-born population - Other Central America (%)
Place of birth for the foreign-born population - Argentina (%)
Place of birth for the foreign-born population - Bolivia (%)
Place of birth for the foreign-born population - Brazil (%)
Place of birth for the foreign-born population - Chile (%)
Place of birth for the foreign-born population - Colombia (%)
Place of birth for the foreign-born population - Ecuador (%)
Place of birth for the foreign-born population - Guyana (%)
Place of birth for the foreign-born population - Peru (%)
Place of birth for the foreign-born population - Uruguay (%)
Place of birth for the foreign-born population - Venezuela (%)
Place of birth for the foreign-born population - Other South America (%)
Place of birth for the foreign-born population - Canada (%)
Place of birth for the foreign-born population - Other Northern America (%)
Place of birth for the foreign-born population - Other (%)
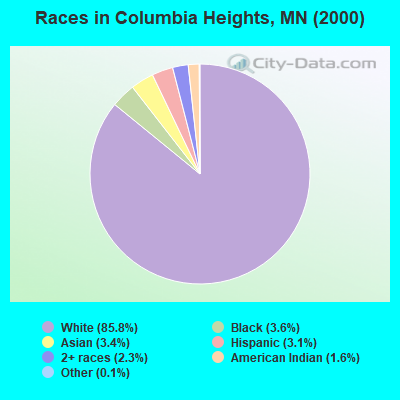
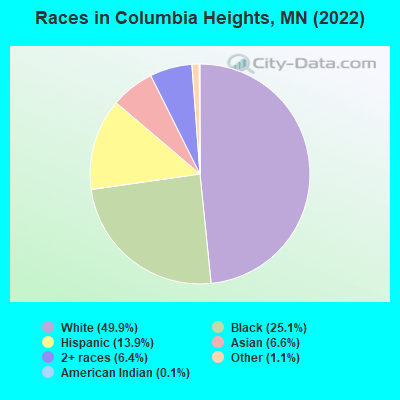
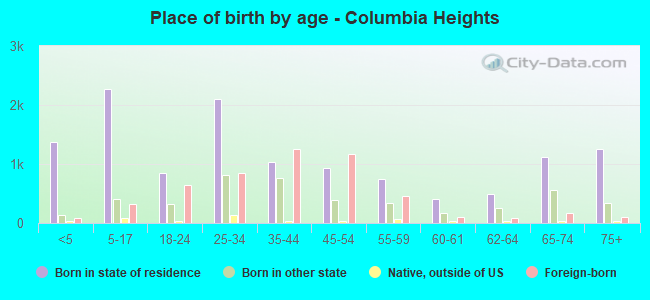
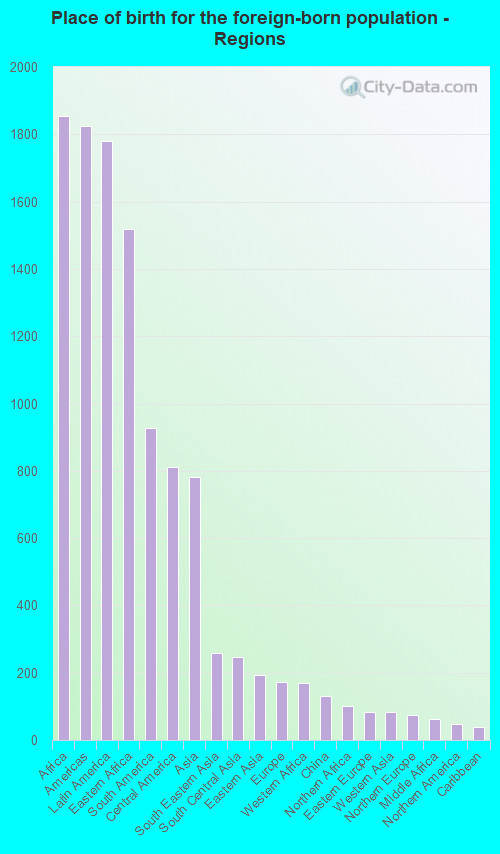
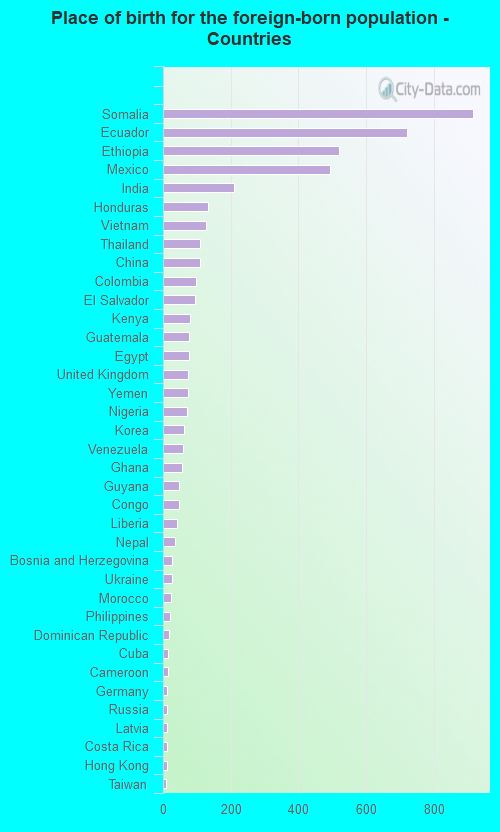
According to 2022 data, the most numerous races in Columbia Heights, MN are White alone (11,033 residents), Black alone (5,546 residents), and Hispanic (3,063 residents). 70.4% of Columbia Heights residents speak English at home. 21.0% of Columbia Heights, MN residents are foreign-born (8.2% born in Africa, 7.9% born in Latin America, 3.5% born in Asia), which is 61.8% greater than the foreign-born rate of 8.0% across the entire state of Minnesota.
Race distribution in Columbia Heights
2000 2022
4,337,143 88.2% White alone 168,813 3.4% Black alone 143,382 2.9% Hispanic 141,083 2.9% Asian alone 70,304 1.4% Two or more races 52,009 1.1% American Indian alone 5,031 0.1% Other race alone 1,714 0.03% Native Hawaiian and Other
4,356,347 76.2% White alone 395,179 6.9% Black alone 333,830 5.8% Hispanic 294,800 5.2% Asian alone 259,649 4.5% Two or more races 42,125 0.7% American Indian alone 32,976 0.6% Other race alone 2,278 0.04% Native Hawaiian and Other
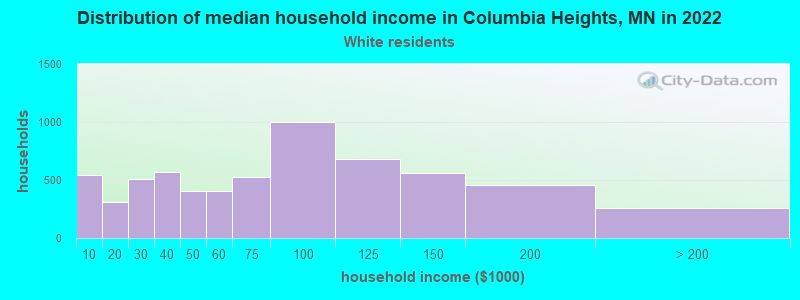
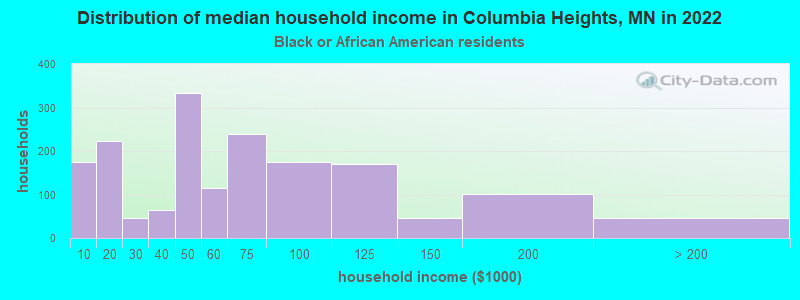
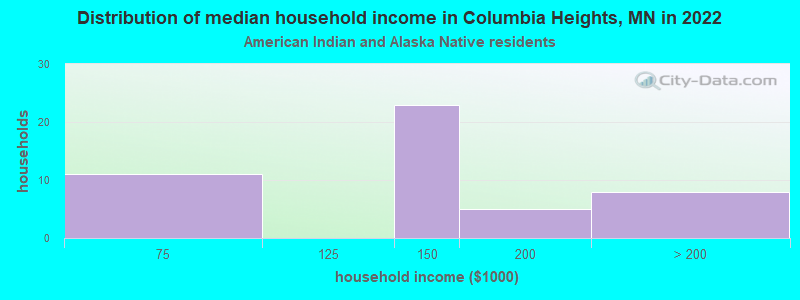
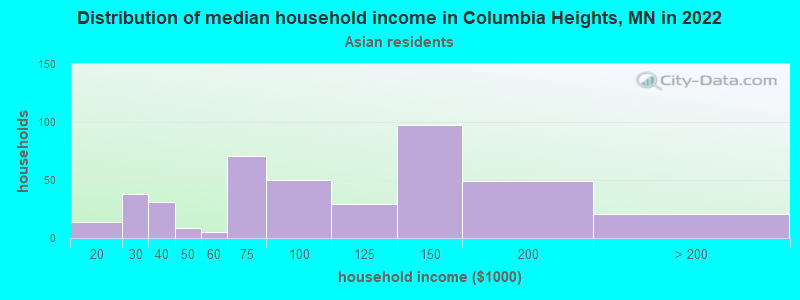
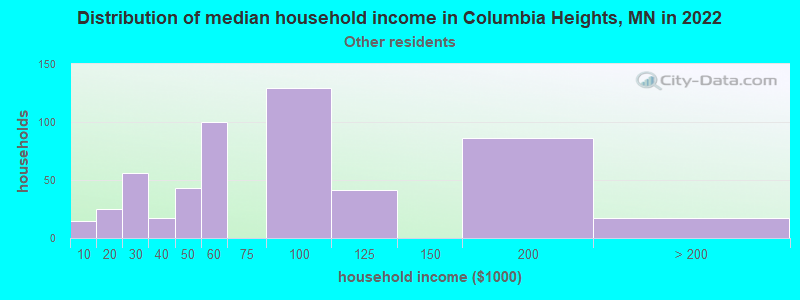
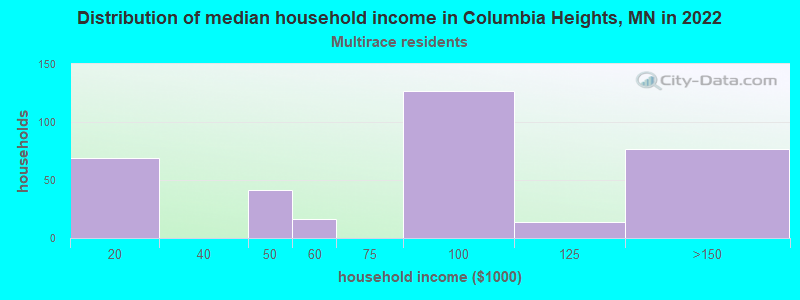
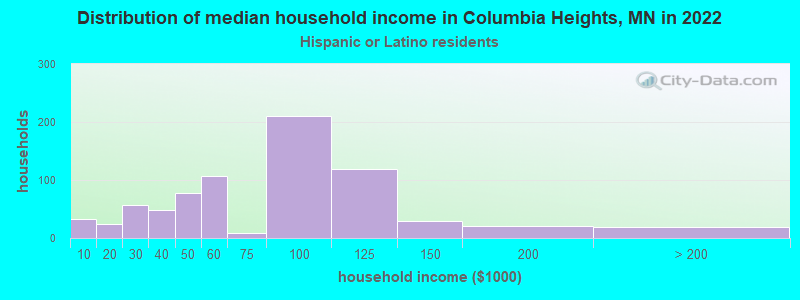
Income and house value in Columbia Heights Median household income in 2022 $72,006 White non-Hispanic householders$43,851 Black householders$123,717 American Indian and Alaska Native householders$118,007 Asian householders$86,314 Some other race householders$91,923 Two or more races householders$73,928 Hispanic or Latino race householdersMedian 2022 house value $268,725 White Non-Hispanic householders$332,571 Black or African American householders$344,869 American Indian or Alaska Native householders $292,275 Asian householders$234,709 Some other race householders$315,563 Two or more races householders$261,660 Hispanic or Latino householders
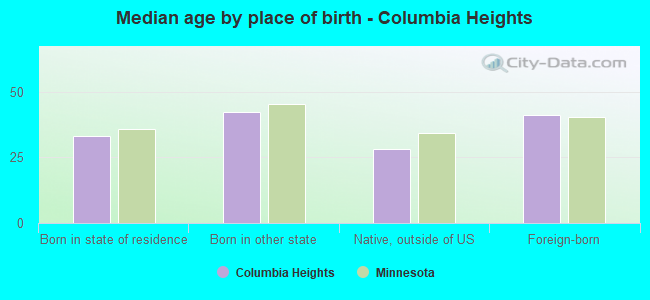
Median age by race in Columbia Heights
49.2 Median age for White residents48.5 49.7 28.3 Median age for Black or African American residents26.7 31.5 58.5 Median age for American Indian / Alaska Native residents46.2 76.9 32.1 Median age for Asian residents28.1 37.2 -670,553,935.2 Median age for Native Hawaiian / Pacific Islander residents-670,553,935.2 -534,959,349.1 27.4 Median age for Other race residents25.6 27.7 23.5 Median age for Two or more races residents22.5 26.2 50.3 Median age for White alone residents49.3 51.6 27.3 Median age for Hispanic or Latino residents27.0 26.9
Owner/renter occupied households by race in Columbia Heights
House owners and renters - White residents 4,361 72.0% Owner occupied1,698 28.0% Renter occupiedHouse owners and renters - Black or African American residents 624 36.7% Owner occupied1,078 63.3% Renter occupiedHouse owners and renters - American Indian / Alaska Native residents 16 42.8% Owner occupied21 57.2% Renter occupiedHouse owners and renters - Asian residents 435 92.4% Owner occupied36 7.6% Renter occupiedHouse owners and renters - Other race residents 530 74.7% Owner occupied180 25.3% Renter occupiedHouse owners and renters - Two or more races residents 213 60.3% Owner occupied140 39.7% Renter occupiedHouse owners and renters - White alone residents 4,288 72.3% Owner occupied1,643 27.7% Renter occupiedHouse owners and renters - Hispanic or Latino residents 510 69.2% Owner occupied227 30.8% Renter occupied
Language usage in Columbia Heights
English speakers - Total 70.4% of residents of Columbia Heights speak English at home.
10.8% of residents speak Spanish at home 1,067 48.3% Speak English very well1,144 51.7% Speak English less than very well21.8% of residents speak other language at home 2,882 64.4% Speak English very well1,592 35.6% Speak English less than very well
English speakers - Born in the United States 85.5% of residents of Columbia Heights speak English at home.
3.1% of residents speak Spanish at home 120 88.2% Speak English very well16 11.8% Speak English less than very well14.6% of residents speak other language at home 611 96.7% Speak English very well21 3.3% Speak English less than very well
English speakers - Native, born elsewhere 61.6% of residents of Columbia Heights speak English at home.
3.5% of residents speak Spanish at home 14 100.0% Speak English less than very well38.6% of residents speak other language at home 153 100.0% Speak English very well
English speakers - Foreign-born 18.1% of residents of Columbia Heights speak English at home.
25.2% of residents speak Spanish at home 282 22.1% Speak English very well996 77.9% Speak English less than very well55.8% of residents speak other language at home 1,328 47.0% Speak English very well1,499 53.0% Speak English less than very well
White (Caucasian) - Speak only English Native:
96.3% (10,004)Foreign-born:
17.4% (99)
White (Caucasian) - Speak another language Native:
4.0% (412)Foreign-born:
82.8% (470)
Black or African American - Speak only English Native:
71.1% (2,207)Foreign-born:
5.1% (95)
Black or African American - Speak another language Native:
30.3% (942)Foreign-born:
94.7% (1,768)
American Indian / Alaska Native - Speak another language Native:
57.6% (53)Foreign-born:
100.0% (29)
Asian - Speak only English Native:
23.8% (119)Foreign-born:
24.1% (194)
Asian - Speak another language Native:
80.1% (402)Foreign-born:
66.7% (537)
Other race - Speak only English Native:
41.2% (477)Foreign-born:
27.5% (551)
Other race - Speak another language Native:
57.4% (664)Foreign-born:
61.7% (1,236)
Two or more races - Speak only English Native:
82.5% (1,055)Foreign-born:
0.9% (1)
Two or more races - Speak another language Native:
14.1% (180)Foreign-born:
100.0% (149)
White alone - Speak only English Native:
97.1% (9,942)Foreign-born:
22.6% (91)
White alone - Speak another language Native:
3.2% (325)Foreign-born:
76.8% (311)
Hispanic or Latino - Speak only English Native:
22.4% (204)Foreign-born:
38.0% (748)
Hispanic or Latino - Speak another language Native:
87.6% (797)Foreign-born:
67.8% (1,334)
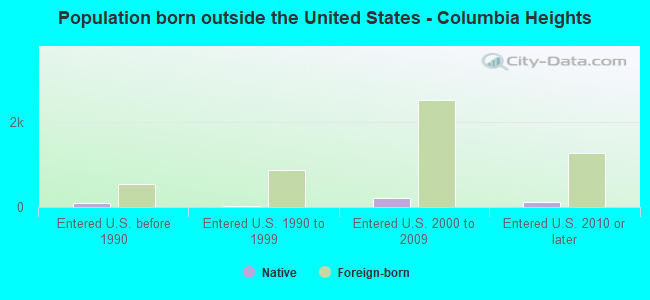
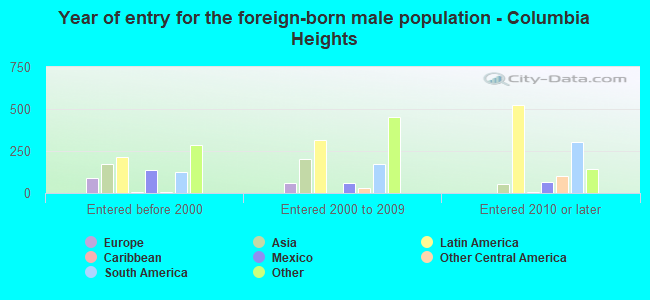
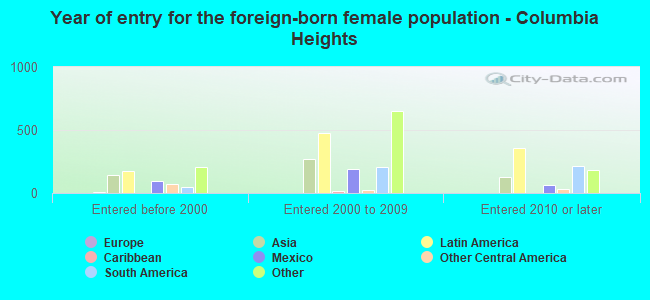
Foreign-born residents in Columbia Heights 4,637 residents are foreign born (8.2% Africa , 7.9% Latin America , 3.5% Asia ).
This city:
21.0%Minnesota:
8.5%
Marital status for residents in Columbia Heights Marital status - White (Caucasian) population 15 years and over
Males 36.5% Never married40.3% Now married0.7% Separated3.8% Widowed18.7% DivorcedFemales 35.6% Never married39.2% Now married0.2% Separated8.3% Widowed16.7% DivorcedWomen who gave birth in the past 12 months Now married:
60.9% (73)Unmarried:
39.1% (47)
Women who did not give birth in the past 12 months Now married:
36.2% (794)Unmarried:
63.8% (1,400)
Marital status - Black or African American population 15 years and over
Males 47.6% Never married42.7% Now married1.4% Separated0.4% Widowed8.0% DivorcedFemales 47.7% Never married32.2% Now married4.9% Separated10.3% Widowed4.8% DivorcedWomen who gave birth in the past 12 months Now married:
100.0% (76)Unmarried:
0.0% (0)
Women who did not give birth in the past 12 months Now married:
40.2% (453)Unmarried:
59.8% (673)
Marital status - American Indian / Alaska Native population 15 years and over
Males 24.5% Never married75.5% Now married0.0% Separated0.0% Widowed0.0% DivorcedFemales 57.6% Never married15.2% Now married0.0% Separated0.0% Widowed27.3% DivorcedWomen who gave birth in the past 12 months Now married:
0.0% (0)Unmarried:
100.0% (5)
Women who did not give birth in the past 12 months Now married:
26.3% (5)Unmarried:
73.7% (15)
Marital status - Asian population 15 years and over
Males 54.0% Never married31.5% Now married0.0% Separated0.0% Widowed14.5% DivorcedFemales 44.6% Never married31.0% Now married0.0% Separated13.4% Widowed11.0% DivorcedWomen who gave birth in the past 12 months Now married:
61.9% (16)Unmarried:
38.1% (10)
Women who did not give birth in the past 12 months Now married:
31.4% (154)Unmarried:
68.6% (337)
Marital status - Other race population 15 years and over
Males 44.3% Never married42.8% Now married0.0% Separated0.0% Widowed12.9% DivorcedFemales 42.5% Never married45.8% Now married3.9% Separated0.0% Widowed7.8% DivorcedWomen who gave birth in the past 12 months Now married:
100.0% (46)Unmarried:
0.0% (0)
Women who did not give birth in the past 12 months Now married:
37.3% (367)Unmarried:
62.7% (618)
Marital status - Two or more races population 15 years and over
Males 71.4% Never married14.3% Now married0.0% Separated0.0% Widowed14.3% DivorcedFemales 47.1% Never married36.2% Now married14.1% Separated0.0% Widowed2.7% DivorcedWomen who gave birth in the past 12 months Now married:
100.0% (46)Unmarried:
0.0% (0)
Women who did not give birth in the past 12 months Now married:
47.0% (227)Unmarried:
53.0% (256)
Marital status - White alone, not Hispanic / Latino population 15 years and over
Males 37.1% Never married39.7% Now married0.8% Separated3.9% Widowed18.6% DivorcedFemales 35.9% Never married38.2% Now married0.2% Separated8.5% Widowed17.1% DivorcedWomen who gave birth in the past 12 months Now married:
60.9% (74)Unmarried:
39.1% (47)
Women who did not give birth in the past 12 months Now married:
33.8% (706)Unmarried:
66.2% (1,382)
Marital status - Hispanic or Latino population 15 years and over
Males 37.4% Never married46.9% Now married0.0% Separated0.0% Widowed15.7% DivorcedFemales 46.4% Never married39.7% Now married7.7% Separated0.0% Widowed6.2% DivorcedWomen who gave birth in the past 12 months Now married:
100.0% (29)Unmarried:
0.0% (0)
Women who did not give birth in the past 12 months Now married:
41.3% (418)Unmarried:
58.7% (594)
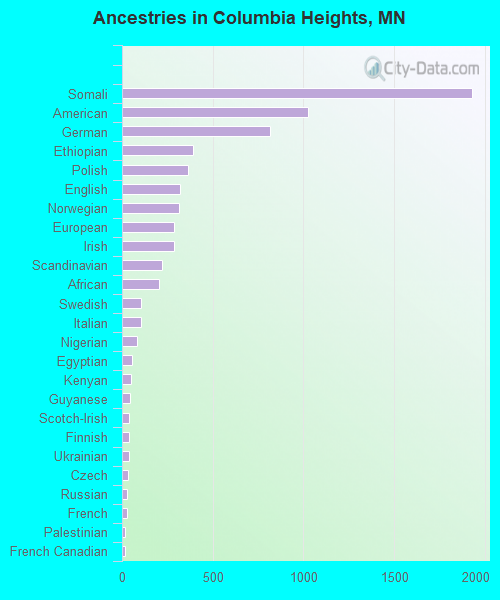
Ancestries in Columbia Heights
1,926 16.4% Somali1,023 8.7% American816 7.0% German393 3.3% Ethiopian362 3.1% Polish317 2.7% English313 2.7% Norwegian289 2.5% European288 2.5% Irish218 1.9% Scandinavian204 1.7% African104 0.9% Swedish102 0.9% Italian83 0.7% Nigerian54 0.5% Egyptian52 0.4% Kenyan43 0.4% Guyanese41 0.3% Scotch-Irish36 0.3% Finnish36 0.3% Ukrainian34 0.3% Czech28 0.2% Russian26 0.2% French19 0.2% Palestinian19 0.2% French Canadian18 0.2% Latvian17 0.1% Dutch14 0.1% Portuguese12 0.1% Serbian12 0.1% Slovak11 0.09% Eastern European10 0.09% Hungarian10 0.09% Romanian9 0.08% Moroccan6 0.05% Yugoslavian4 0.03% Slavic2 0.02% British2 0.02% Northern European
Geographical mobility in Columbia Heights Same house 1 year ago 9,830 87.1% White (Caucasian)4,395 80.3% Black or African American104 92.4% American Indian / Alaska Native1,074 83.8% Asian2,486 71.8% Other race1,350 79.1% Two or more races9,498 86.7% White alone, not Hispanic / Latino2,180 72.4% Hispanic or LatinoMoved within same county 292 2.6% White / Caucasian70 1.3% Black or African American7 6.5% American Indian / Alaska Native8 0.6% Asian108 3.1% Other race8 0.4% Two or more races281 2.6% White alone, not Hispanic / Latino79 2.6% Hispanic or LatinoMoved within same state 911 8.1% White / Caucasian630 11.5% Black or African American1 1.0% American Indian / Alaska Native135 10.5% Asian387 11.2% Other race255 14.9% Two or more races913 8.3% White alone, not Hispanic / Latino381 12.6% Hispanic or LatinoMoved from different state 267 2.4% White / Caucasian304 5.6% Black or African American51 4.0% Asian22 1.3% Two or more races273 2.5% White alone, not Hispanic / LatinoMoved from abroad 30 0.3% White31 0.6% Black or African American26 2.0% Asian307 8.9% Other race30 0.3% White alone, not Hispanic / Latino327 10.9% Hispanic or Latino
Children Nativity (place of birth) in Columbia Heights
Children under 6 years - Living with two parents Both parents native 540 100.0% NativeBoth parents foreign-born 547 94.3% Native33 5.7% Foreign-bornOne native, one foreign-born parent 70 100.0% NativeChildren under 6 years - Living with one parent Native parent 566 100.0% NativeForeign-born parent 117 84.7% Native21 15.3% Foreign-bornChildren 6 to 17 years - Living with two parents Both parents native 298 98.0% Native6 2.0% Foreign-bornBoth parents foreign-born 676 83.0% Native138 17.0% Foreign-bornOne native, one foreign-born parent 209 100.0% NativeChildren 6 to 17 years - Living with one parent Native parent 86 100.0% NativeForeign-born parent 1,118 53.5% Native973 46.5% Foreign-born
Grandparents responsible for own grandchildren in Columbia Heights
Grandparents (30 to 59 years) White / Caucasian 30 100.0% Not responsible for grandchildrenBlack or African American 53 100.0% Responsible for grandchildrenAsian 9 100.0% Not responsible for grandchildrenOther race 7 100.0% Not responsible for grandchildrenWhite alone, not Hispanic / Latino 32 100.0% Not responsible for grandchildrenHispanic or Latino 6 100.0% Not responsible for grandchildrenGrandparents (60 years and over) White / Caucasian 34 33.5% Responsible for grandchildren68 66.5% Not responsible for grandchildrenBlack or African American 8 100.0% Not responsible for grandchildrenAsian 30 100.0% Not responsible for grandchildrenOther race 21 100.0% Not responsible for grandchildrenWhite alone, not Hispanic / Latino 34 33.5% Responsible for grandchildren68 66.5% Not responsible for grandchildrenHispanic or Latino 19 100.0% Not responsible for grandchildren