Races in Columbia, Missouri (MO) Detailed Stats
Data:
Races - White alone (%)
Races - White alone (% change since 2000)
Races - Black alone (%)
Races - Black alone (% change since 2000)
Races - American Indian alone (%)
Races - American Indian alone (% change since 2000)
Races - Asian alone (%)
Races - Asian alone (% change since 2000)
Races - Hispanic (%)
Races - Hispanic (% change since 2000)
Races - Native Hawaiian and Other Pacific Islander alone (%)
Races - Native Hawaiian and Other Pacific Islander alone (% change since 2000)
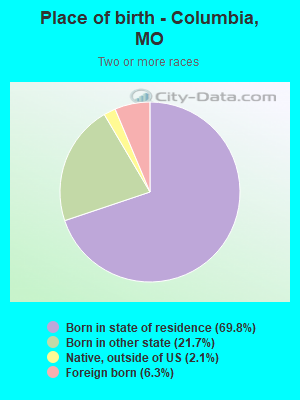
Races - Two or more races(%)
Races - Two or more races(% change since 2000)
Races - Other race alone (%)
Races - Other race alone (% change since 2000)
Racial diversity
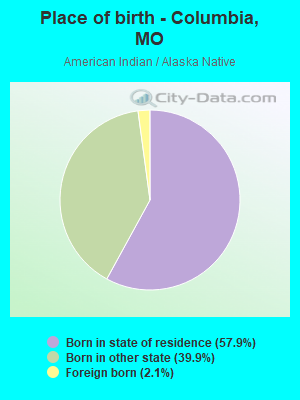
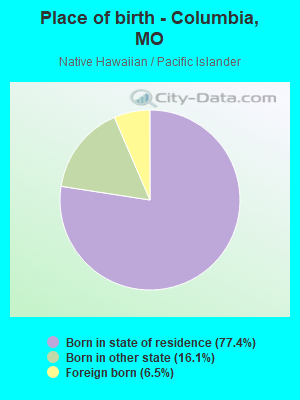
Place of birth - Born in state of residence (%)
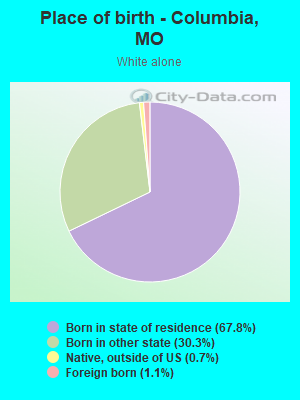
Place of birth - Born in state of residence (%) - White
Place of birth - Born in state of residence (%) - Black or African American
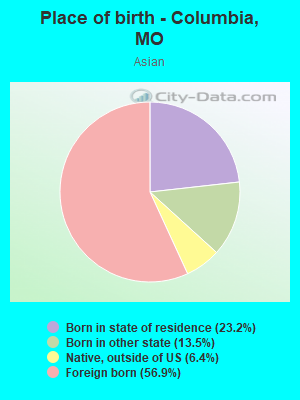
Place of birth - Born in state of residence (%) - Asian
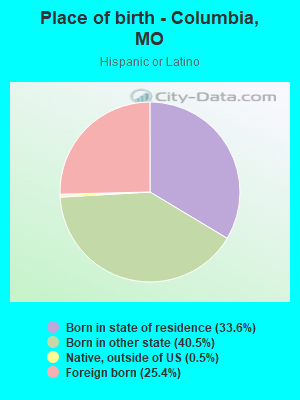
Place of birth - Born in state of residence (%) - Hispanic or Latino
Place of birth - Born in state of residence (%) - American Indian and Alaska Native
Place of birth - Born in state of residence (%) - Multirace
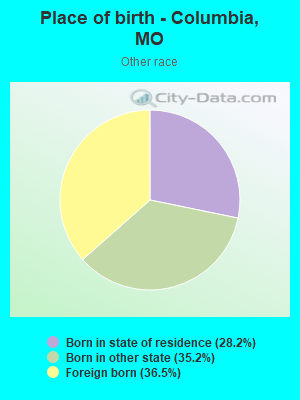
Place of birth - Born in state of residence (%) - Other Race
Place of birth - Born in other state (%)
Place of birth - Born in other state (%) - White
Place of birth - Born in other state (%) - Black or African American
Place of birth - Born in other state (%) - Asian
Place of birth - Born in other state (%) - Hispanic or Latino
Place of birth - Born in other state (%) - American Indian and Alaska Native
Place of birth - Born in other state (%) - Multirace
Place of birth - Born in other state (%) - Other Race
Place of birth - Native, outside of US (%)
Place of birth - Native, outside of US (%) - White
Place of birth - Native, outside of US (%) - Black or African American
Place of birth - Native, outside of US (%) - Asian
Place of birth - Native, outside of US (%) - Hispanic or Latino
Place of birth - Native, outside of US (%) - American Indian and Alaska Native
Place of birth - Native, outside of US (%) - Multirace
Place of birth - Native, outside of US (%) - Other Race
Place of birth - Foreign born (%)
Place of birth - Foreign born (%) - White
Place of birth - Foreign born (%) - Black or African American
Place of birth - Foreign born (%) - Asian
Place of birth - Foreign born (%) - Hispanic or Latino
Place of birth - Foreign born (%) - American Indian and Alaska Native
Place of birth - Foreign born (%) - Multirace
Place of birth - Foreign born (%) - Other Race
Residents speaking English at home (%)
Residents speaking English at home - Born in the United States (%)
Residents speaking English at home - Native, born elsewhere (%)
Residents speaking English at home - Foreign born (%)
Residents speaking Spanish at home (%)
Residents speaking Spanish at home - Born in the United States (%)
Residents speaking Spanish at home - Native, born elsewhere (%)
Residents speaking Spanish at home - Foreign born (%)
Residents speaking other language at home (%)
Residents speaking other language at home - Born in the United States (%)
Residents speaking other language at home - Native, born elsewhere (%)
Residents speaking other language at home - Foreign born (%)
Marital status - Never married (%)
Marital status - Now married (%)
Marital status - Separated (%)
Marital status - Widowed (%)
Marital status - Divorced (%)
Ancestries Reported - Arab (%)
Ancestries Reported - Czech (%)
Ancestries Reported - Danish (%)
Ancestries Reported - Dutch (%)
Ancestries Reported - English (%)
Ancestries Reported - French (%)
Ancestries Reported - French Canadian (%)
Ancestries Reported - German (%)
Ancestries Reported - Greek (%)
Ancestries Reported - Hungarian (%)
Ancestries Reported - Irish (%)
Ancestries Reported - Italian (%)
Ancestries Reported - Lithuanian (%)
Ancestries Reported - Norwegian (%)
Ancestries Reported - Polish (%)
Ancestries Reported - Portuguese (%)
Ancestries Reported - Russian (%)
Ancestries Reported - Scotch-Irish (%)
Ancestries Reported - Scottish (%)
Ancestries Reported - Slovak (%)
Ancestries Reported - Subsaharan African (%)
Ancestries Reported - Swedish (%)
Ancestries Reported - Swiss (%)
Ancestries Reported - Ukrainian (%)
Ancestries Reported - United States (%)
Ancestries Reported - Welsh (%)
Ancestries Reported - West Indian (%)
Ancestries Reported - Other (%)
Geographical mobility - Same house 1 year ago (%)
Geographical mobility - Same house 1 year ago (%) - White
Geographical mobility - Same house 1 year ago (%) - Black or African American
Geographical mobility - Same house 1 year ago (%) - Asian
Geographical mobility - Same house 1 year ago (%) - Hispanic or Latino
Geographical mobility - Same house 1 year ago (%) - American Indian and Alaska Native
Geographical mobility - Same house 1 year ago (%) - Multirace
Geographical mobility - Same house 1 year ago (%) - Other Race
Geographical mobility - Moved within same county (%)
Geographical mobility - Moved within same county (%) - White
Geographical mobility - Moved within same county (%) - Black or African American
Geographical mobility - Moved within same county (%) - Asian
Geographical mobility - Moved within same county (%) - Hispanic or Latino
Geographical mobility - Moved within same county (%) - American Indian and Alaska Native
Geographical mobility - Moved within same county (%) - Multirace
Geographical mobility - Moved within same county (%) - Other Race
Geographical mobility - Moved from different county within same state (%)
Geographical mobility - Moved from different county within same state (%) - White
Geographical mobility - Moved from different county within same state (%) - Black or African American
Geographical mobility - Moved from different county within same state (%) - Asian
Geographical mobility - Moved from different county within same state (%) - Hispanic or Latino
Geographical mobility - Moved from different county within same state (%) - American Indian and Alaska Native
Geographical mobility - Moved from different county within same state (%) - Multirace
Geographical mobility - Moved from different county within same state (%) - Other Race
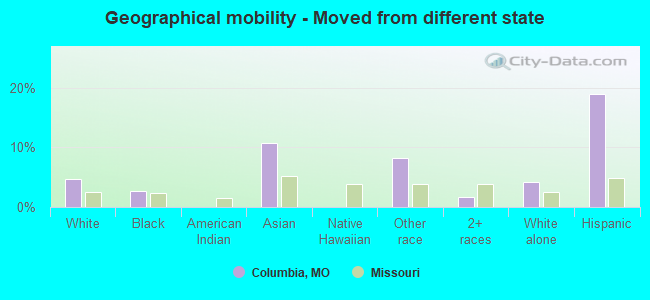
Geographical mobility - Moved from different state (%)
Geographical mobility - Moved from different state (%) - White
Geographical mobility - Moved from different state (%) - Black or African American
Geographical mobility - Moved from different state (%) - Asian
Geographical mobility - Moved from different state (%) - Hispanic or Latino
Geographical mobility - Moved from different state (%) - American Indian and Alaska Native
Geographical mobility - Moved from different state (%) - Multirace
Geographical mobility - Moved from different state (%) - Other Race
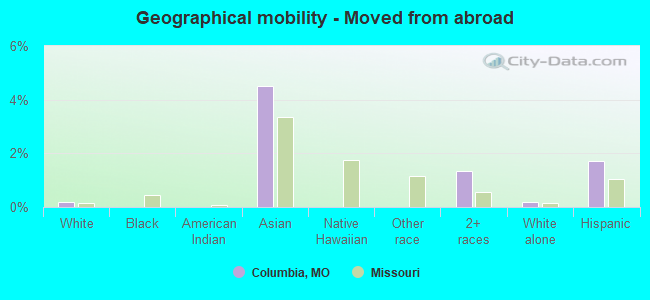
Geographical mobility - Moved from abroad (%)
Geographical mobility - Moved from abroad (%) - White
Geographical mobility - Moved from abroad (%) - Black or African American
Geographical mobility - Moved from abroad (%) - Asian
Geographical mobility - Moved from abroad (%) - Hispanic or Latino
Geographical mobility - Moved from abroad (%) - American Indian and Alaska Native
Geographical mobility - Moved from abroad (%) - Multirace
Geographical mobility - Moved from abroad (%) - Other Race
Place of birth for the foreign-born population - Ireland (%)
Place of birth for the foreign-born population - Denmark (%)
Place of birth for the foreign-born population - Norway (%)
Place of birth for the foreign-born population - Sweden (%)
Place of birth for the foreign-born population - United Kingdom (%)
Place of birth for the foreign-born population - England (%)
Place of birth for the foreign-born population - Scotland (%)
Place of birth for the foreign-born population - Other Northern Europe (%)
Place of birth for the foreign-born population - Austria (%)
Place of birth for the foreign-born population - Belgium (%)
Place of birth for the foreign-born population - France (%)
Place of birth for the foreign-born population - Germany (%)
Place of birth for the foreign-born population - Netherlands (%)
Place of birth for the foreign-born population - Switzerland (%)
Place of birth for the foreign-born population - Other Western Europe (%)
Place of birth for the foreign-born population - Greece (%)
Place of birth for the foreign-born population - Italy (%)
Place of birth for the foreign-born population - Portugal (%)
Place of birth for the foreign-born population - Spain (%)
Place of birth for the foreign-born population - Other Southern Europe (%)
Place of birth for the foreign-born population - Albania (%)
Place of birth for the foreign-born population - Belarus (%)
Place of birth for the foreign-born population - Bosnia and Herzegovina (%)
Place of birth for the foreign-born population - Bulgaria (%)
Place of birth for the foreign-born population - Croatia (%)
Place of birth for the foreign-born population - Czechoslovakia (%)
Place of birth for the foreign-born population - Hungary (%)
Place of birth for the foreign-born population - Latvia (%)
Place of birth for the foreign-born population - Lithuania (%)
Place of birth for the foreign-born population - North Macedonia (Macedonia) (%)
Place of birth for the foreign-born population - Moldova (%)
Place of birth for the foreign-born population - Poland (%)
Place of birth for the foreign-born population - Romania (%)
Place of birth for the foreign-born population - Russia (%)
Place of birth for the foreign-born population - Serbia (%)
Place of birth for the foreign-born population - Ukraine (%)
Place of birth for the foreign-born population - Other Eastern Europe (%)
Place of birth for the foreign-born population - China (%)
Place of birth for the foreign-born population - Hong Kong (%)
Place of birth for the foreign-born population - Taiwan (%)
Place of birth for the foreign-born population - Japan (%)
Place of birth for the foreign-born population - Korea (%)
Place of birth for the foreign-born population - Other Eastern Asia (%)
Place of birth for the foreign-born population - Afghanistan (%)
Place of birth for the foreign-born population - Bangladesh (%)
Place of birth for the foreign-born population - India (%)
Place of birth for the foreign-born population - Iran (%)
Place of birth for the foreign-born population - Kazakhstan (%)
Place of birth for the foreign-born population - Nepal (%)
Place of birth for the foreign-born population - Pakistan (%)
Place of birth for the foreign-born population - Sri Lanka (%)
Place of birth for the foreign-born population - Uzbekistan (%)
Place of birth for the foreign-born population - Other South Central Asia (%)
Place of birth for the foreign-born population - Burma (%)
Place of birth for the foreign-born population - Cambodia (%)
Place of birth for the foreign-born population - Indonesia (%)
Place of birth for the foreign-born population - Laos (%)
Place of birth for the foreign-born population - Malaysia (%)
Place of birth for the foreign-born population - Philippines (%)
Place of birth for the foreign-born population - Singapore (%)
Place of birth for the foreign-born population - Thailand (%)
Place of birth for the foreign-born population - Vietnam (%)
Place of birth for the foreign-born population - Other South Eastern Asia (%)
Place of birth for the foreign-born population - Armenia (%)
Place of birth for the foreign-born population - Iraq (%)
Place of birth for the foreign-born population - Israel (%)
Place of birth for the foreign-born population - Jordan (%)
Place of birth for the foreign-born population - Kuwait (%)
Place of birth for the foreign-born population - Lebanon (%)
Place of birth for the foreign-born population - Saudi Arabia (%)
Place of birth for the foreign-born population - Syria (%)
Place of birth for the foreign-born population - Turkey (%)
Place of birth for the foreign-born population - Yemen (%)
Place of birth for the foreign-born population - Other Western Asia (%)
Place of birth for the foreign-born population - Eritrea (%)
Place of birth for the foreign-born population - Ethiopia (%)
Place of birth for the foreign-born population - Kenya (%)
Place of birth for the foreign-born population - Somalia (%)
Place of birth for the foreign-born population - Uganda (%)
Place of birth for the foreign-born population - Zimbabwe (%)
Place of birth for the foreign-born population - Other Eastern Africa (%)
Place of birth for the foreign-born population - Cameroon (%)
Place of birth for the foreign-born population - Congo (%)
Place of birth for the foreign-born population - Democratic Republic of Congo (Zaire) (%)
Place of birth for the foreign-born population - Other Middle Africa (%)
Place of birth for the foreign-born population - Egypt (%)
Place of birth for the foreign-born population - Morocco (%)
Place of birth for the foreign-born population - Sudan (%)
Place of birth for the foreign-born population - Other Northern Africa (%)
Place of birth for the foreign-born population - South Africa (%)
Place of birth for the foreign-born population - Other Southern Africa (%)
Place of birth for the foreign-born population - Cabo Verde (%)
Place of birth for the foreign-born population - Ghana (%)
Place of birth for the foreign-born population - Liberia (%)
Place of birth for the foreign-born population - Nigeria (%)
Place of birth for the foreign-born population - Senegal (%)
Place of birth for the foreign-born population - Sierra Leone (%)
Place of birth for the foreign-born population - Other Western Africa (%)
Place of birth for the foreign-born population - Australia (%)
Place of birth for the foreign-born population - New Zealand (%)
Place of birth for the foreign-born population - Fiji (%)
Place of birth for the foreign-born population - Micronesia (%)
Place of birth for the foreign-born population - Bahamas (%)
Place of birth for the foreign-born population - Barbados (%)
Place of birth for the foreign-born population - Cuba (%)
Place of birth for the foreign-born population - Dominica (%)
Place of birth for the foreign-born population - Dominican Republic (%)
Place of birth for the foreign-born population - Grenada (%)
Place of birth for the foreign-born population - Haiti (%)
Place of birth for the foreign-born population - Jamaica (%)
Place of birth for the foreign-born population - St. Vincent and the Grenadines (%)
Place of birth for the foreign-born population - Trinidad and Tobago (%)
Place of birth for the foreign-born population - West Indies (%)
Place of birth for the foreign-born population - Other Caribbean (%)
Place of birth for the foreign-born population - Belize (%)
Place of birth for the foreign-born population - Costa Rica (%)
Place of birth for the foreign-born population - El Salvador (%)
Place of birth for the foreign-born population - Guatemala (%)
Place of birth for the foreign-born population - Honduras (%)
Place of birth for the foreign-born population - Mexico (%)
Place of birth for the foreign-born population - Nicaragua (%)
Place of birth for the foreign-born population - Panama (%)
Place of birth for the foreign-born population - Other Central America (%)
Place of birth for the foreign-born population - Argentina (%)
Place of birth for the foreign-born population - Bolivia (%)
Place of birth for the foreign-born population - Brazil (%)
Place of birth for the foreign-born population - Chile (%)
Place of birth for the foreign-born population - Colombia (%)
Place of birth for the foreign-born population - Ecuador (%)
Place of birth for the foreign-born population - Guyana (%)
Place of birth for the foreign-born population - Peru (%)
Place of birth for the foreign-born population - Uruguay (%)
Place of birth for the foreign-born population - Venezuela (%)
Place of birth for the foreign-born population - Other South America (%)
Place of birth for the foreign-born population - Canada (%)
Place of birth for the foreign-born population - Other Northern America (%)
Place of birth for the foreign-born population - Other (%)
Latest news about races in Columbia, MO collected exclusively by city-data.com from local newspapers, TV, and radio stations
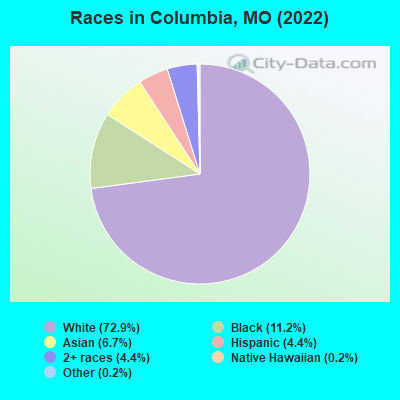
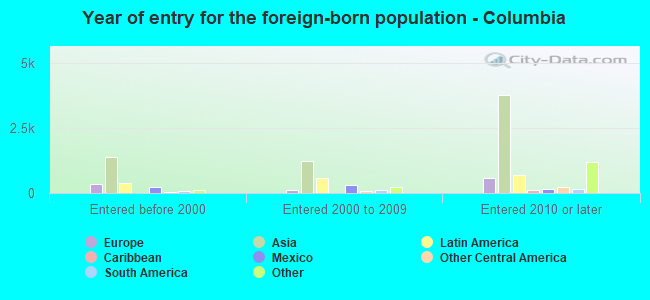
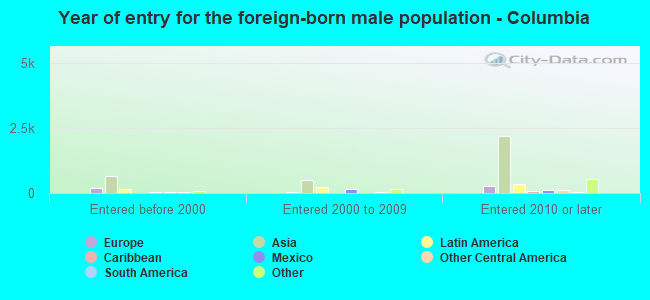
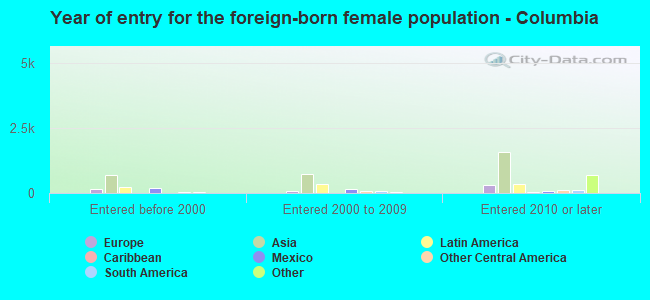
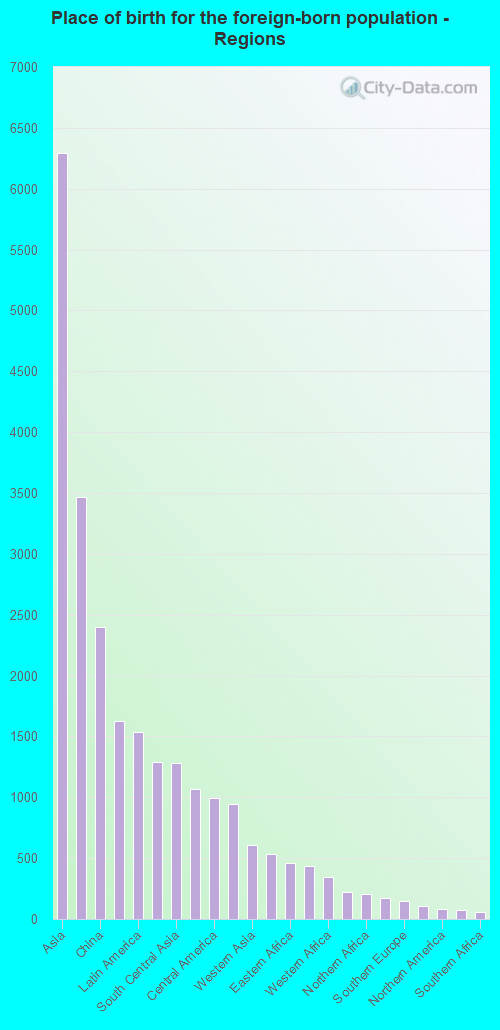
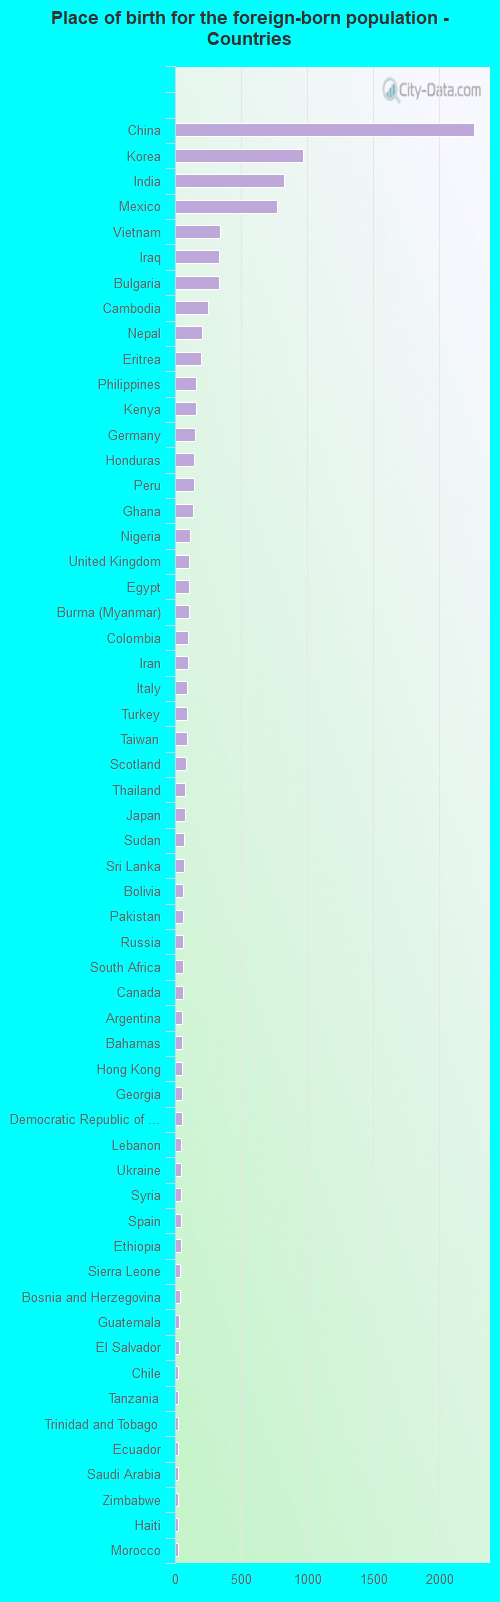
According to 2022 data, the most numerous races in Columbia, MO are White alone (93,771 residents), Black alone (14,365 residents), and Two or more races (5,608 residents). 89.9% of Columbia residents speak English at home. 8.0% of Columbia, MO residents are foreign-born (5.1% born in Asia, 1.2% born in Latin America, 1.0% born in Africa, 0.9% born in Europe), which is 50.0% greater than the foreign-born rate of 4.0% across the entire state of Missouri.
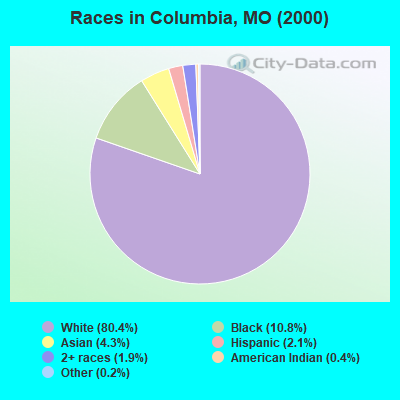
Race distribution in Columbia
2000 2022
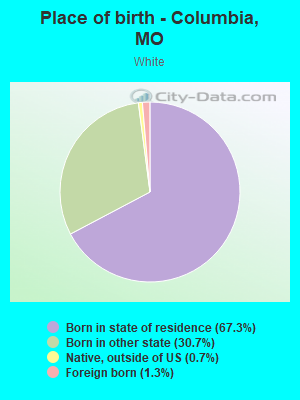
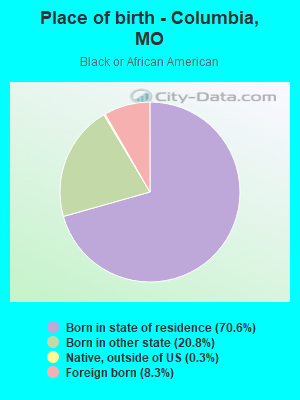
67,984 80.4% White alone 9,106 10.8% Black alone 3,624 4.3% Asian alone 1,733 2.1% Hispanic 1,578 1.9% Two or more races 303 0.4% American Indian alone 174 0.2% Other race alone 29 0.03% Native Hawaiian and Other
93,771 72.9% White alone 14,365 11.2% Black alone 8,551 6.7% Asian alone 5,608 4.4% Two or more races 5,715 4.4% Hispanic 217 0.2% Other race alone 239 0.2% Native Hawaiian and Other 79 0.06% American Indian alone
2000 2022
4,686,474 83.8% White alone 625,667 11.2% Black alone 118,592 2.1% Hispanic 71,905 1.3% Two or more races 61,041 1.1% Asian alone 23,302 0.4% American Indian alone 5,291 0.09% Other race alone 2,939 0.05% Native Hawaiian and Other
4,733,411 76.6% White alone 656,739 10.6% Black alone 316,300 5.1% Two or more races 291,763 4.7% Hispanic 132,436 2.1% Asian alone 27,467 0.4% Other race alone 12,313 0.2% American Indian alone 7,528 0.1% Native Hawaiian and Other
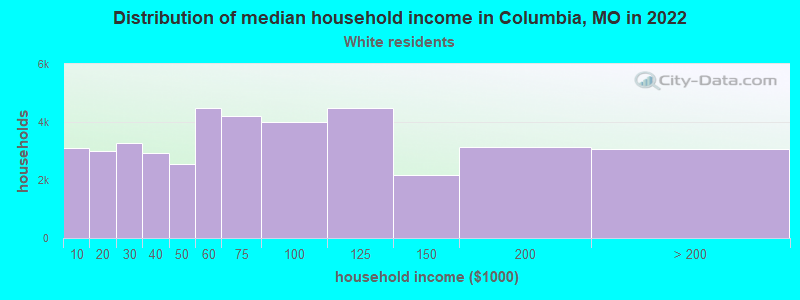
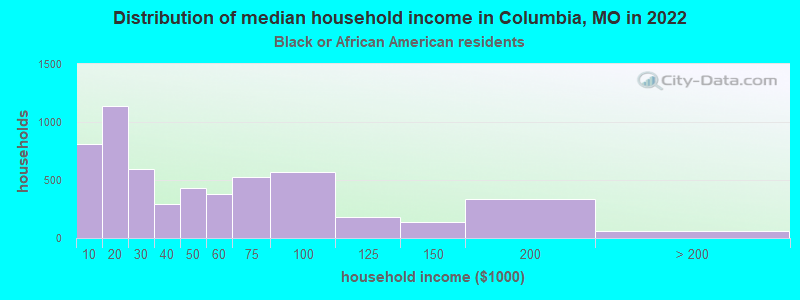
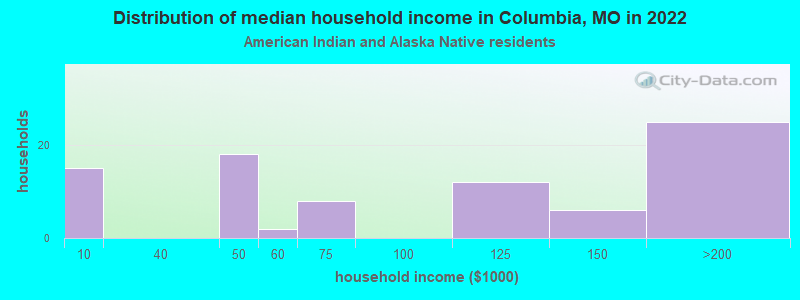
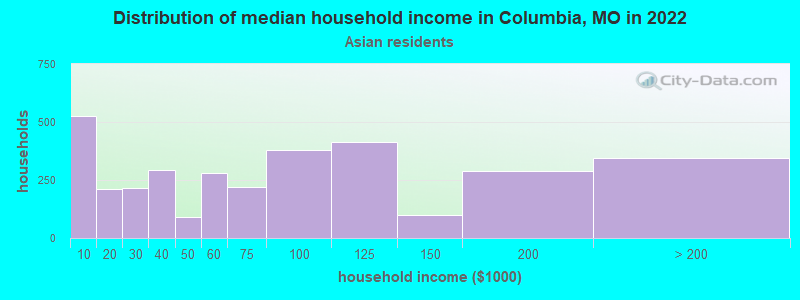
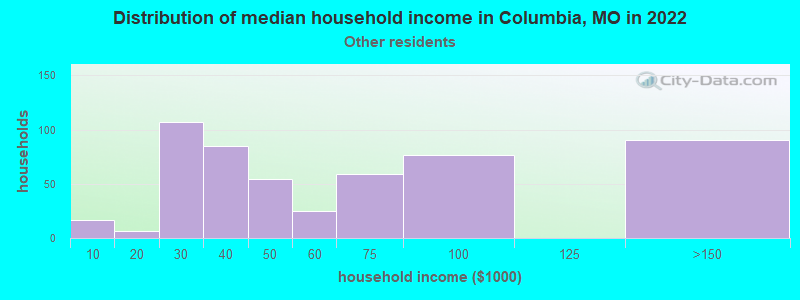
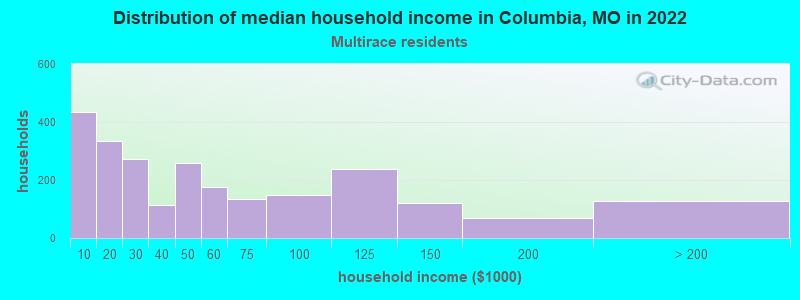
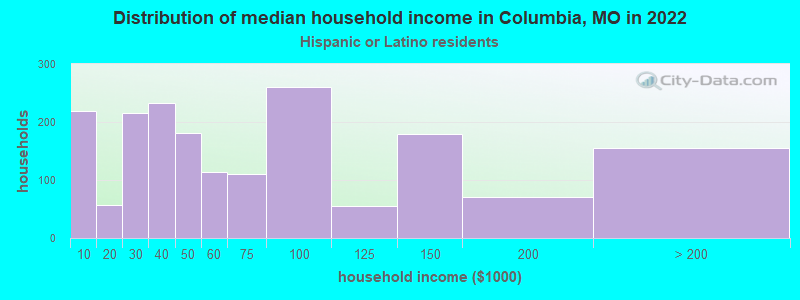
Income and house value in Columbia Median household income in 2022 $63,784 White non-Hispanic householders$35,000 Black householders$78,042 Asian householders$37,165 Some other race householders$49,063 Two or more races householders$49,459 Hispanic or Latino race householdersMedian 2022 house value $295,125 White Non-Hispanic householders$189,547 Black or African American householders$330,235 American Indian or Alaska Native householders $340,056 Asian householders$368,292 Some other race householders$404,139 Two or more races householders$296,598 Hispanic or Latino householders
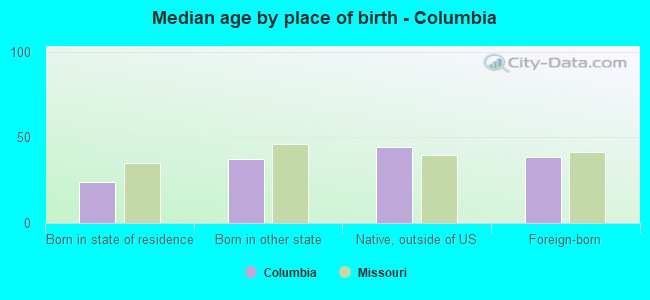
Median age by race in Columbia
30.2 Median age for White residents30.2 30.0 26.5 Median age for Black or African American residents26.6 26.4 33.3 Median age for American Indian / Alaska Native residents33.3 -666,666,666.0 28.3 Median age for Asian residents29.7 26.2 19.6 Median age for Native Hawaiian / Pacific Islander residents-666,666,666.0 -666,666,666.0 30.5 Median age for Other race residents34.4 30.1 20.4 Median age for Two or more races residents19.7 21.1 30.4 Median age for White alone residents30.4 30.5 24.0 Median age for Hispanic or Latino residents27.5 23.5
Owner/renter occupied households by race in Columbia
House owners and renters - White residents 21,961 54.4% Owner occupied18,411 45.6% Renter occupiedHouse owners and renters - Black or African American residents 991 16.9% Owner occupied4,873 83.1% Renter occupiedHouse owners and renters - American Indian / Alaska Native residents 41 58.2% Owner occupied30 41.8% Renter occupiedHouse owners and renters - Asian residents 1,370 40.9% Owner occupied1,982 59.1% Renter occupiedHouse owners and renters - Native Hawaiian / Pacific Islander residents 5 100.0% Renter occupiedHouse owners and renters - Other race residents 496 50.3% Owner occupied491 49.7% Renter occupiedHouse owners and renters - Two or more races residents 971 42.4% Owner occupied1,318 57.6% Renter occupiedHouse owners and renters - White alone residents 21,782 54.5% Owner occupied18,188 45.5% Renter occupiedHouse owners and renters - Hispanic or Latino residents 996 54.1% Owner occupied846 45.9% Renter occupied
Language usage in Columbia
English speakers - Total 89.9% of residents of Columbia speak English at home.
2.9% of residents speak Spanish at home 2,773 78.2% Speak English very well771 21.8% Speak English less than very well7.2% of residents speak other language at home 5,313 60.3% Speak English very well3,501 39.7% Speak English less than very well
English speakers - Born in the United States 95.7% of residents of Columbia speak English at home.
2.1% of residents speak Spanish at home 718 100.0% Speak English very well2.3% of residents speak other language at home 738 93.3% Speak English very well53 6.7% Speak English less than very well
English speakers - Native, born elsewhere 56.2% of residents of Columbia speak English at home.
2.0% of residents speak Spanish at home 29 100.0% Speak English very well41.8% of residents speak other language at home 372 62.2% Speak English very well226 37.8% Speak English less than very well
English speakers - Foreign-born 16.6% of residents of Columbia speak English at home.
12.4% of residents speak Spanish at home 701 65.5% Speak English very well370 34.5% Speak English less than very well71.0% of residents speak other language at home 3,455 56.5% Speak English very well2,656 43.5% Speak English less than very well
White (Caucasian) - Speak only English Native:
98.0% (89,323)Foreign-born:
20.9% (269)
White (Caucasian) - Speak another language Native:
2.0% (1,804)Foreign-born:
79.1% (1,019)
Black or African American - Speak only English Native:
94.7% (10,955)Foreign-born:
14.3% (181)
Black or African American - Speak another language Native:
5.8% (670)Foreign-born:
85.6% (1,081)
Asian - Speak only English Native:
57.1% (1,757)Foreign-born:
15.2% (737)
Asian - Speak another language Native:
42.9% (1,320)Foreign-born:
84.8% (4,125)
Other race - Speak another language Native:
55.6% (731)Foreign-born:
100.0% (796)
Two or more races - Speak only English Native:
87.1% (5,561)Foreign-born:
44.1% (317)
Two or more races - Speak another language Native:
13.0% (828)Foreign-born:
55.2% (397)
White alone - Speak only English Native:
98.6% (88,685)Foreign-born:
25.4% (269)
White alone - Speak another language Native:
1.4% (1,304)Foreign-born:
74.6% (789)
Hispanic or Latino - Speak only English Native:
62.3% (2,170)Foreign-born:
13.6% (198)
Hispanic or Latino - Speak another language Native:
37.7% (1,311)Foreign-born:
86.4% (1,253)
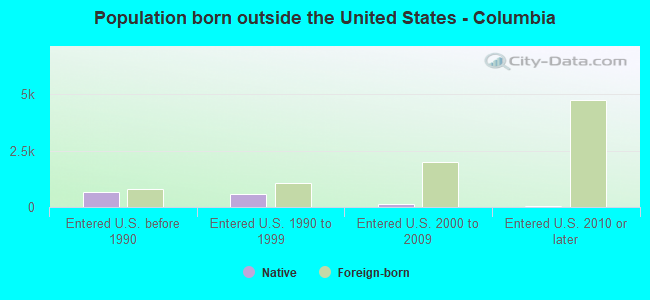
Foreign-born residents in Columbia 10,295 residents are foreign born (5.1% Asia , 1.2% Latin America , 1.0% Africa , 0.9% Europe ).
This city:
8.0%Missouri:
4.2%
Marital status for residents in Columbia Marital status - White (Caucasian) population 15 years and over
Males 51.6% Never married39.6% Now married0.9% Separated2.0% Widowed5.9% DivorcedFemales 52.8% Never married31.9% Now married0.2% Separated5.1% Widowed10.0% DivorcedWomen who gave birth in the past 12 months Now married:
100.0% (800)Unmarried:
0.0% (0)
Women who did not give birth in the past 12 months Now married:
25.0% (7,467)Unmarried:
75.0% (22,446)
Marital status - Black or African American population 15 years and over
Males 58.1% Never married37.7% Now married1.0% Separated0.6% Widowed2.6% DivorcedFemales 67.5% Never married18.6% Now married0.0% Separated1.1% Widowed12.7% DivorcedWomen who gave birth in the past 12 months Now married:
37.8% (120)Unmarried:
62.2% (198)
Women who did not give birth in the past 12 months Now married:
18.7% (776)Unmarried:
81.3% (3,378)
Marital status - American Indian / Alaska Native population 15 years and over
Males 37.5% Never married62.5% Now married0.0% Separated0.0% Widowed0.0% DivorcedFemales 43.8% Never married56.2% Now married0.0% Separated0.0% Widowed0.0% DivorcedWomen who did not give birth in the past 12 months Now married:
25.0% (7)Unmarried:
75.0% (21)
Marital status - Asian population 15 years and over
Males 52.7% Never married46.6% Now married0.4% Separated0.0% Widowed0.3% DivorcedFemales 34.4% Never married56.3% Now married0.4% Separated3.4% Widowed5.4% DivorcedWomen who gave birth in the past 12 months Now married:
81.5% (133)Unmarried:
18.5% (30)
Women who did not give birth in the past 12 months Now married:
52.1% (1,368)Unmarried:
47.9% (1,257)
Marital status - Native Hawaiian / Pacific Islander population 15 years and over
Males 0.0% Never married100.0% Now married0.0% Separated0.0% Widowed0.0% DivorcedFemales 100.0% Never married0.0% Now married0.0% Separated0.0% Widowed0.0% DivorcedWomen who did not give birth in the past 12 months Now married:
0.0% (0)Unmarried:
100.0% (36)
Marital status - Other race population 15 years and over
Males 51.9% Never married47.1% Now married0.0% Separated0.0% Widowed1.1% DivorcedFemales 57.5% Never married32.2% Now married5.9% Separated0.0% Widowed4.4% DivorcedWomen who did not give birth in the past 12 months Now married:
35.8% (209)Unmarried:
64.2% (375)
Marital status - Two or more races population 15 years and over
Males 72.4% Never married22.5% Now married0.0% Separated0.0% Widowed5.1% DivorcedFemales 59.1% Never married28.5% Now married0.7% Separated2.5% Widowed9.2% DivorcedWomen who gave birth in the past 12 months Now married:
23.9% (23)Unmarried:
76.1% (75)
Women who did not give birth in the past 12 months Now married:
33.4% (871)Unmarried:
66.6% (1,733)
Marital status - White alone, not Hispanic / Latino population 15 years and over
Males 51.6% Never married39.6% Now married0.9% Separated2.0% Widowed5.8% DivorcedFemales 52.8% Never married31.8% Now married0.2% Separated5.2% Widowed10.0% DivorcedWomen who gave birth in the past 12 months Now married:
100.0% (800)Unmarried:
0.0% (0)
Women who did not give birth in the past 12 months Now married:
24.8% (7,322)Unmarried:
75.2% (22,207)
Marital status - Hispanic or Latino population 15 years and over
Males 51.5% Never married42.9% Now married0.0% Separated0.6% Widowed5.0% DivorcedFemales 51.3% Never married38.1% Now married4.0% Separated0.9% Widowed5.7% DivorcedWomen who gave birth in the past 12 months Now married:
74.4% (64)Unmarried:
25.6% (22)
Women who did not give birth in the past 12 months Now married:
41.0% (706)Unmarried:
59.0% (1,015)
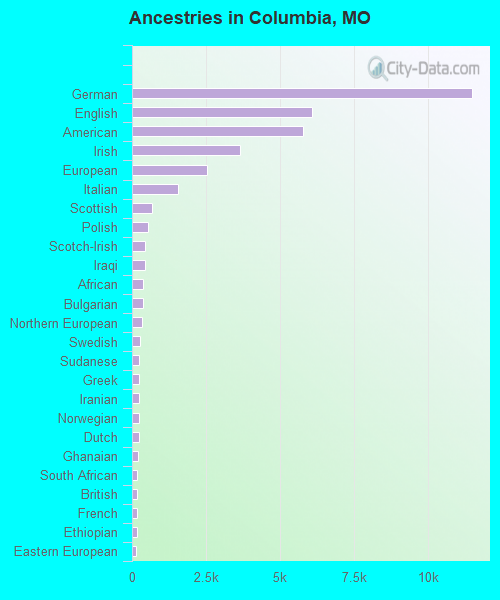
Ancestries in Columbia
11,498 19.4% German6,083 10.2% English5,766 9.7% American3,658 6.2% Irish2,536 4.3% European1,549 2.6% Italian681 1.1% Scottish528 0.9% Polish441 0.7% Scotch-Irish428 0.7% Iraqi375 0.6% African361 0.6% Bulgarian322 0.5% Northern European255 0.4% Swedish248 0.4% Sudanese244 0.4% Greek240 0.4% Iranian226 0.4% Norwegian225 0.4% Dutch219 0.4% Ghanaian184 0.3% South African177 0.3% British172 0.3% French162 0.3% Ethiopian147 0.2% Eastern European144 0.2% Hungarian140 0.2% Russian139 0.2% Czech137 0.2% Scandinavian123 0.2% Ukrainian115 0.2% Lebanese105 0.2% Nigerian101 0.2% Romanian100 0.2% Jamaican86 0.1% Welsh84 0.1% French Canadian82 0.1% Haitian79 0.1% Belgian77 0.1% Turkish71 0.1% Kenyan68 0.1% Syrian47 0.08% Egyptian47 0.08% Lithuanian41 0.07% Danish33 0.06% Israeli32 0.05% Sierra Leonean31 0.05% Australian31 0.05% Albanian25 0.04% Arab25 0.04% Yugoslavian24 0.04% Cajun23 0.04% Croatian22 0.04% Finnish21 0.04% Trinidadian and Tobagonian19 0.03% Armenian19 0.03% Moroccan16 0.03% Slovak14 0.02% Czechoslovakian14 0.02% Swiss11 0.02% Jordanian9 0.02% Assyrian9 0.02% Canadian8 0.01% Slovene6 0.01% Celtic6 0.01% Brazilian5 0.01% Zimbabwean4 0.01% New Zealander4 0.01% Portuguese
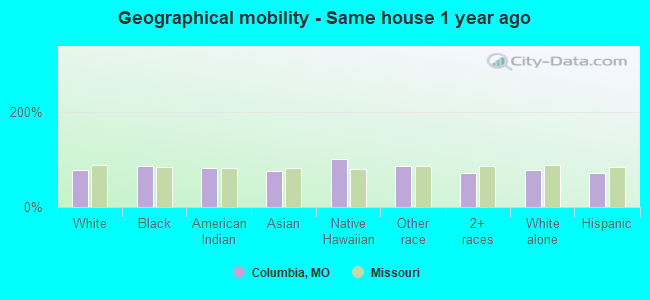
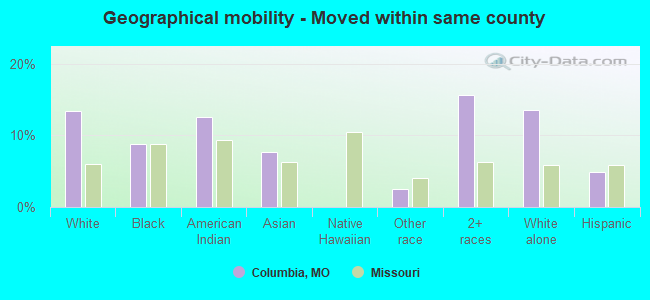
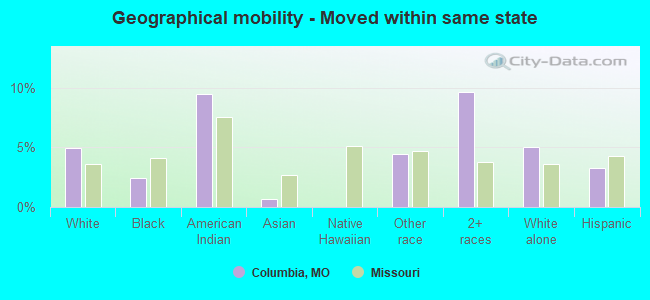
Geographical mobility in Columbia Same house 1 year ago 72,755 76.7% White (Caucasian)12,398 86.1% Black or African American154 80.8% American Indian / Alaska Native6,525 76.3% Asian75 100.0% Native Hawaiian / Pacific Islander1,263 85.3% Other race5,305 71.9% Two or more races71,664 77.0% White alone, not Hispanic / Latino4,065 71.1% Hispanic or LatinoMoved within same county 12,799 13.5% White / Caucasian1,277 8.9% Black or African American24 12.6% American Indian / Alaska Native661 7.7% Asian37 2.5% Other race1,151 15.6% Two or more races12,662 13.6% White alone, not Hispanic / Latino281 4.9% Hispanic or LatinoMoved within same state 4,667 4.9% White / Caucasian348 2.4% Black or African American18 9.5% American Indian / Alaska Native55 0.6% Asian66 4.4% Other race710 9.6% Two or more races4,667 5.0% White alone, not Hispanic / Latino188 3.3% Hispanic or LatinoMoved from different state 4,520 4.8% White / Caucasian379 2.6% Black or African American923 10.8% Asian120 8.1% Other race118 1.6% Two or more races3,853 4.1% White alone, not Hispanic / Latino1,082 18.9% Hispanic or LatinoMoved from abroad 172 0.2% White387 4.5% Asian99 1.3% Two or more races172 0.2% White alone, not Hispanic / Latino99 1.7% Hispanic or Latino
Children Nativity (place of birth) in Columbia
Children under 6 years - Living with two parents Both parents native 4,636 99.8% Native7 0.2% Foreign-bornBoth parents foreign-born 518 92.8% Native40 7.2% Foreign-bornOne native, one foreign-born parent 192 100.0% NativeChildren under 6 years - Living with one parent Native parent 2,085 100.0% NativeForeign-born parent 102 46.1% Native119 53.9% Foreign-bornChildren 6 to 17 years - Living with two parents Both parents native 9,054 99.4% Native56 0.6% Foreign-bornBoth parents foreign-born 581 57.0% Native438 43.0% Foreign-bornOne native, one foreign-born parent 627 100.0% NativeChildren 6 to 17 years - Living with one parent Native parent 3,894 100.0% NativeForeign-born parent 250 53.0% Native221 47.0% Foreign-born
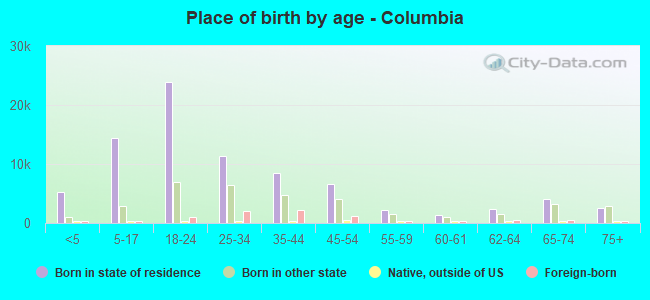
Place of birth for residents in Columbia
Grandparents responsible for own grandchildren in Columbia
Grandparents (30 to 59 years) White / Caucasian 81 19.3% Responsible for grandchildren341 80.7% Not responsible for grandchildrenBlack or African American 75 81.2% Responsible for grandchildren17 18.8% Not responsible for grandchildrenAsian 138 100.0% Responsible for grandchildrenTwo or more races 9 100.0% Not responsible for grandchildrenWhite alone, not Hispanic / Latino 82 19.4% Responsible for grandchildren341 80.6% Not responsible for grandchildrenGrandparents (60 years and over) White / Caucasian 145 33.6% Responsible for grandchildren287 66.4% Not responsible for grandchildrenBlack or African American 38 38.5% Responsible for grandchildren60 61.5% Not responsible for grandchildrenAsian 165 100.0% Not responsible for grandchildrenWhite alone, not Hispanic / Latino 145 33.6% Responsible for grandchildren287 66.4% Not responsible for grandchildren