Races in Columbus, Indiana (IN) Detailed Stats
Data:
Races - White alone (%)
Races - White alone (% change since 2000)
Races - Black alone (%)
Races - Black alone (% change since 2000)
Races - American Indian alone (%)
Races - American Indian alone (% change since 2000)
Races - Asian alone (%)
Races - Asian alone (% change since 2000)
Races - Hispanic (%)
Races - Hispanic (% change since 2000)
Races - Native Hawaiian and Other Pacific Islander alone (%)
Races - Native Hawaiian and Other Pacific Islander alone (% change since 2000)
Races - Two or more races(%)
Races - Two or more races(% change since 2000)
Races - Other race alone (%)
Races - Other race alone (% change since 2000)
Racial diversity
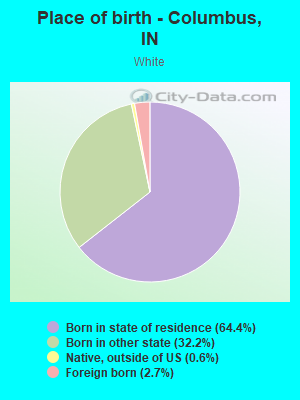
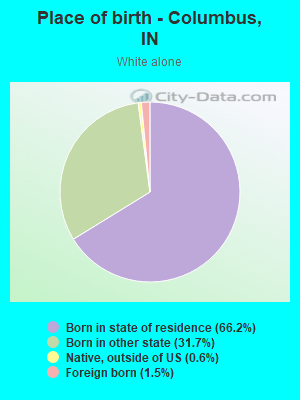
Place of birth - Born in state of residence (%)
Place of birth - Born in state of residence (%) - White
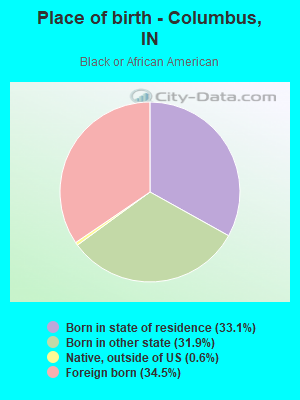
Place of birth - Born in state of residence (%) - Black or African American
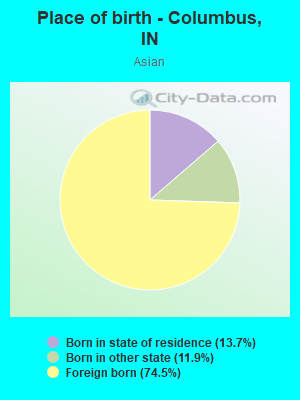
Place of birth - Born in state of residence (%) - Asian
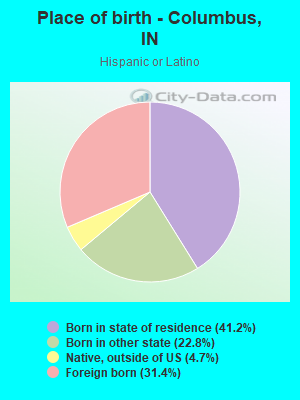
Place of birth - Born in state of residence (%) - Hispanic or Latino
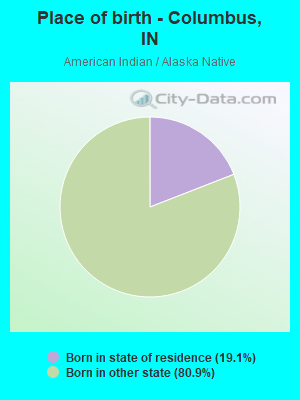
Place of birth - Born in state of residence (%) - American Indian and Alaska Native
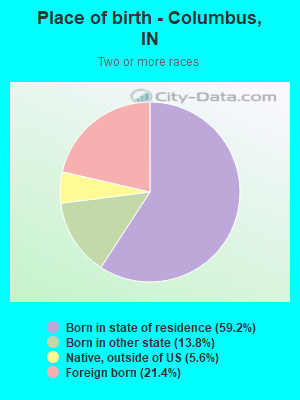
Place of birth - Born in state of residence (%) - Multirace
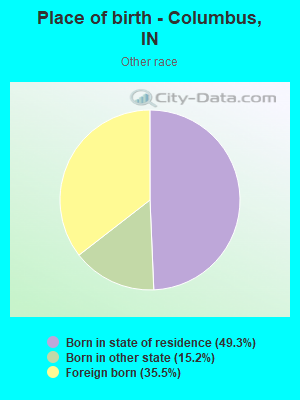
Place of birth - Born in state of residence (%) - Other Race
Place of birth - Born in other state (%)
Place of birth - Born in other state (%) - White
Place of birth - Born in other state (%) - Black or African American
Place of birth - Born in other state (%) - Asian
Place of birth - Born in other state (%) - Hispanic or Latino
Place of birth - Born in other state (%) - American Indian and Alaska Native
Place of birth - Born in other state (%) - Multirace
Place of birth - Born in other state (%) - Other Race
Place of birth - Native, outside of US (%)
Place of birth - Native, outside of US (%) - White
Place of birth - Native, outside of US (%) - Black or African American
Place of birth - Native, outside of US (%) - Asian
Place of birth - Native, outside of US (%) - Hispanic or Latino
Place of birth - Native, outside of US (%) - American Indian and Alaska Native
Place of birth - Native, outside of US (%) - Multirace
Place of birth - Native, outside of US (%) - Other Race
Place of birth - Foreign born (%)
Place of birth - Foreign born (%) - White
Place of birth - Foreign born (%) - Black or African American
Place of birth - Foreign born (%) - Asian
Place of birth - Foreign born (%) - Hispanic or Latino
Place of birth - Foreign born (%) - American Indian and Alaska Native
Place of birth - Foreign born (%) - Multirace
Place of birth - Foreign born (%) - Other Race
Residents speaking English at home (%)
Residents speaking English at home - Born in the United States (%)
Residents speaking English at home - Native, born elsewhere (%)
Residents speaking English at home - Foreign born (%)
Residents speaking Spanish at home (%)
Residents speaking Spanish at home - Born in the United States (%)
Residents speaking Spanish at home - Native, born elsewhere (%)
Residents speaking Spanish at home - Foreign born (%)
Residents speaking other language at home (%)
Residents speaking other language at home - Born in the United States (%)
Residents speaking other language at home - Native, born elsewhere (%)
Residents speaking other language at home - Foreign born (%)
Marital status - Never married (%)
Marital status - Now married (%)
Marital status - Separated (%)
Marital status - Widowed (%)
Marital status - Divorced (%)
Ancestries Reported - Arab (%)
Ancestries Reported - Czech (%)
Ancestries Reported - Danish (%)
Ancestries Reported - Dutch (%)
Ancestries Reported - English (%)
Ancestries Reported - French (%)
Ancestries Reported - French Canadian (%)
Ancestries Reported - German (%)
Ancestries Reported - Greek (%)
Ancestries Reported - Hungarian (%)
Ancestries Reported - Irish (%)
Ancestries Reported - Italian (%)
Ancestries Reported - Lithuanian (%)
Ancestries Reported - Norwegian (%)
Ancestries Reported - Polish (%)
Ancestries Reported - Portuguese (%)
Ancestries Reported - Russian (%)
Ancestries Reported - Scotch-Irish (%)
Ancestries Reported - Scottish (%)
Ancestries Reported - Slovak (%)
Ancestries Reported - Subsaharan African (%)
Ancestries Reported - Swedish (%)
Ancestries Reported - Swiss (%)
Ancestries Reported - Ukrainian (%)
Ancestries Reported - United States (%)
Ancestries Reported - Welsh (%)
Ancestries Reported - West Indian (%)
Ancestries Reported - Other (%)
Geographical mobility - Same house 1 year ago (%)
Geographical mobility - Same house 1 year ago (%) - White
Geographical mobility - Same house 1 year ago (%) - Black or African American
Geographical mobility - Same house 1 year ago (%) - Asian
Geographical mobility - Same house 1 year ago (%) - Hispanic or Latino
Geographical mobility - Same house 1 year ago (%) - American Indian and Alaska Native
Geographical mobility - Same house 1 year ago (%) - Multirace
Geographical mobility - Same house 1 year ago (%) - Other Race
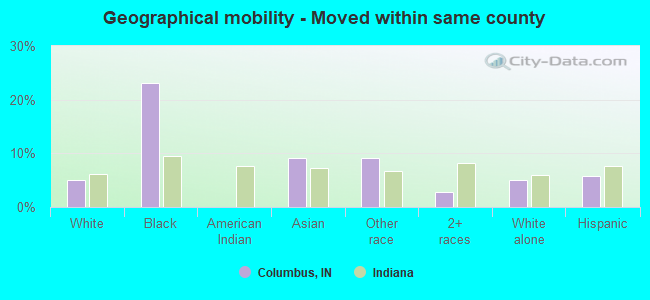
Geographical mobility - Moved within same county (%)
Geographical mobility - Moved within same county (%) - White
Geographical mobility - Moved within same county (%) - Black or African American
Geographical mobility - Moved within same county (%) - Asian
Geographical mobility - Moved within same county (%) - Hispanic or Latino
Geographical mobility - Moved within same county (%) - American Indian and Alaska Native
Geographical mobility - Moved within same county (%) - Multirace
Geographical mobility - Moved within same county (%) - Other Race
Geographical mobility - Moved from different county within same state (%)
Geographical mobility - Moved from different county within same state (%) - White
Geographical mobility - Moved from different county within same state (%) - Black or African American
Geographical mobility - Moved from different county within same state (%) - Asian
Geographical mobility - Moved from different county within same state (%) - Hispanic or Latino
Geographical mobility - Moved from different county within same state (%) - American Indian and Alaska Native
Geographical mobility - Moved from different county within same state (%) - Multirace
Geographical mobility - Moved from different county within same state (%) - Other Race
Geographical mobility - Moved from different state (%)
Geographical mobility - Moved from different state (%) - White
Geographical mobility - Moved from different state (%) - Black or African American
Geographical mobility - Moved from different state (%) - Asian
Geographical mobility - Moved from different state (%) - Hispanic or Latino
Geographical mobility - Moved from different state (%) - American Indian and Alaska Native
Geographical mobility - Moved from different state (%) - Multirace
Geographical mobility - Moved from different state (%) - Other Race
Geographical mobility - Moved from abroad (%)
Geographical mobility - Moved from abroad (%) - White
Geographical mobility - Moved from abroad (%) - Black or African American
Geographical mobility - Moved from abroad (%) - Asian
Geographical mobility - Moved from abroad (%) - Hispanic or Latino
Geographical mobility - Moved from abroad (%) - American Indian and Alaska Native
Geographical mobility - Moved from abroad (%) - Multirace
Geographical mobility - Moved from abroad (%) - Other Race
Place of birth for the foreign-born population - Ireland (%)
Place of birth for the foreign-born population - Denmark (%)
Place of birth for the foreign-born population - Norway (%)
Place of birth for the foreign-born population - Sweden (%)
Place of birth for the foreign-born population - United Kingdom (%)
Place of birth for the foreign-born population - England (%)
Place of birth for the foreign-born population - Scotland (%)
Place of birth for the foreign-born population - Other Northern Europe (%)
Place of birth for the foreign-born population - Austria (%)
Place of birth for the foreign-born population - Belgium (%)
Place of birth for the foreign-born population - France (%)
Place of birth for the foreign-born population - Germany (%)
Place of birth for the foreign-born population - Netherlands (%)
Place of birth for the foreign-born population - Switzerland (%)
Place of birth for the foreign-born population - Other Western Europe (%)
Place of birth for the foreign-born population - Greece (%)
Place of birth for the foreign-born population - Italy (%)
Place of birth for the foreign-born population - Portugal (%)
Place of birth for the foreign-born population - Spain (%)
Place of birth for the foreign-born population - Other Southern Europe (%)
Place of birth for the foreign-born population - Albania (%)
Place of birth for the foreign-born population - Belarus (%)
Place of birth for the foreign-born population - Bosnia and Herzegovina (%)
Place of birth for the foreign-born population - Bulgaria (%)
Place of birth for the foreign-born population - Croatia (%)
Place of birth for the foreign-born population - Czechoslovakia (%)
Place of birth for the foreign-born population - Hungary (%)
Place of birth for the foreign-born population - Latvia (%)
Place of birth for the foreign-born population - Lithuania (%)
Place of birth for the foreign-born population - North Macedonia (Macedonia) (%)
Place of birth for the foreign-born population - Moldova (%)
Place of birth for the foreign-born population - Poland (%)
Place of birth for the foreign-born population - Romania (%)
Place of birth for the foreign-born population - Russia (%)
Place of birth for the foreign-born population - Serbia (%)
Place of birth for the foreign-born population - Ukraine (%)
Place of birth for the foreign-born population - Other Eastern Europe (%)
Place of birth for the foreign-born population - China (%)
Place of birth for the foreign-born population - Hong Kong (%)
Place of birth for the foreign-born population - Taiwan (%)
Place of birth for the foreign-born population - Japan (%)
Place of birth for the foreign-born population - Korea (%)
Place of birth for the foreign-born population - Other Eastern Asia (%)
Place of birth for the foreign-born population - Afghanistan (%)
Place of birth for the foreign-born population - Bangladesh (%)
Place of birth for the foreign-born population - India (%)
Place of birth for the foreign-born population - Iran (%)
Place of birth for the foreign-born population - Kazakhstan (%)
Place of birth for the foreign-born population - Nepal (%)
Place of birth for the foreign-born population - Pakistan (%)
Place of birth for the foreign-born population - Sri Lanka (%)
Place of birth for the foreign-born population - Uzbekistan (%)
Place of birth for the foreign-born population - Other South Central Asia (%)
Place of birth for the foreign-born population - Burma (%)
Place of birth for the foreign-born population - Cambodia (%)
Place of birth for the foreign-born population - Indonesia (%)
Place of birth for the foreign-born population - Laos (%)
Place of birth for the foreign-born population - Malaysia (%)
Place of birth for the foreign-born population - Philippines (%)
Place of birth for the foreign-born population - Singapore (%)
Place of birth for the foreign-born population - Thailand (%)
Place of birth for the foreign-born population - Vietnam (%)
Place of birth for the foreign-born population - Other South Eastern Asia (%)
Place of birth for the foreign-born population - Armenia (%)
Place of birth for the foreign-born population - Iraq (%)
Place of birth for the foreign-born population - Israel (%)
Place of birth for the foreign-born population - Jordan (%)
Place of birth for the foreign-born population - Kuwait (%)
Place of birth for the foreign-born population - Lebanon (%)
Place of birth for the foreign-born population - Saudi Arabia (%)
Place of birth for the foreign-born population - Syria (%)
Place of birth for the foreign-born population - Turkey (%)
Place of birth for the foreign-born population - Yemen (%)
Place of birth for the foreign-born population - Other Western Asia (%)
Place of birth for the foreign-born population - Eritrea (%)
Place of birth for the foreign-born population - Ethiopia (%)
Place of birth for the foreign-born population - Kenya (%)
Place of birth for the foreign-born population - Somalia (%)
Place of birth for the foreign-born population - Uganda (%)
Place of birth for the foreign-born population - Zimbabwe (%)
Place of birth for the foreign-born population - Other Eastern Africa (%)
Place of birth for the foreign-born population - Cameroon (%)
Place of birth for the foreign-born population - Congo (%)
Place of birth for the foreign-born population - Democratic Republic of Congo (Zaire) (%)
Place of birth for the foreign-born population - Other Middle Africa (%)
Place of birth for the foreign-born population - Egypt (%)
Place of birth for the foreign-born population - Morocco (%)
Place of birth for the foreign-born population - Sudan (%)
Place of birth for the foreign-born population - Other Northern Africa (%)
Place of birth for the foreign-born population - South Africa (%)
Place of birth for the foreign-born population - Other Southern Africa (%)
Place of birth for the foreign-born population - Cabo Verde (%)
Place of birth for the foreign-born population - Ghana (%)
Place of birth for the foreign-born population - Liberia (%)
Place of birth for the foreign-born population - Nigeria (%)
Place of birth for the foreign-born population - Senegal (%)
Place of birth for the foreign-born population - Sierra Leone (%)
Place of birth for the foreign-born population - Other Western Africa (%)
Place of birth for the foreign-born population - Australia (%)
Place of birth for the foreign-born population - New Zealand (%)
Place of birth for the foreign-born population - Fiji (%)
Place of birth for the foreign-born population - Micronesia (%)
Place of birth for the foreign-born population - Bahamas (%)
Place of birth for the foreign-born population - Barbados (%)
Place of birth for the foreign-born population - Cuba (%)
Place of birth for the foreign-born population - Dominica (%)
Place of birth for the foreign-born population - Dominican Republic (%)
Place of birth for the foreign-born population - Grenada (%)
Place of birth for the foreign-born population - Haiti (%)
Place of birth for the foreign-born population - Jamaica (%)
Place of birth for the foreign-born population - St. Vincent and the Grenadines (%)
Place of birth for the foreign-born population - Trinidad and Tobago (%)
Place of birth for the foreign-born population - West Indies (%)
Place of birth for the foreign-born population - Other Caribbean (%)
Place of birth for the foreign-born population - Belize (%)
Place of birth for the foreign-born population - Costa Rica (%)
Place of birth for the foreign-born population - El Salvador (%)
Place of birth for the foreign-born population - Guatemala (%)
Place of birth for the foreign-born population - Honduras (%)
Place of birth for the foreign-born population - Mexico (%)
Place of birth for the foreign-born population - Nicaragua (%)
Place of birth for the foreign-born population - Panama (%)
Place of birth for the foreign-born population - Other Central America (%)
Place of birth for the foreign-born population - Argentina (%)
Place of birth for the foreign-born population - Bolivia (%)
Place of birth for the foreign-born population - Brazil (%)
Place of birth for the foreign-born population - Chile (%)
Place of birth for the foreign-born population - Colombia (%)
Place of birth for the foreign-born population - Ecuador (%)
Place of birth for the foreign-born population - Guyana (%)
Place of birth for the foreign-born population - Peru (%)
Place of birth for the foreign-born population - Uruguay (%)
Place of birth for the foreign-born population - Venezuela (%)
Place of birth for the foreign-born population - Other South America (%)
Place of birth for the foreign-born population - Canada (%)
Place of birth for the foreign-born population - Other Northern America (%)
Place of birth for the foreign-born population - Other (%)
Latest news about races in Columbus, IN collected exclusively by city-data.com from local newspapers, TV, and radio stations
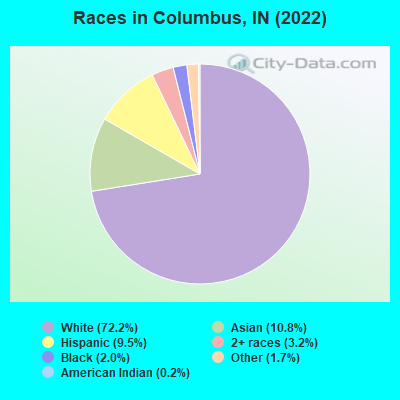
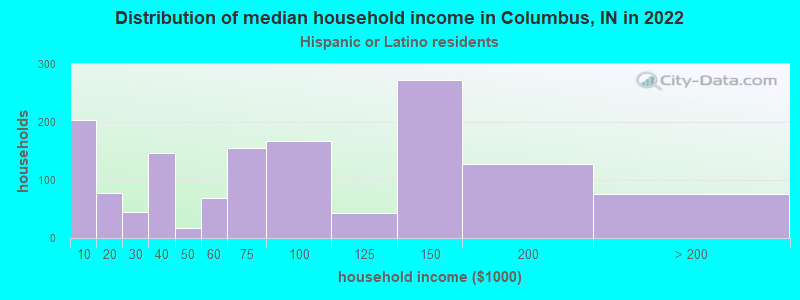
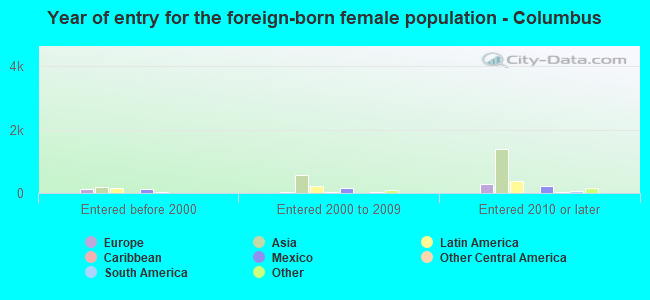
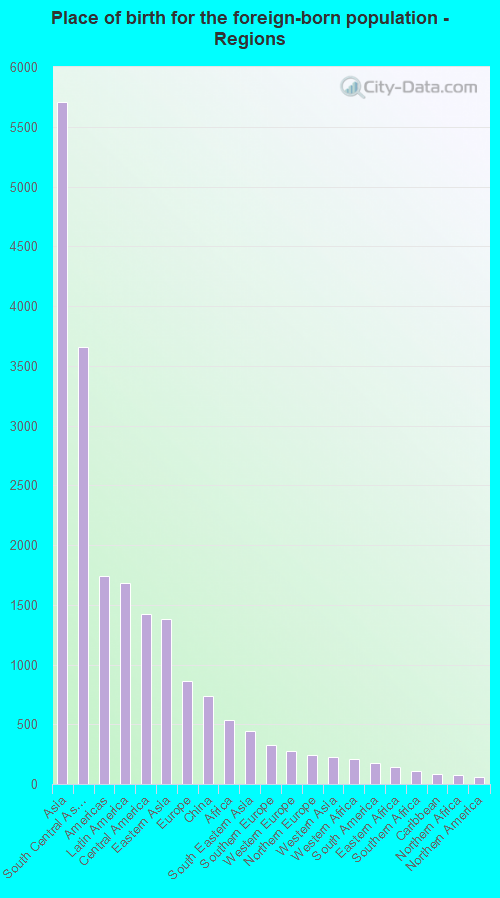
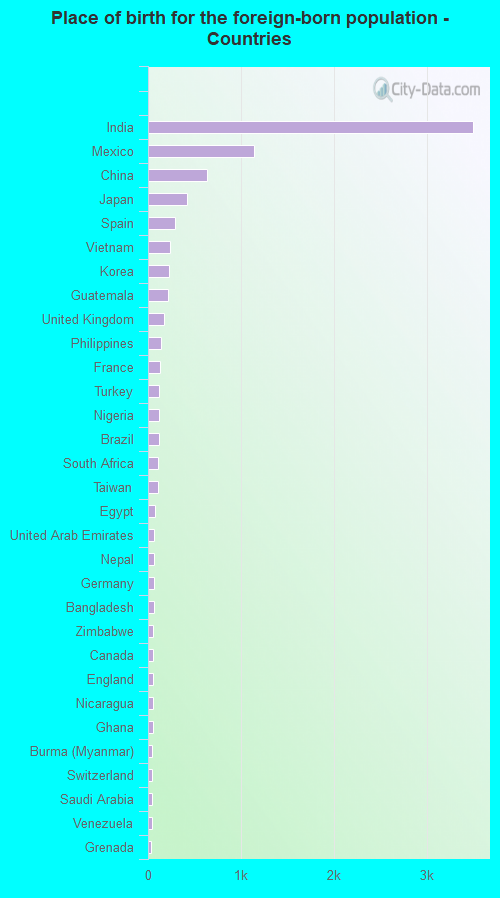
According to 2022 data, the most numerous races in Columbus, IN are White alone (37,282 residents), Black alone (1,055 residents), and Hispanic (4,909 residents). 81.8% of Columbus residents speak English at home. 17.1% of Columbus, IN residents are foreign-born (10.2% born in Asia, 3.0% born in Latin America), which is 65.0% greater than the foreign-born rate of 6.0% across the entire state of Indiana.
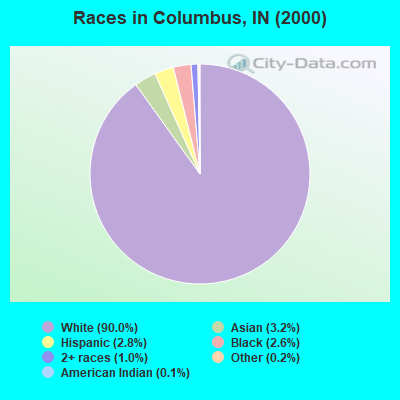
Race distribution in Columbus
2000 2022
5,219,373 85.8% White alone 505,462 8.3% Black alone 214,536 3.5% Hispanic 61,115 1.0% Two or more races 58,424 1.0% Asian alone 13,654 0.2% American Indian alone 6,348 0.1% Other race alone 1,573 0.03% Native Hawaiian and Other
5,192,455 76.0% White alone 628,054 9.2% Black alone 534,528 7.8% Hispanic 263,242 3.9% Two or more races 172,880 2.5% Asian alone 33,467 0.5% Other race alone 5,866 0.09% American Indian alone 2,545 0.04% Native Hawaiian and Other
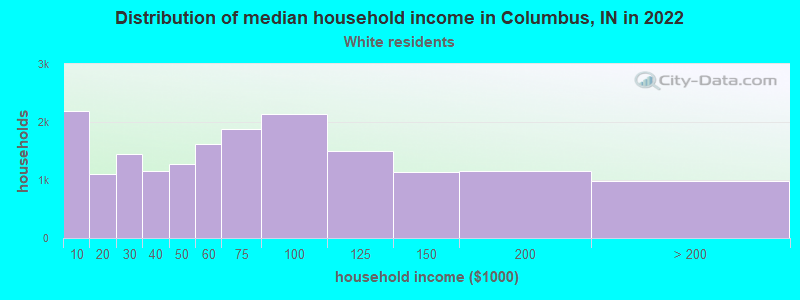
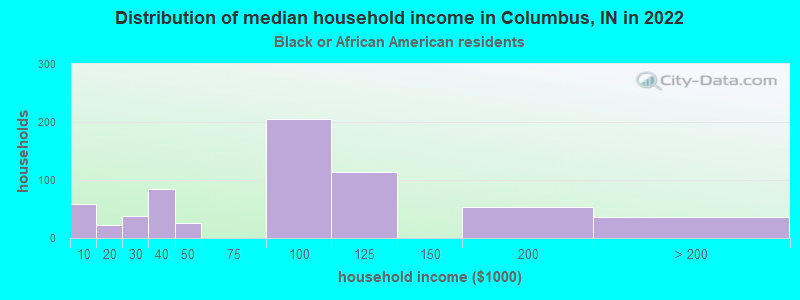
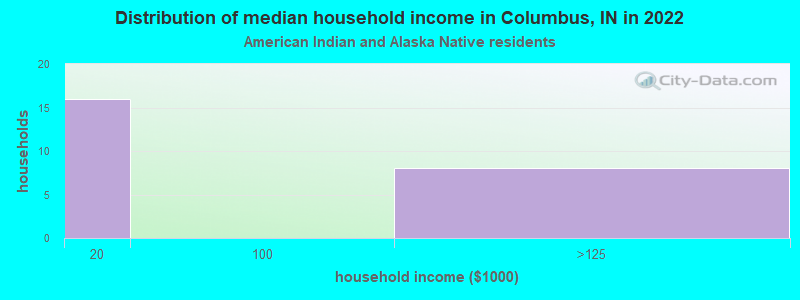
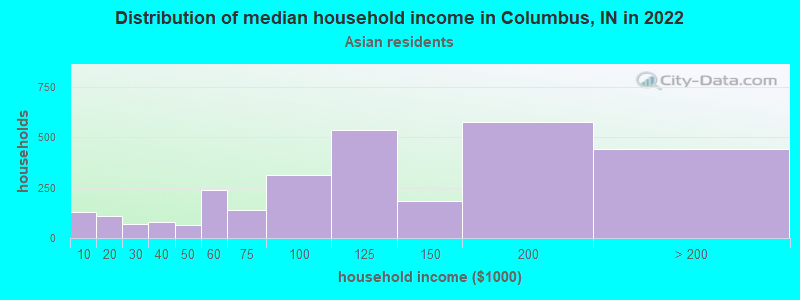
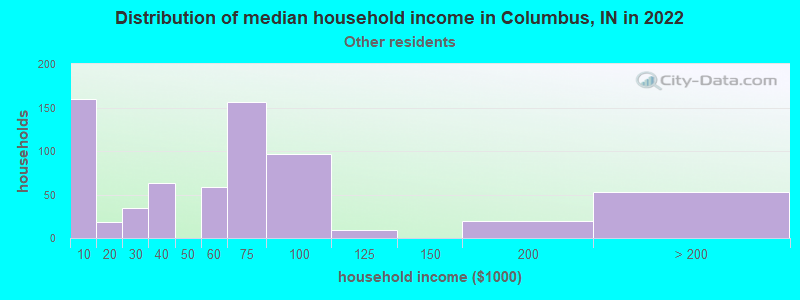
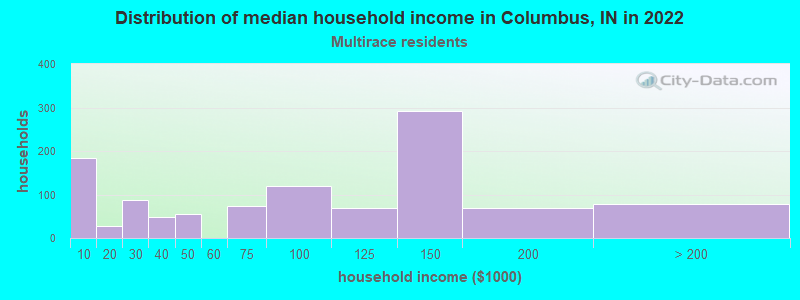
Income and house value in Columbus Median household income in 2022 $58,180 White non-Hispanic householders$84,978 Black householders$106,847 Asian householders$70,589 Some other race householders$94,435 Two or more races householders$76,816 Hispanic or Latino race householdersMedian 2022 house value $239,660 White Non-Hispanic householders$204,964 Black or African American householders$165,127 American Indian or Alaska Native householders $312,907 Asian householders$160,630 Some other race householders$409,285 Two or more races householders$207,105 Hispanic or Latino householders
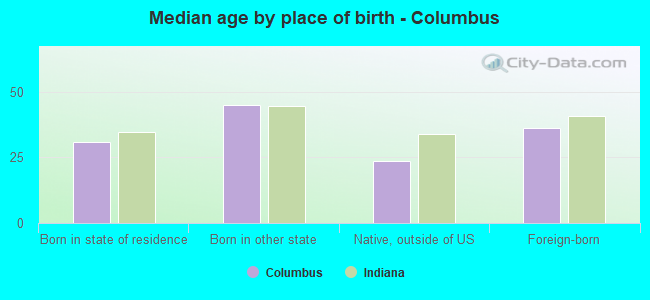
Median age by race in Columbus
39.4 Median age for White residents39.2 40.2 30.4 Median age for Black or African American residents30.4 29.9 69.7 Median age for American Indian / Alaska Native residents28.4 -491,600,353.2 30.6 Median age for Asian residents30.3 38.1 -666,666,666.0 Median age for Native Hawaiian / Pacific Islander residents-666,666,666.0 -666,666,666.0 23.3 Median age for Other race residents21.9 18.1 22.9 Median age for Two or more races residents32.8 12.3 40.7 Median age for White alone residents39.3 43.1 20.1 Median age for Hispanic or Latino residents26.8 19.0
Owner/renter occupied households by race in Columbus
House owners and renters - White residents 11,375 65.0% Owner occupied6,123 35.0% Renter occupiedHouse owners and renters - Black or African American residents 308 67.0% Owner occupied152 33.0% Renter occupiedHouse owners and renters - American Indian / Alaska Native residents 13 44.5% Owner occupied16 55.5% Renter occupiedHouse owners and renters - Asian residents 971 40.0% Owner occupied1,459 60.0% Renter occupiedHouse owners and renters - Other race residents 180 30.5% Owner occupied410 69.5% Renter occupiedHouse owners and renters - Two or more races residents 805 68.3% Owner occupied374 31.7% Renter occupiedHouse owners and renters - White alone residents 11,143 64.7% Owner occupied6,070 35.3% Renter occupiedHouse owners and renters - Hispanic or Latino residents 665 53.7% Owner occupied574 46.3% Renter occupied
Language usage in Columbus
English speakers - Total 81.8% of residents of Columbus speak English at home.
5.9% of residents speak Spanish at home 1,770 62.3% Speak English very well1,070 37.7% Speak English less than very well12.1% of residents speak other language at home 4,927 84.1% Speak English very well934 15.9% Speak English less than very well
English speakers - Born in the United States 89.1% of residents of Columbus speak English at home.
4.8% of residents speak Spanish at home 610 89.7% Speak English very well70 10.3% Speak English less than very well7.2% of residents speak other language at home 922 91.4% Speak English very well87 8.6% Speak English less than very well
English speakers - Native, born elsewhere 28.5% of residents of Columbus speak English at home.
53.8% of residents speak Spanish at home 152 58.0% Speak English very well110 42.0% Speak English less than very well1.4% of residents speak other language at home 7 100.0% Speak English very well
English speakers - Foreign-born 18.6% of residents of Columbus speak English at home.
19.8% of residents speak Spanish at home 631 41.1% Speak English very well905 58.9% Speak English less than very well61.1% of residents speak other language at home 3,892 82.1% Speak English very well848 17.9% Speak English less than very well
White (Caucasian) - Speak only English Native:
98.1% (33,460)Foreign-born:
26.6% (320)
White (Caucasian) - Speak another language Native:
2.0% (674)Foreign-born:
71.7% (863)
Black or African American - Speak only English Native:
95.8% (618)Foreign-born:
44.2% (183)
Black or African American - Speak another language Native:
4.6% (30)Foreign-born:
40.0% (166)
Asian - Speak only English Native:
31.9% (263)Foreign-born:
14.4% (657)
Asian - Speak another language Native:
100.0% (824)Foreign-born:
95.0% (4,327)
Other race - Speak only English Native:
57.2% (859)Foreign-born:
4.3% (39)
Other race - Speak another language Native:
42.3% (635)Foreign-born:
95.3% (855)
Two or more races - Speak only English Native:
73.1% (1,949)Foreign-born:
41.2% (225)
Two or more races - Speak another language Native:
28.5% (761)Foreign-born:
61.0% (333)
White alone - Speak only English Native:
98.1% (33,033)Foreign-born:
42.2% (357)
White alone - Speak another language Native:
1.8% (617)Foreign-born:
57.5% (486)
Hispanic or Latino - Speak only English Native:
69.3% (1,945)Foreign-born:
5.1% (83)
Hispanic or Latino - Speak another language Native:
33.9% (952)Foreign-born:
94.7% (1,539)
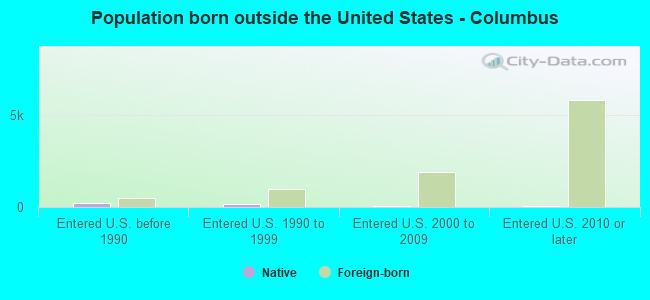
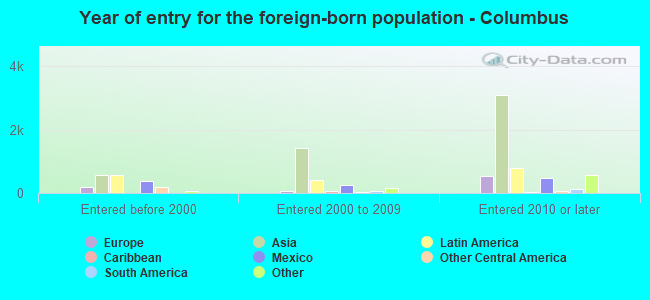
Foreign-born residents in Columbus 8,846 residents are foreign born (10.2% Asia , 3.0% Latin America ).
This city:
17.1%Indiana:
5.6%
Marital status for residents in Columbus Marital status - White (Caucasian) population 15 years and over
Males 33.2% Never married51.7% Now married0.6% Separated3.7% Widowed10.8% DivorcedFemales 27.1% Never married46.5% Now married0.8% Separated9.8% Widowed15.8% DivorcedWomen who gave birth in the past 12 months Now married:
66.9% (482)Unmarried:
33.1% (239)
Women who did not give birth in the past 12 months Now married:
41.3% (3,335)Unmarried:
58.7% (4,747)
Marital status - Black or African American population 15 years and over
Males 55.3% Never married28.1% Now married16.5% Separated0.2% Widowed0.0% DivorcedFemales 36.0% Never married34.1% Now married3.5% Separated11.4% Widowed15.0% DivorcedWomen who did not give birth in the past 12 months Now married:
28.1% (48)Unmarried:
71.9% (123)
Marital status - American Indian / Alaska Native population 15 years and over
Males 0.0% Never married100.0% Now married0.0% Separated0.0% Widowed0.0% DivorcedFemales 0.0% Never married0.0% Now married0.0% Separated0.0% Widowed100.0% DivorcedWomen who did not give birth in the past 12 months Now married:
0.0% (0)Unmarried:
100.0% (24)
Marital status - Asian population 15 years and over
Males 38.3% Never married60.8% Now married0.0% Separated0.0% Widowed0.9% DivorcedFemales 22.9% Never married71.1% Now married0.0% Separated0.0% Widowed6.0% DivorcedWomen who gave birth in the past 12 months Now married:
100.0% (44)Unmarried:
0.0% (0)
Women who did not give birth in the past 12 months Now married:
68.6% (1,313)Unmarried:
31.4% (601)
Marital status - Other race population 15 years and over
Males 47.5% Never married48.4% Now married0.0% Separated0.0% Widowed4.1% DivorcedFemales 43.4% Never married49.8% Now married0.0% Separated0.0% Widowed6.8% DivorcedWomen who did not give birth in the past 12 months Now married:
51.3% (293)Unmarried:
48.7% (278)
Marital status - Two or more races population 15 years and over
Males 34.6% Never married58.1% Now married0.0% Separated0.0% Widowed7.3% DivorcedFemales 32.6% Never married60.4% Now married1.4% Separated0.0% Widowed5.6% DivorcedWomen who gave birth in the past 12 months Now married:
100.0% (49)Unmarried:
0.0% (0)
Women who did not give birth in the past 12 months Now married:
46.5% (316)Unmarried:
53.5% (364)
Marital status - White alone, not Hispanic / Latino population 15 years and over
Males 33.3% Never married51.4% Now married0.6% Separated3.6% Widowed11.1% DivorcedFemales 26.3% Never married46.5% Now married0.8% Separated10.2% Widowed16.2% DivorcedWomen who gave birth in the past 12 months Now married:
66.9% (481)Unmarried:
33.1% (238)
Women who did not give birth in the past 12 months Now married:
40.9% (3,082)Unmarried:
59.1% (4,453)
Marital status - Hispanic or Latino population 15 years and over
Males 37.4% Never married56.7% Now married0.0% Separated2.4% Widowed3.5% DivorcedFemales 39.8% Never married54.3% Now married0.0% Separated0.0% Widowed5.9% DivorcedWomen who gave birth in the past 12 months Now married:
100.0% (32)Unmarried:
0.0% (0)
Women who did not give birth in the past 12 months Now married:
48.7% (521)Unmarried:
51.3% (548)
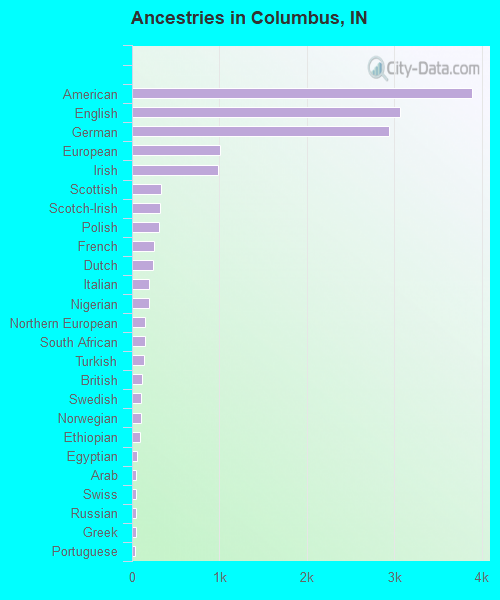
Ancestries in Columbus
3,887 15.2% American3,066 12.0% English2,940 11.5% German1,001 3.9% European980 3.8% Irish328 1.3% Scottish324 1.3% Scotch-Irish311 1.2% Polish254 1.0% French235 0.9% Dutch191 0.7% Italian189 0.7% Nigerian150 0.6% Northern European146 0.6% South African134 0.5% Turkish113 0.4% British104 0.4% Swedish100 0.4% Norwegian87 0.3% Ethiopian55 0.2% Egyptian51 0.2% Arab51 0.2% Swiss49 0.2% Russian44 0.2% Greek40 0.2% Portuguese38 0.1% Jamaican36 0.1% African36 0.1% Ukrainian33 0.1% British West Indian28 0.1% Lithuanian28 0.1% Eastern European26 0.1% Welsh25 0.10% French Canadian21 0.08% Belgian21 0.08% Danish20 0.08% Dutch West Indian19 0.07% Zimbabwean19 0.07% Haitian16 0.06% Romanian14 0.05% Canadian13 0.05% Slovene12 0.05% Austrian12 0.05% West Indian7 0.03% Finnish4 0.02% Hungarian3 0.01% Slavic
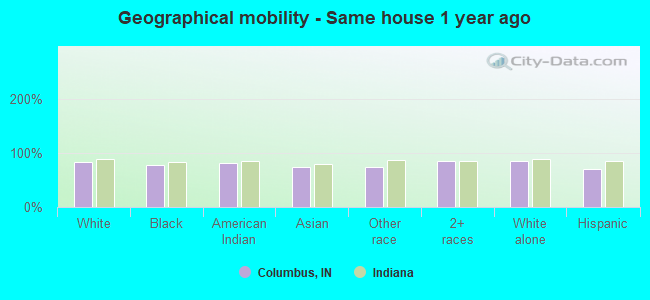
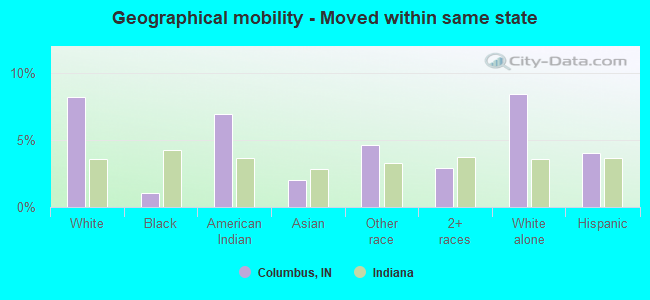
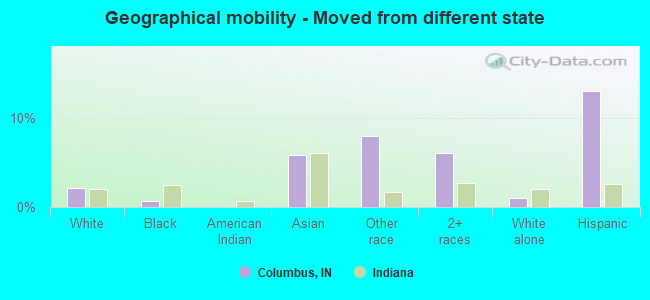
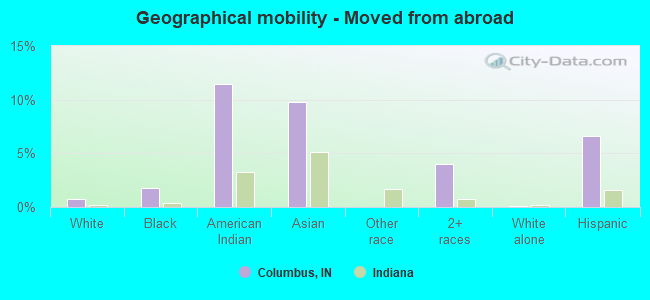
Geographical mobility in Columbus Same house 1 year ago 32,087 83.8% White (Caucasian)816 78.1% Black or African American104 80.9% American Indian / Alaska Native4,856 73.6% Asian1,566 73.7% Other race3,238 85.2% Two or more races31,269 84.8% White alone, not Hispanic / Latino3,358 70.8% Hispanic or LatinoMoved within same county 1,919 5.0% White / Caucasian241 23.1% Black or African American605 9.2% Asian196 9.2% Other race106 2.8% Two or more races1,875 5.1% White alone, not Hispanic / Latino272 5.7% Hispanic or LatinoMoved within same state 3,152 8.2% White / Caucasian11 1.1% Black or African American9 7.0% American Indian / Alaska Native133 2.0% Asian99 4.6% Other race109 2.9% Two or more races3,119 8.5% White alone, not Hispanic / Latino190 4.0% Hispanic or LatinoMoved from different state 820 2.1% White / Caucasian7 0.7% Black or African American385 5.8% Asian170 8.0% Other race230 6.1% Two or more races376 1.0% White alone, not Hispanic / Latino614 12.9% Hispanic or LatinoMoved from abroad 275 0.7% White19 1.8% Black or African American15 11.4% American Indian / Alaska Native646 9.8% Asian152 4.0% Two or more races35 0.1% White alone, not Hispanic / Latino315 6.6% Hispanic or Latino
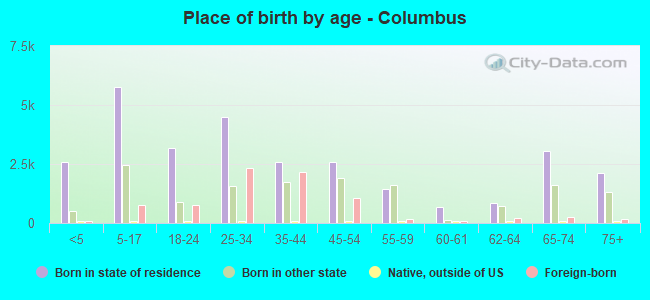
Children Nativity (place of birth) in Columbus
Children under 6 years - Living with two parents Both parents native 2,023 100.0% NativeBoth parents foreign-born 985 88.8% Native124 11.2% Foreign-bornOne native, one foreign-born parent 215 100.0% NativeChildren under 6 years - Living with one parent Native parent 826 100.0% NativeForeign-born parent 8 100.0% NativeChildren 6 to 17 years - Living with two parents Both parents native 3,251 100.0% NativeBoth parents foreign-born 740 56.9% Native561 43.1% Foreign-bornOne native, one foreign-born parent 188 62.3% Native114 37.7% Foreign-bornChildren 6 to 17 years - Living with one parent Native parent 2,375 100.0% NativeForeign-born parent 144 52.0% Native133 48.0% Foreign-born
Grandparents responsible for own grandchildren in Columbus
Grandparents (30 to 59 years) White / Caucasian 108 37.5% Responsible for grandchildren180 62.5% Not responsible for grandchildrenOther race 12 39.8% Responsible for grandchildren18 60.2% Not responsible for grandchildrenTwo or more races 52 100.0% Responsible for grandchildrenWhite alone, not Hispanic / Latino 111 36.9% Responsible for grandchildren190 63.1% Not responsible for grandchildrenHispanic or Latino 11 48.7% Responsible for grandchildren11 51.3% Not responsible for grandchildrenGrandparents (60 years and over) White / Caucasian 188 36.3% Responsible for grandchildren329 63.7% Not responsible for grandchildrenWhite alone, not Hispanic / Latino 190 37.6% Responsible for grandchildren316 62.4% Not responsible for grandchildrenHispanic or Latino 19 100.0% Not responsible for grandchildren