Races in Comstock Park, Michigan (MI) Detailed Stats
Data:
Races - White alone (%)
Races - White alone (% change since 2000)
Races - Black alone (%)
Races - Black alone (% change since 2000)
Races - American Indian alone (%)
Races - American Indian alone (% change since 2000)
Races - Asian alone (%)
Races - Asian alone (% change since 2000)
Races - Hispanic (%)
Races - Hispanic (% change since 2000)
Races - Native Hawaiian and Other Pacific Islander alone (%)
Races - Native Hawaiian and Other Pacific Islander alone (% change since 2000)
Races - Two or more races(%)
Races - Two or more races(% change since 2000)
Races - Other race alone (%)
Races - Other race alone (% change since 2000)
Racial diversity
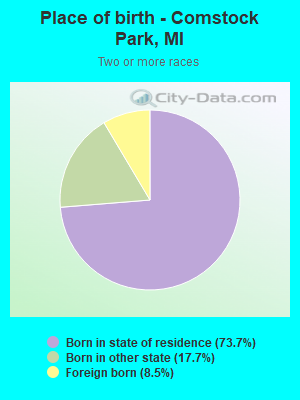
Place of birth - Born in state of residence (%)
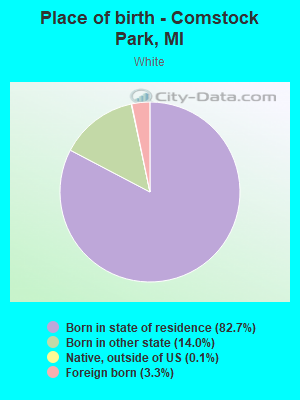
Place of birth - Born in state of residence (%) - White
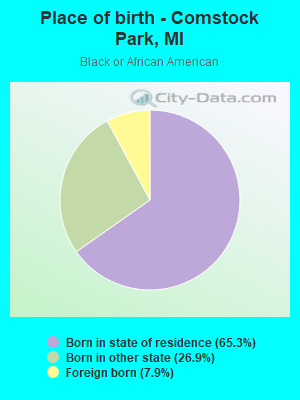
Place of birth - Born in state of residence (%) - Black or African American
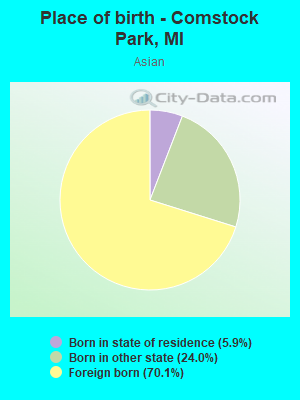
Place of birth - Born in state of residence (%) - Asian
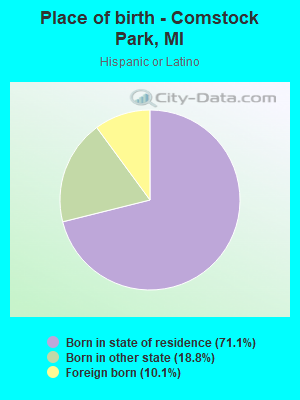
Place of birth - Born in state of residence (%) - Hispanic or Latino
Place of birth - Born in state of residence (%) - American Indian and Alaska Native
Place of birth - Born in state of residence (%) - Multirace
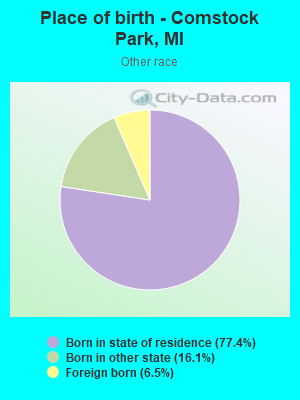
Place of birth - Born in state of residence (%) - Other Race
Place of birth - Born in other state (%)
Place of birth - Born in other state (%) - White
Place of birth - Born in other state (%) - Black or African American
Place of birth - Born in other state (%) - Asian
Place of birth - Born in other state (%) - Hispanic or Latino
Place of birth - Born in other state (%) - American Indian and Alaska Native
Place of birth - Born in other state (%) - Multirace
Place of birth - Born in other state (%) - Other Race
Place of birth - Native, outside of US (%)
Place of birth - Native, outside of US (%) - White
Place of birth - Native, outside of US (%) - Black or African American
Place of birth - Native, outside of US (%) - Asian
Place of birth - Native, outside of US (%) - Hispanic or Latino
Place of birth - Native, outside of US (%) - American Indian and Alaska Native
Place of birth - Native, outside of US (%) - Multirace
Place of birth - Native, outside of US (%) - Other Race
Place of birth - Foreign born (%)
Place of birth - Foreign born (%) - White
Place of birth - Foreign born (%) - Black or African American
Place of birth - Foreign born (%) - Asian
Place of birth - Foreign born (%) - Hispanic or Latino
Place of birth - Foreign born (%) - American Indian and Alaska Native
Place of birth - Foreign born (%) - Multirace
Place of birth - Foreign born (%) - Other Race
Residents speaking English at home (%)
Residents speaking English at home - Born in the United States (%)
Residents speaking English at home - Native, born elsewhere (%)
Residents speaking English at home - Foreign born (%)
Residents speaking Spanish at home (%)
Residents speaking Spanish at home - Born in the United States (%)
Residents speaking Spanish at home - Native, born elsewhere (%)
Residents speaking Spanish at home - Foreign born (%)
Residents speaking other language at home (%)
Residents speaking other language at home - Born in the United States (%)
Residents speaking other language at home - Native, born elsewhere (%)
Residents speaking other language at home - Foreign born (%)
Marital status - Never married (%)
Marital status - Now married (%)
Marital status - Separated (%)
Marital status - Widowed (%)
Marital status - Divorced (%)
Ancestries Reported - Arab (%)
Ancestries Reported - Czech (%)
Ancestries Reported - Danish (%)
Ancestries Reported - Dutch (%)
Ancestries Reported - English (%)
Ancestries Reported - French (%)
Ancestries Reported - French Canadian (%)
Ancestries Reported - German (%)
Ancestries Reported - Greek (%)
Ancestries Reported - Hungarian (%)
Ancestries Reported - Irish (%)
Ancestries Reported - Italian (%)
Ancestries Reported - Lithuanian (%)
Ancestries Reported - Norwegian (%)
Ancestries Reported - Polish (%)
Ancestries Reported - Portuguese (%)
Ancestries Reported - Russian (%)
Ancestries Reported - Scotch-Irish (%)
Ancestries Reported - Scottish (%)
Ancestries Reported - Slovak (%)
Ancestries Reported - Subsaharan African (%)
Ancestries Reported - Swedish (%)
Ancestries Reported - Swiss (%)
Ancestries Reported - Ukrainian (%)
Ancestries Reported - United States (%)
Ancestries Reported - Welsh (%)
Ancestries Reported - West Indian (%)
Ancestries Reported - Other (%)
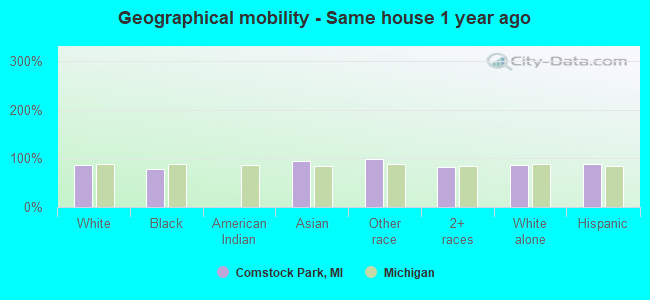
Geographical mobility - Same house 1 year ago (%)
Geographical mobility - Same house 1 year ago (%) - White
Geographical mobility - Same house 1 year ago (%) - Black or African American
Geographical mobility - Same house 1 year ago (%) - Asian
Geographical mobility - Same house 1 year ago (%) - Hispanic or Latino
Geographical mobility - Same house 1 year ago (%) - American Indian and Alaska Native
Geographical mobility - Same house 1 year ago (%) - Multirace
Geographical mobility - Same house 1 year ago (%) - Other Race
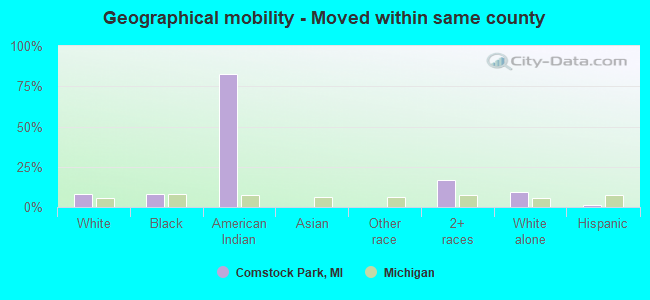
Geographical mobility - Moved within same county (%)
Geographical mobility - Moved within same county (%) - White
Geographical mobility - Moved within same county (%) - Black or African American
Geographical mobility - Moved within same county (%) - Asian
Geographical mobility - Moved within same county (%) - Hispanic or Latino
Geographical mobility - Moved within same county (%) - American Indian and Alaska Native
Geographical mobility - Moved within same county (%) - Multirace
Geographical mobility - Moved within same county (%) - Other Race
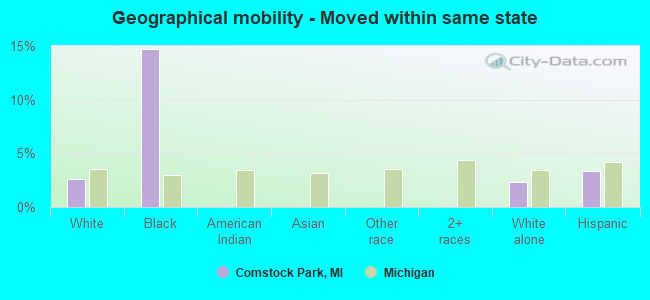
Geographical mobility - Moved from different county within same state (%)
Geographical mobility - Moved from different county within same state (%) - White
Geographical mobility - Moved from different county within same state (%) - Black or African American
Geographical mobility - Moved from different county within same state (%) - Asian
Geographical mobility - Moved from different county within same state (%) - Hispanic or Latino
Geographical mobility - Moved from different county within same state (%) - American Indian and Alaska Native
Geographical mobility - Moved from different county within same state (%) - Multirace
Geographical mobility - Moved from different county within same state (%) - Other Race
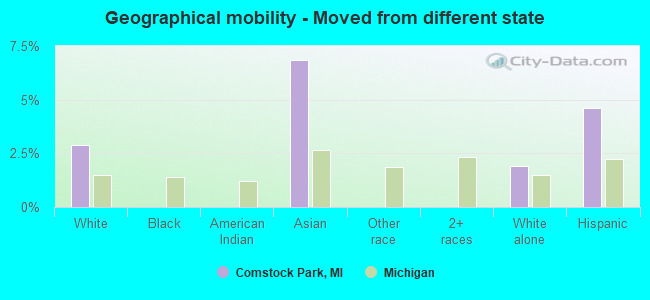
Geographical mobility - Moved from different state (%)
Geographical mobility - Moved from different state (%) - White
Geographical mobility - Moved from different state (%) - Black or African American
Geographical mobility - Moved from different state (%) - Asian
Geographical mobility - Moved from different state (%) - Hispanic or Latino
Geographical mobility - Moved from different state (%) - American Indian and Alaska Native
Geographical mobility - Moved from different state (%) - Multirace
Geographical mobility - Moved from different state (%) - Other Race
Geographical mobility - Moved from abroad (%)
Geographical mobility - Moved from abroad (%) - White
Geographical mobility - Moved from abroad (%) - Black or African American
Geographical mobility - Moved from abroad (%) - Asian
Geographical mobility - Moved from abroad (%) - Hispanic or Latino
Geographical mobility - Moved from abroad (%) - American Indian and Alaska Native
Geographical mobility - Moved from abroad (%) - Multirace
Geographical mobility - Moved from abroad (%) - Other Race
Place of birth for the foreign-born population - Ireland (%)
Place of birth for the foreign-born population - Denmark (%)
Place of birth for the foreign-born population - Norway (%)
Place of birth for the foreign-born population - Sweden (%)
Place of birth for the foreign-born population - United Kingdom (%)
Place of birth for the foreign-born population - England (%)
Place of birth for the foreign-born population - Scotland (%)
Place of birth for the foreign-born population - Other Northern Europe (%)
Place of birth for the foreign-born population - Austria (%)
Place of birth for the foreign-born population - Belgium (%)
Place of birth for the foreign-born population - France (%)
Place of birth for the foreign-born population - Germany (%)
Place of birth for the foreign-born population - Netherlands (%)
Place of birth for the foreign-born population - Switzerland (%)
Place of birth for the foreign-born population - Other Western Europe (%)
Place of birth for the foreign-born population - Greece (%)
Place of birth for the foreign-born population - Italy (%)
Place of birth for the foreign-born population - Portugal (%)
Place of birth for the foreign-born population - Spain (%)
Place of birth for the foreign-born population - Other Southern Europe (%)
Place of birth for the foreign-born population - Albania (%)
Place of birth for the foreign-born population - Belarus (%)
Place of birth for the foreign-born population - Bosnia and Herzegovina (%)
Place of birth for the foreign-born population - Bulgaria (%)
Place of birth for the foreign-born population - Croatia (%)
Place of birth for the foreign-born population - Czechoslovakia (%)
Place of birth for the foreign-born population - Hungary (%)
Place of birth for the foreign-born population - Latvia (%)
Place of birth for the foreign-born population - Lithuania (%)
Place of birth for the foreign-born population - North Macedonia (Macedonia) (%)
Place of birth for the foreign-born population - Moldova (%)
Place of birth for the foreign-born population - Poland (%)
Place of birth for the foreign-born population - Romania (%)
Place of birth for the foreign-born population - Russia (%)
Place of birth for the foreign-born population - Serbia (%)
Place of birth for the foreign-born population - Ukraine (%)
Place of birth for the foreign-born population - Other Eastern Europe (%)
Place of birth for the foreign-born population - China (%)
Place of birth for the foreign-born population - Hong Kong (%)
Place of birth for the foreign-born population - Taiwan (%)
Place of birth for the foreign-born population - Japan (%)
Place of birth for the foreign-born population - Korea (%)
Place of birth for the foreign-born population - Other Eastern Asia (%)
Place of birth for the foreign-born population - Afghanistan (%)
Place of birth for the foreign-born population - Bangladesh (%)
Place of birth for the foreign-born population - India (%)
Place of birth for the foreign-born population - Iran (%)
Place of birth for the foreign-born population - Kazakhstan (%)
Place of birth for the foreign-born population - Nepal (%)
Place of birth for the foreign-born population - Pakistan (%)
Place of birth for the foreign-born population - Sri Lanka (%)
Place of birth for the foreign-born population - Uzbekistan (%)
Place of birth for the foreign-born population - Other South Central Asia (%)
Place of birth for the foreign-born population - Burma (%)
Place of birth for the foreign-born population - Cambodia (%)
Place of birth for the foreign-born population - Indonesia (%)
Place of birth for the foreign-born population - Laos (%)
Place of birth for the foreign-born population - Malaysia (%)
Place of birth for the foreign-born population - Philippines (%)
Place of birth for the foreign-born population - Singapore (%)
Place of birth for the foreign-born population - Thailand (%)
Place of birth for the foreign-born population - Vietnam (%)
Place of birth for the foreign-born population - Other South Eastern Asia (%)
Place of birth for the foreign-born population - Armenia (%)
Place of birth for the foreign-born population - Iraq (%)
Place of birth for the foreign-born population - Israel (%)
Place of birth for the foreign-born population - Jordan (%)
Place of birth for the foreign-born population - Kuwait (%)
Place of birth for the foreign-born population - Lebanon (%)
Place of birth for the foreign-born population - Saudi Arabia (%)
Place of birth for the foreign-born population - Syria (%)
Place of birth for the foreign-born population - Turkey (%)
Place of birth for the foreign-born population - Yemen (%)
Place of birth for the foreign-born population - Other Western Asia (%)
Place of birth for the foreign-born population - Eritrea (%)
Place of birth for the foreign-born population - Ethiopia (%)
Place of birth for the foreign-born population - Kenya (%)
Place of birth for the foreign-born population - Somalia (%)
Place of birth for the foreign-born population - Uganda (%)
Place of birth for the foreign-born population - Zimbabwe (%)
Place of birth for the foreign-born population - Other Eastern Africa (%)
Place of birth for the foreign-born population - Cameroon (%)
Place of birth for the foreign-born population - Congo (%)
Place of birth for the foreign-born population - Democratic Republic of Congo (Zaire) (%)
Place of birth for the foreign-born population - Other Middle Africa (%)
Place of birth for the foreign-born population - Egypt (%)
Place of birth for the foreign-born population - Morocco (%)
Place of birth for the foreign-born population - Sudan (%)
Place of birth for the foreign-born population - Other Northern Africa (%)
Place of birth for the foreign-born population - South Africa (%)
Place of birth for the foreign-born population - Other Southern Africa (%)
Place of birth for the foreign-born population - Cabo Verde (%)
Place of birth for the foreign-born population - Ghana (%)
Place of birth for the foreign-born population - Liberia (%)
Place of birth for the foreign-born population - Nigeria (%)
Place of birth for the foreign-born population - Senegal (%)
Place of birth for the foreign-born population - Sierra Leone (%)
Place of birth for the foreign-born population - Other Western Africa (%)
Place of birth for the foreign-born population - Australia (%)
Place of birth for the foreign-born population - New Zealand (%)
Place of birth for the foreign-born population - Fiji (%)
Place of birth for the foreign-born population - Micronesia (%)
Place of birth for the foreign-born population - Bahamas (%)
Place of birth for the foreign-born population - Barbados (%)
Place of birth for the foreign-born population - Cuba (%)
Place of birth for the foreign-born population - Dominica (%)
Place of birth for the foreign-born population - Dominican Republic (%)
Place of birth for the foreign-born population - Grenada (%)
Place of birth for the foreign-born population - Haiti (%)
Place of birth for the foreign-born population - Jamaica (%)
Place of birth for the foreign-born population - St. Vincent and the Grenadines (%)
Place of birth for the foreign-born population - Trinidad and Tobago (%)
Place of birth for the foreign-born population - West Indies (%)
Place of birth for the foreign-born population - Other Caribbean (%)
Place of birth for the foreign-born population - Belize (%)
Place of birth for the foreign-born population - Costa Rica (%)
Place of birth for the foreign-born population - El Salvador (%)
Place of birth for the foreign-born population - Guatemala (%)
Place of birth for the foreign-born population - Honduras (%)
Place of birth for the foreign-born population - Mexico (%)
Place of birth for the foreign-born population - Nicaragua (%)
Place of birth for the foreign-born population - Panama (%)
Place of birth for the foreign-born population - Other Central America (%)
Place of birth for the foreign-born population - Argentina (%)
Place of birth for the foreign-born population - Bolivia (%)
Place of birth for the foreign-born population - Brazil (%)
Place of birth for the foreign-born population - Chile (%)
Place of birth for the foreign-born population - Colombia (%)
Place of birth for the foreign-born population - Ecuador (%)
Place of birth for the foreign-born population - Guyana (%)
Place of birth for the foreign-born population - Peru (%)
Place of birth for the foreign-born population - Uruguay (%)
Place of birth for the foreign-born population - Venezuela (%)
Place of birth for the foreign-born population - Other South America (%)
Place of birth for the foreign-born population - Canada (%)
Place of birth for the foreign-born population - Other Northern America (%)
Place of birth for the foreign-born population - Other (%)
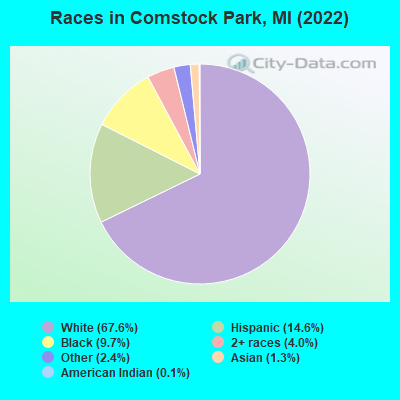
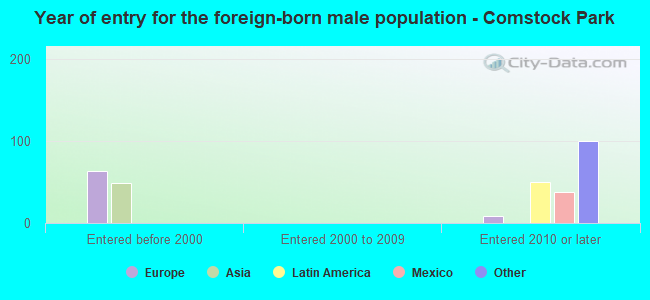
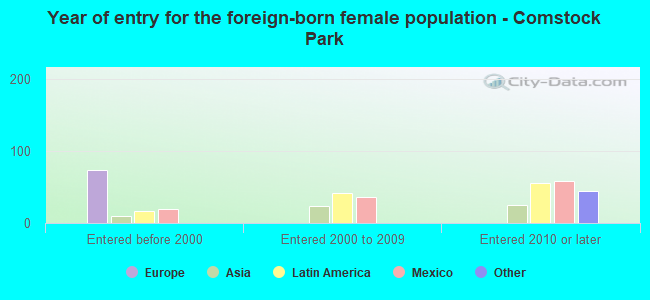
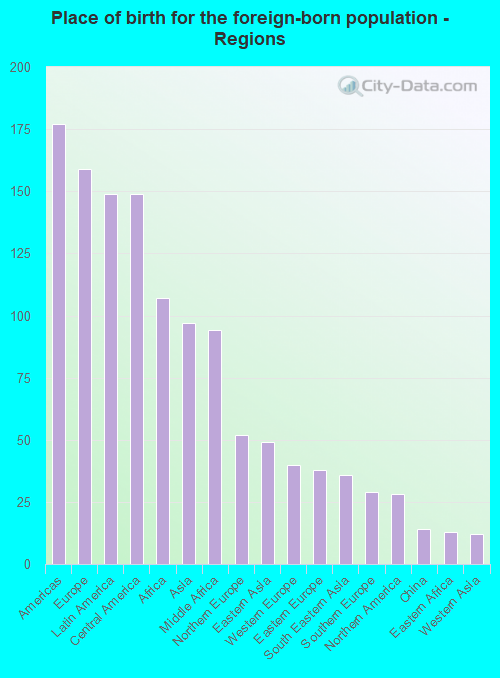
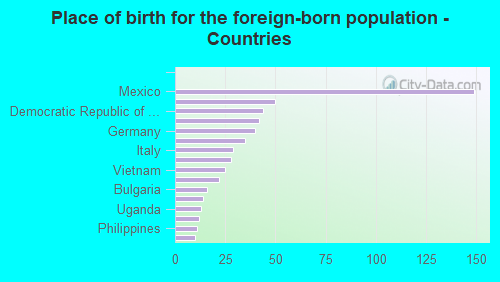
According to 2022 data, the most numerous races in Comstock Park, MI are White alone (7,034 residents), Black alone (1,014 residents), and Hispanic (1,521 residents). 91.4% of Comstock Park residents speak English at home. 5.2% of Comstock Park, MI residents are foreign-born (1.5% born in Europe, 1.4% born in Latin America, 1.0% born in Africa, 0.9% born in Asia), which is 15.6% less than the foreign-born rate of 6.0% across the entire state of Michigan.
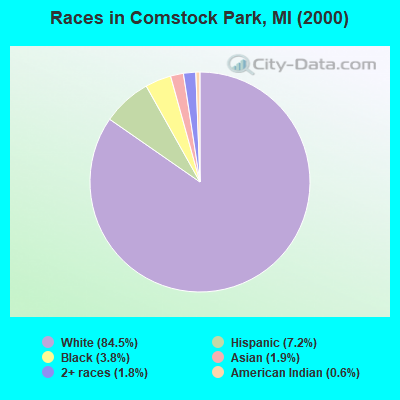
Race distribution in Comstock Park
2000 2022
7,806,691 78.6% White alone 1,402,047 14.1% Black alone 323,877 3.3% Hispanic 175,311 1.8% Asian alone 163,487 1.6% Two or more races 53,421 0.5% American Indian alone 11,465 0.1% Other race alone 2,145 0.02% Native Hawaiian and Other
7,289,051 72.6% White alone 1,310,464 13.1% Black alone 572,405 5.7% Hispanic 450,031 4.5% Two or more races 335,732 3.3% Asian alone 45,217 0.5% Other race alone 29,011 0.3% American Indian alone 2,207 0.02% Native Hawaiian and Other
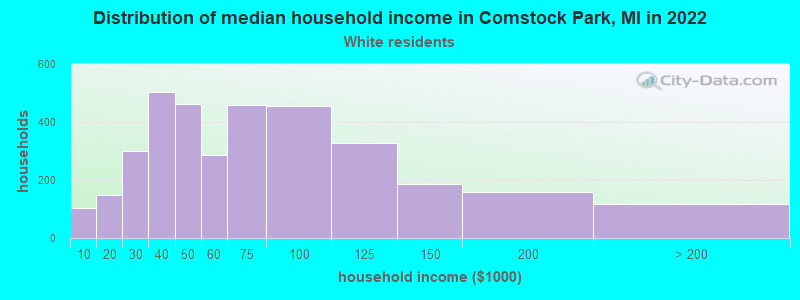
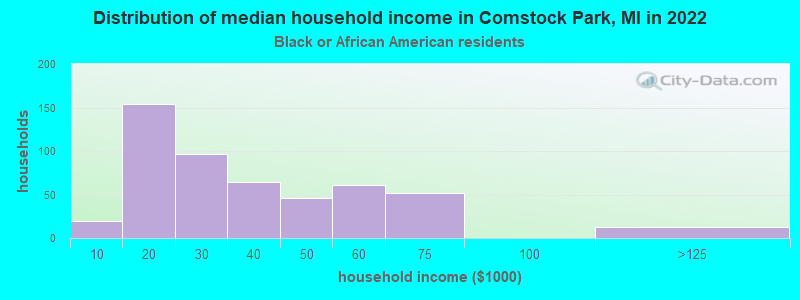
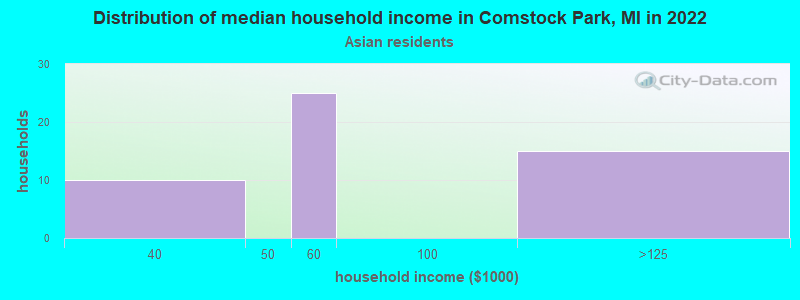
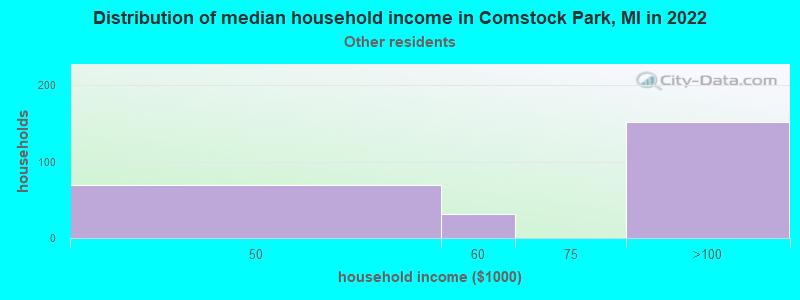
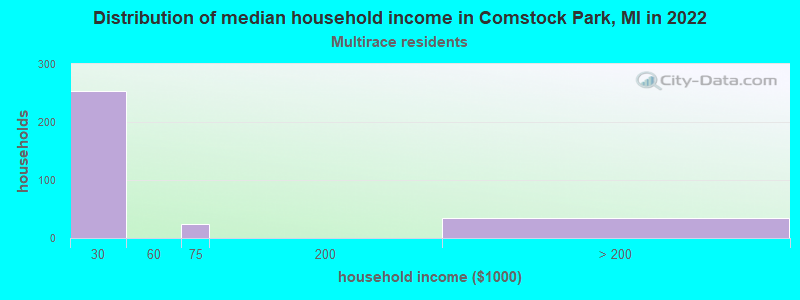
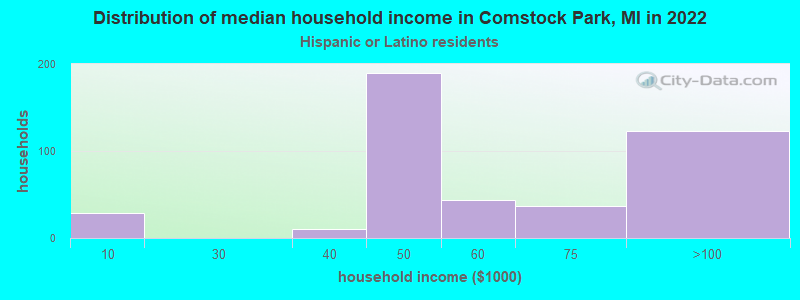
Income and house value in Comstock Park Median household income in 2022 $57,662 White non-Hispanic householders$32,896 Black householders$57,712 Asian householders$98,265 Some other race householders$29,360 Two or more races householders$48,240 Hispanic or Latino race householdersMedian 2022 house value $246,673 White Non-Hispanic householders$161,859 Black or African American householders$242,789 Some other race householders$231,566 Hispanic or Latino householders
Median age by race in Comstock Park
35.2 Median age for White residents35.6 34.8 23.8 Median age for Black or African American residents22.7 25.1 -697,722,566.6 Median age for American Indian / Alaska Native residents-697,626,418.3 -677,018,632.9 46.3 Median age for Asian residents45.7 27.5 -670,531,400.3 Median age for Native Hawaiian / Pacific Islander residents-674,772,035.8 -699,588,476.7 96.6 Median age for Other race residents38.6 -690,058,478.8 33.6 Median age for Two or more races residents29.1 44.6 36.9 Median age for White alone residents36.0 37.9 20.4 Median age for Hispanic or Latino residents28.2 17.3
Owner/renter occupied households by race in Comstock Park
House owners and renters - White residents 2,050 57.8% Owner occupied1,494 42.2% Renter occupiedHouse owners and renters - Black or African American residents 13 3.3% Owner occupied387 96.7% Renter occupiedHouse owners and renters - American Indian / Alaska Native residents 16 100.0% Renter occupiedHouse owners and renters - Asian residents 55 65.6% Owner occupied29 34.4% Renter occupiedHouse owners and renters - Other race residents 99 62.3% Owner occupied60 37.7% Renter occupiedHouse owners and renters - Two or more races residents 82 23.4% Owner occupied268 76.6% Renter occupiedHouse owners and renters - White alone residents 2,028 60.1% Owner occupied1,346 39.9% Renter occupiedHouse owners and renters - Hispanic or Latino residents 93 23.3% Owner occupied307 76.7% Renter occupied
Language usage in Comstock Park
English speakers - Total 91.4% of residents of Comstock Park speak English at home.
4.7% of residents speak Spanish at home 215 46.5% Speak English very well247 53.5% Speak English less than very well3.6% of residents speak other language at home 229 64.0% Speak English very well129 36.0% Speak English less than very well
English speakers - Born in the United States 89.8% of residents of Comstock Park speak English at home.
7.2% of residents speak Spanish at home 117 100.0% Speak English very well1.3% of residents speak other language at home 9 40.9% Speak English very well13 59.1% Speak English less than very well
All residents speak only English at home
English speakers - Foreign-born 15.8% of residents of Comstock Park speak English at home.
30.6% of residents speak Spanish at home 18 11.0% Speak English very well145 89.0% Speak English less than very well52.2% of residents speak other language at home 173 62.2% Speak English very well105 37.8% Speak English less than very well
White (Caucasian) - Speak only English Native:
98.9% (7,198)Foreign-born:
25.3% (58)
White (Caucasian) - Speak another language Native:
1.2% (91)Foreign-born:
74.5% (172)
Black or African American - Speak only English Native:
98.0% (999)Foreign-born:
8.4% (7)
Asian - Speak only English Native:
20.8% (7)Foreign-born:
16.6% (15)
Asian - Speak another language Native:
79.6% (27)Foreign-born:
83.4% (78)
Other race - Speak another language Native:
25.1% (80)Foreign-born:
99.2% (23)
Two or more races - Speak another language Native:
26.8% (147)Foreign-born:
100.0% (58)
White alone - Speak only English Native:
99.2% (6,424)Foreign-born:
30.6% (55)
White alone - Speak another language Native:
0.7% (43)Foreign-born:
69.8% (126)
Hispanic or Latino - Speak another language Native:
21.7% (264)Foreign-born:
99.5% (155)
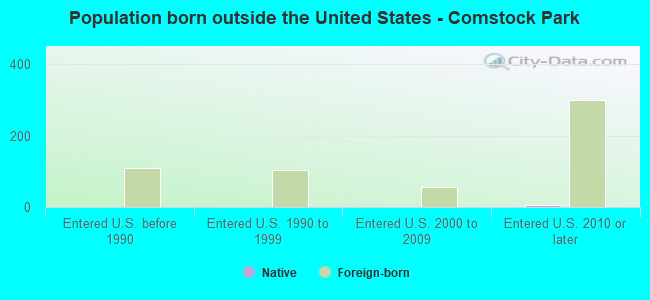
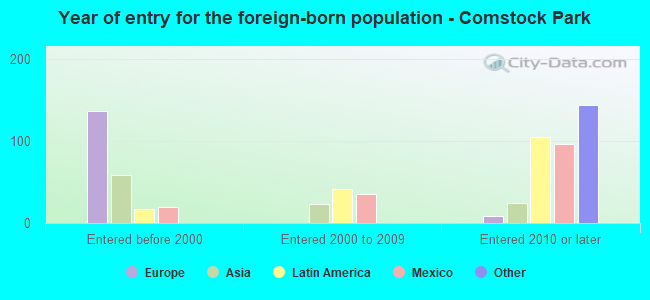
Foreign-born residents in Comstock Park 540 residents are foreign born (1.5% Europe , 1.4% Latin America , 1.0% Africa , 0.9% Asia ).
This city:
5.2%Michigan:
6.9%
Marital status for residents in Comstock Park Marital status - White (Caucasian) population 15 years and over
Males 31.5% Never married51.7% Now married1.1% Separated1.2% Widowed14.5% DivorcedFemales 32.7% Never married42.5% Now married0.1% Separated8.5% Widowed16.1% DivorcedWomen who gave birth in the past 12 months Now married:
41.3% (50)Unmarried:
58.7% (71)
Women who did not give birth in the past 12 months Now married:
42.3% (932)Unmarried:
57.7% (1,273)
Marital status - Black or African American population 15 years and over
Males 92.1% Never married3.0% Now married4.8% Separated0.0% Widowed0.0% DivorcedFemales 51.7% Never married21.1% Now married1.7% Separated0.0% Widowed25.6% DivorcedWomen who did not give birth in the past 12 months Now married:
23.6% (89)Unmarried:
76.4% (287)
Marital status - American Indian / Alaska Native population 15 years and over
Males 100.0% Never married0.0% Now married0.0% Separated0.0% Widowed0.0% DivorcedFemales 100.0% Never married0.0% Now married0.0% Separated0.0% Widowed0.0% DivorcedWomen who did not give birth in the past 12 months Now married:
0.0% (0)Unmarried:
100.0% (4)
Marital status - Asian population 15 years and over
Males 53.2% Never married29.0% Now married0.0% Separated0.0% Widowed17.7% DivorcedFemales 64.0% Never married36.0% Now married0.0% Separated0.0% Widowed0.0% DivorcedWomen who did not give birth in the past 12 months Now married:
36.0% (19)Unmarried:
64.0% (34)
Marital status - Other race population 15 years and over
Males 47.6% Never married51.9% Now married0.0% Separated0.5% Widowed0.0% DivorcedFemales 0.0% Never married100.0% Now married0.0% Separated0.0% Widowed0.0% DivorcedWomen who did not give birth in the past 12 months Now married:
100.0% (21)Unmarried:
0.0% (0)
Marital status - Two or more races population 15 years and over
Males 39.7% Never married12.4% Now married0.0% Separated4.8% Widowed43.2% DivorcedFemales 17.4% Never married26.7% Now married0.0% Separated17.4% Widowed38.4% DivorcedWomen who gave birth in the past 12 months Now married:
0.0% (0)Unmarried:
100.0% (44)
Women who did not give birth in the past 12 months Now married:
16.7% (4)Unmarried:
83.3% (20)
Marital status - White alone, not Hispanic / Latino population 15 years and over
Males 33.5% Never married48.0% Now married1.2% Separated1.3% Widowed16.0% DivorcedFemales 29.0% Never married45.1% Now married0.2% Separated9.5% Widowed16.2% DivorcedWomen who gave birth in the past 12 months Now married:
62.7% (51)Unmarried:
37.3% (30)
Women who did not give birth in the past 12 months Now married:
45.2% (867)Unmarried:
54.8% (1,050)
Marital status - Hispanic or Latino population 15 years and over
Males 42.6% Never married57.2% Now married0.0% Separated0.2% Widowed0.0% DivorcedFemales 55.2% Never married23.9% Now married0.0% Separated0.0% Widowed20.8% DivorcedWomen who gave birth in the past 12 months Now married:
0.0% (0)Unmarried:
100.0% (80)
Women who did not give birth in the past 12 months Now married:
30.7% (113)Unmarried:
69.3% (256)
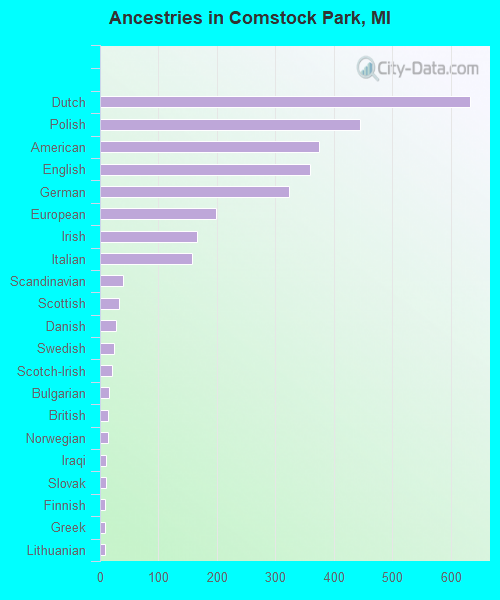
Ancestries in Comstock Park
634 13.1% Dutch445 9.2% Polish374 7.7% American360 7.4% English324 6.7% German198 4.1% European166 3.4% Irish157 3.2% Italian40 0.8% Scandinavian32 0.7% Scottish28 0.6% Danish24 0.5% Swedish21 0.4% Scotch-Irish16 0.3% Bulgarian14 0.3% British14 0.3% Norwegian11 0.2% Iraqi11 0.2% Slovak9 0.2% Finnish9 0.2% Greek8 0.2% Lithuanian
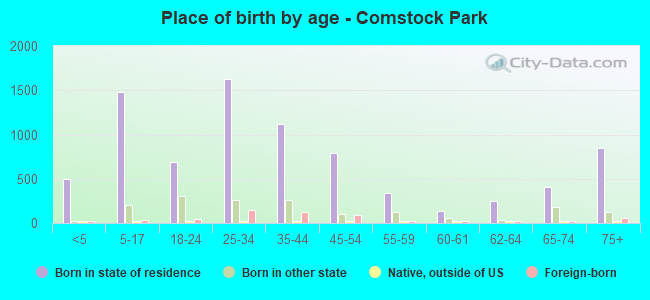
Children Nativity (place of birth) in Comstock Park
Children under 6 years - Living with two parents Both parents native 312 95.4% Native15 4.6% Foreign-bornBoth parents foreign-born 20 100.0% NativeOne native, one foreign-born parent 15 100.0% NativeChildren under 6 years - Living with one parent Native parent 270 100.0% NativeChildren 6 to 17 years - Living with two parents Both parents native 759 99.0% Native8 1.0% Foreign-bornBoth parents foreign-born 37 62.0% Native23 38.0% Foreign-bornChildren 6 to 17 years - Living with one parent Native parent 754 100.0% NativeForeign-born parent 18 51.4% Native17 48.6% Foreign-born
Grandparents responsible for own grandchildren in Comstock Park
Grandparents (30 to 59 years) White / Caucasian 34 30.9% Responsible for grandchildren77 69.1% Not responsible for grandchildrenWhite alone, not Hispanic / Latino 27 70.4% Responsible for grandchildren11 29.6% Not responsible for grandchildrenHispanic or Latino 72 100.0% Not responsible for grandchildren
Grandparents (60 years and over)