Races in Conshohocken, Pennsylvania (PA) Detailed Stats
Ancestries, Foreign-born residents, place of birth
Settings
X


Recent posts about races in Conshohocken, Pennsylvania on our local forum with over 2,400,000 registered users:
 | Just bought a house in Conshohocken/gulph terrace (9 replies) |
| Moving from CT to West Conshohocken? (3 replies) |
| Official Census results show Philly's population now over 1.6 million (85 replies) |
| Philadelphia 2035 (9298 replies) |
| The Future of Norristown (105 replies) |
| Where to find an Apartment in Conshohocken (4 replies) |
According to 2022 data, the most numerous races in Conshohocken, PA are White alone (7,858 residents), Black alone (504 residents), and Hispanic (151 residents). 94.3% of Conshohocken residents speak English at home. 4.7% of Conshohocken, PA residents are foreign-born (2.3% born in Europe, 1.3% born in Asia, 0.7% born in Latin America), which is 48.2% less than the foreign-born rate of 7.0% across the entire state of Pennsylvania.
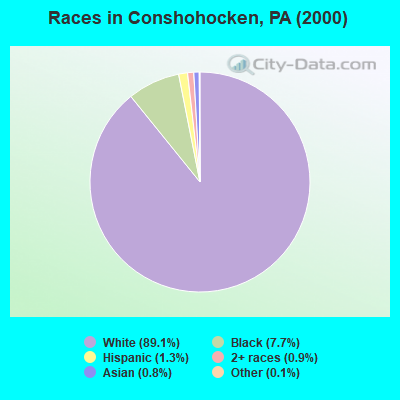
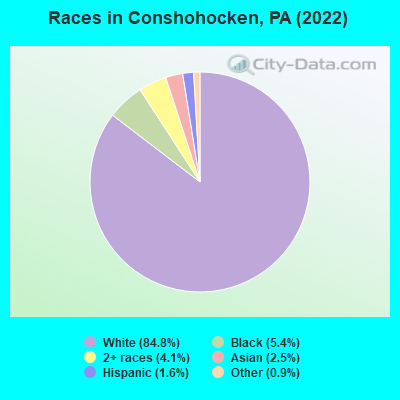
Race distribution in Conshohocken
2000
2022

- 6,76089.1%White alone
- 5837.7%Black alone
- 1021.3%Hispanic
- 650.9%Two or more races
- 640.8%Asian alone
- 80.1%Other race alone
- 60.08%American Indian alone
- 10.01%Native Hawaiian and Other
Pacific Islander alone
-
- 7,85884.8%White alone
- 5045.4%Black alone
- 3794.1%Two or more races
- 2322.5%Asian alone
- 1511.6%Hispanic
- 810.9%Other race alone
- 40.04%American Indian alone
2000
2022
-
- 10,322,45584.1%White alone
- 1,202,4379.8%Black alone
- 394,0883.2%Hispanic
- 218,2961.8%Asian alone
- 113,0970.9%Two or more races
- 13,0860.1%Other race alone
- 14,9040.1%American Indian alone
- 2,6910.02%Native Hawaiian and Other
Pacific Islander alone

-
- 9,487,22873.1%White alone
- 1,311,58110.1%Black alone
- 1,115,9978.6%Hispanic
- 493,9423.8%Two or more races
- 487,1243.8%Asian alone
- 63,5820.5%Other race alone
- 10,1300.08%American Indian alone
- 2,4240.02%Native Hawaiian and Other
Pacific Islander alone

Income and house value in Conshohocken
- Median household income in 2022
- $118,011White non-Hispanic householders
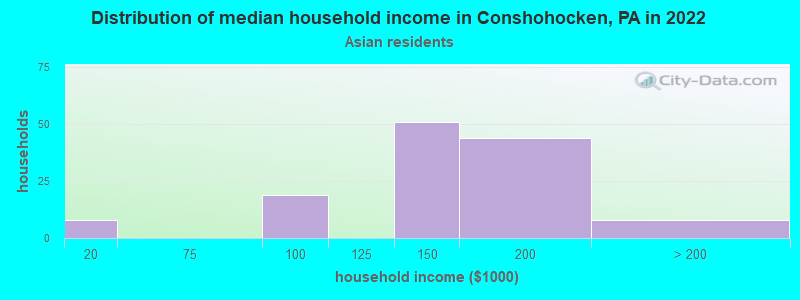
- $149,861Asian householders
- Median 2022 house value
- $415,048White Non-Hispanic householders
- $262,515Black or African American householders
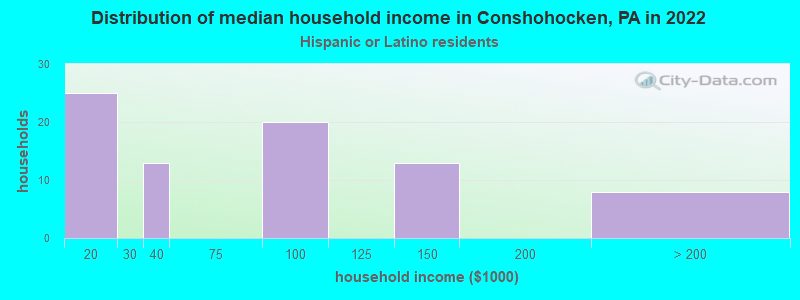
- $405,673Hispanic or Latino householders
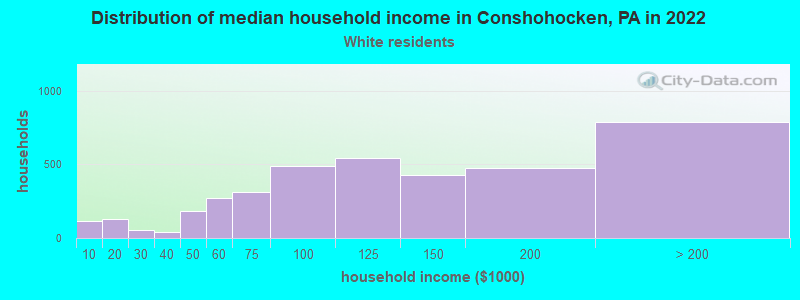
Household income for White non-Hispanic householders
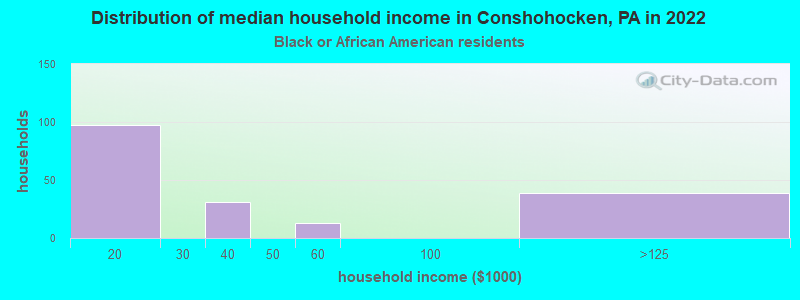
Household income for Black householders
Household income for Asian householders
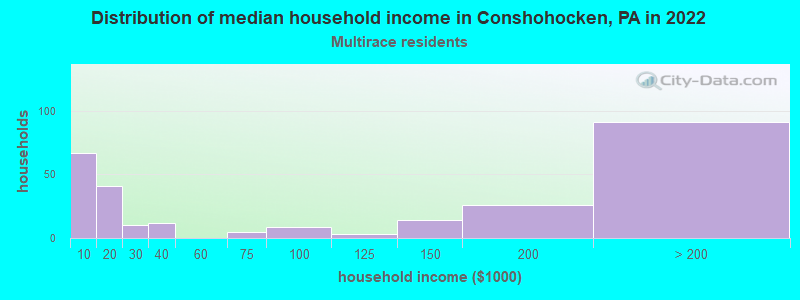
Household income for Two or more races householders
Household income for Hispanic or Latino race householders
Median age by race in Conshohocken
- 32.2Median age for White residents
- 32.8Males
- 32.0Females
- 23.6Median age for Black or African American residents
- 36.2Males
- 18.3Females
- -626,180,836.1Median age for American Indian / Alaska Native residents
- -1,098,934,549.9Males
- -577,519,379.3Females
- 34.9Median age for Asian residents
- 34.7Males
- 35.8Females
- -680,432,644.4Median age for Native Hawaiian / Pacific Islander residents
- -649,523,808.9Males
- -747,474,746.7Females
- 52.6Median age for Other race residents
- 51.6Males
- -746,136,864.6Females
- 35.7Median age for Two or more races residents
- 28.5Males
- 40.1Females
- 32.0Median age for White alone residents
- 32.7Males
- 31.6Females
- 29.8Median age for Hispanic or Latino residents
- 29.2Males
- 37.0Females
Owner/renter occupied households by race in Conshohocken
- House owners and renters - White residents
- 2,05653.6%Owner occupied
- 1,77746.4%Renter occupied
- House owners and renters - Black or African American residents
- 137.3%Owner occupied
- 16392.7%Renter occupied
- House owners and renters - American Indian / Alaska Native residents
- 5100.0%Owner occupied
- House owners and renters - Asian residents
- 8660.0%Owner occupied
- 5740.0%Renter occupied
- House owners and renters - Other race residents
- 37100.0%Owner occupied
- House owners and renters - Two or more races residents
- 13855.0%Owner occupied
- 11345.0%Renter occupied
- House owners and renters - White alone residents
- 2,06653.2%Owner occupied
- 1,82046.8%Renter occupied
- House owners and renters - Hispanic or Latino residents
- 89.4%Owner occupied
- 7890.6%Renter occupied
Language usage in Conshohocken
- English speakers - Total
- 94.3% of residents of Conshohocken speak English at home.
- 1.2% of residents speak Spanish at home
- 7571.4%Speak English very well
- 3028.6%Speak English less than very well
- 4.2% of residents speak other language at home
- 29378.1%Speak English very well
- 8221.9%Speak English less than very well
- English speakers - Born in the United States
- 95.4% of residents of Conshohocken speak English at home.
- 4.7% of residents speak other language at home
- 91100.0%Speak English very well
- English speakers - Native, born elsewhere
- 90.0% of residents of Conshohocken speak English at home.
- English speakers - Foreign-born
- 51.9% of residents of Conshohocken speak English at home.
- 3.8% of residents speak Spanish at home
- 16100.0%Speak English less than very well
- 43.6% of residents speak other language at home
- 13071.0%Speak English very well
- 5329.0%Speak English less than very well
White (Caucasian) - Speak only English
| Native: | 98.0% (7,203) |
| Foreign-born: | 71.2% (115) |
White (Caucasian) - Speak another language
| Native: | 2.1% (155) |
| Foreign-born: | 32.8% (53) |
Black or African American - Speak only English
| Native: | 99.7% (464) |
| Foreign-born: | 100.0% (38) |
Asian - Speak only English
| Native: | 22.6% (27) |
| Foreign-born: | 15.9% (23) |
Asian - Speak another language
| Native: | 81.3% (97) |
| Foreign-born: | 84.5% (124) |
Two or more races - Speak only English
| Native: | 93.5% (282) |
| Foreign-born: | 72.3% (55) |
Two or more races - Speak another language
| Native: | 5.1% (15) |
| Foreign-born: | 26.2% (20) |
White alone - Speak only English
| Native: | 97.6% (7,203) |
| Foreign-born: | 64.3% (118) |
White alone - Speak another language
| Native: | 2.4% (179) |
| Foreign-born: | 34.5% (63) |
Hispanic or Latino - Speak another language
| Native: | 14.5% (20) |
| Foreign-born: | 100.0% (14) |
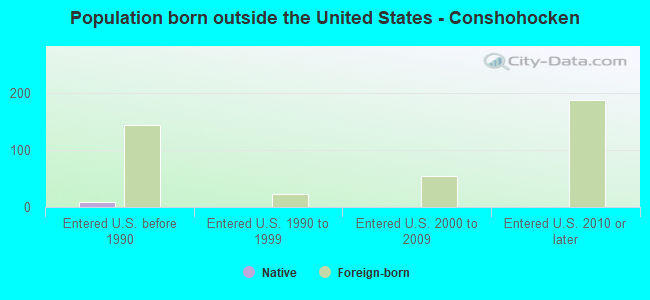
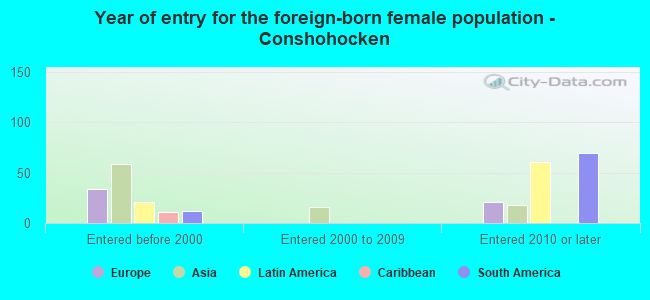
Foreign-born residents in Conshohocken
438 residents are foreign born (2.3% Europe, 1.3% Asia, 0.7% Latin America).
| This city: | 4.7% |
| Pennsylvania: | 7.3% |

Marital status for residents in Conshohocken
Marital status - White (Caucasian) population 15 years and over
- Males
- 45.4%Never married
- 42.3%Now married
- 2.9%Separated
- 2.3%Widowed
- 7.0%Divorced
- Females
- 42.1%Never married
- 46.0%Now married
- 1.6%Separated
- 4.0%Widowed
- 6.4%Divorced
Women who gave birth in the past 12 months
| Now married: | 78.6% (107) |
| Unmarried: | 21.4% (29) |
Women who did not give birth in the past 12 months
| Now married: | 44.2% (1,001) |
| Unmarried: | 55.8% (1,263) |
Marital status - Black or African American population 15 years and over
- Males
- 78.8%Never married
- 21.2%Now married
- 0.0%Separated
- 0.0%Widowed
- 0.0%Divorced
- Females
- 52.4%Never married
- 47.6%Now married
- 0.0%Separated
- 0.0%Widowed
- 0.0%Divorced
Women who did not give birth in the past 12 months
| Now married: | 52.2% (75) |
| Unmarried: | 47.8% (68) |
Marital status - Asian population 15 years and over
- Males
- 55.9%Never married
- 19.4%Now married
- 0.0%Separated
- 0.0%Widowed
- 24.7%Divorced
- Females
- 16.8%Never married
- 54.7%Now married
- 0.0%Separated
- 0.0%Widowed
- 28.6%Divorced
Women who did not give birth in the past 12 months
| Now married: | 68.6% (60) |
| Unmarried: | 31.4% (28) |
Marital status - Other race population 15 years and over
- Males
- 20.0%Never married
- 80.0%Now married
- 0.0%Separated
- 0.0%Widowed
- 0.0%Divorced
- Females
- 0.0%Never married
- 100.0%Now married
- 0.0%Separated
- 0.0%Widowed
- 0.0%Divorced
Marital status - Two or more races population 15 years and over
- Males
- 23.8%Never married
- 45.9%Now married
- 30.3%Separated
- 0.0%Widowed
- 0.0%Divorced
- Females
- 28.3%Never married
- 54.3%Now married
- 0.0%Separated
- 0.0%Widowed
- 17.4%Divorced
Women who did not give birth in the past 12 months
| Now married: | 34.0% (23) |
| Unmarried: | 66.0% (44) |
Marital status - White alone, not Hispanic / Latino population 15 years and over
- Males
- 45.3%Never married
- 42.4%Now married
- 2.9%Separated
- 2.3%Widowed
- 7.1%Divorced
- Females
- 42.2%Never married
- 45.9%Now married
- 1.6%Separated
- 4.0%Widowed
- 6.4%Divorced
Women who gave birth in the past 12 months
| Now married: | 78.6% (109) |
| Unmarried: | 21.4% (30) |
Women who did not give birth in the past 12 months
| Now married: | 44.0% (1,009) |
| Unmarried: | 56.0% (1,284) |
Marital status - Hispanic or Latino population 15 years and over
- Males
- 77.3%Never married
- 22.7%Now married
- 0.0%Separated
- 0.0%Widowed
- 0.0%Divorced
- Females
- 25.6%Never married
- 18.6%Now married
- 0.0%Separated
- 0.0%Widowed
- 55.8%Divorced
Women who did not give birth in the past 12 months
| Now married: | 42.1% (9) |
| Unmarried: | 57.9% (12) |
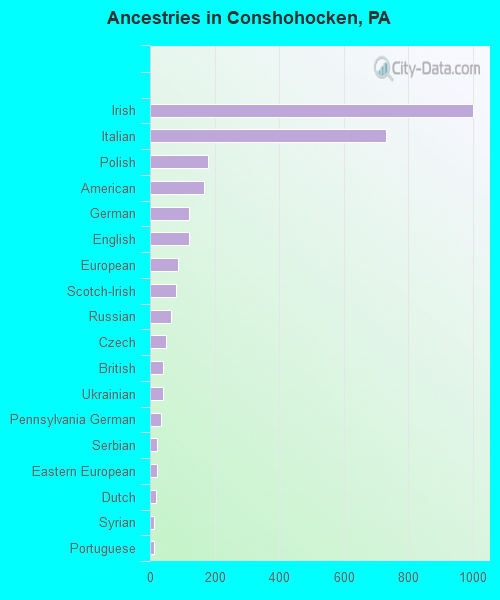
Ancestries in Conshohocken

- 1,00130.3%Irish
- 73322.2%Italian
- 1805.5%Polish
- 1685.1%American
- 1223.7%German
- 1213.7%English
- 872.6%European
- 812.5%Scotch-Irish
- 641.9%Russian
- 491.5%Czech
- 411.2%British
- 391.2%Ukrainian
- 331.0%Pennsylvania German
- 230.7%Serbian
- 220.7%Eastern European
- 180.5%Dutch
- 110.3%Syrian
- 110.3%Portuguese
- 90.3%Lebanese
- 90.3%Scottish
- 40.1%Norwegian
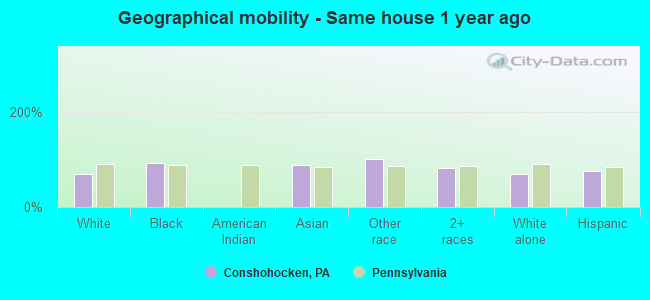
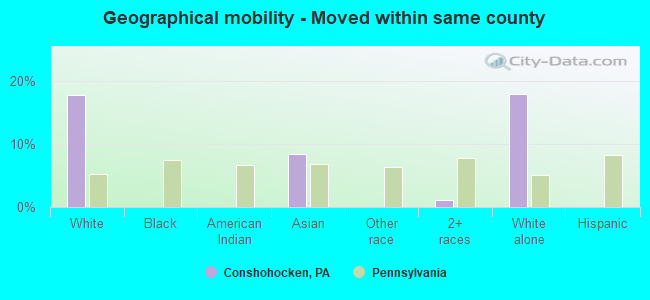
Geographical mobility in Conshohocken

- Same house 1 year ago
- 5,42770.4%White (Caucasian)
- 45892.2%Black or African American
- 23088.0%Asian
- 137100.0%Other race
- 34581.9%Two or more races
- 5,48070.4%White alone, not Hispanic / Latino
- 11475.6%Hispanic or Latino
-
- Moved within same county
- 1,36317.7%White / Caucasian
- 228.3%Asian
- 51.1%Two or more races
- 1,39117.9%White alone, not Hispanic / Latino
-
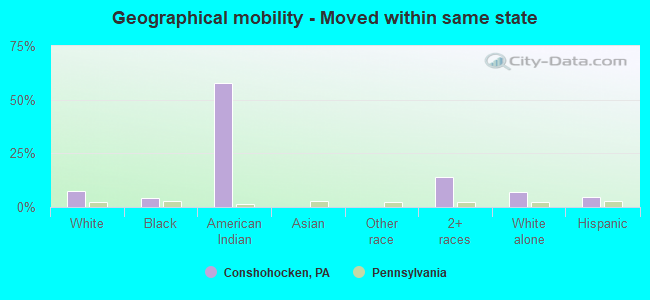
- Moved within same state
- 5587.2%White / Caucasian
- 214.1%Black or African American
- 357.6%American Indian / Alaska Native
- 5813.9%Two or more races
- 5567.1%White alone, not Hispanic / Latino
- 74.7%Hispanic or Latino
-
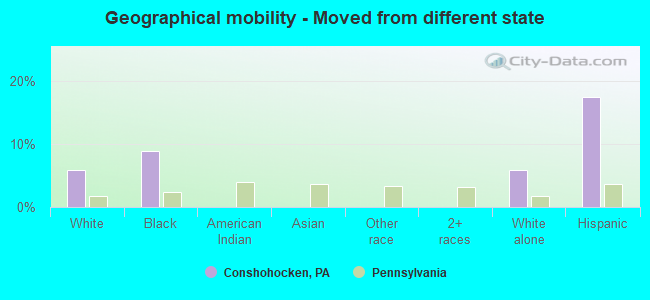
- Moved from different state
- 4495.8%White / Caucasian
- 448.8%Black or African American
- 4575.9%White alone, not Hispanic / Latino
- 2617.5%Hispanic or Latino
-
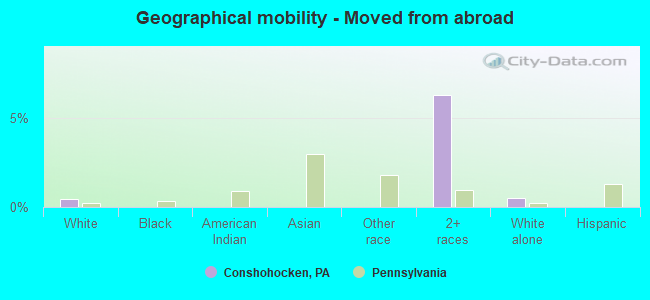
- Moved from abroad
- 350.5%White
- 266.2%Two or more races
- 380.5%White alone, not Hispanic / Latino
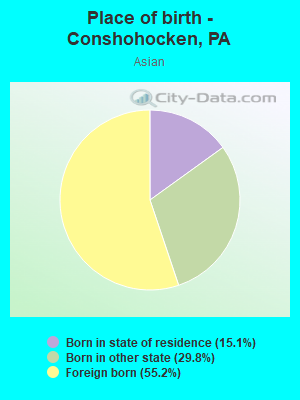
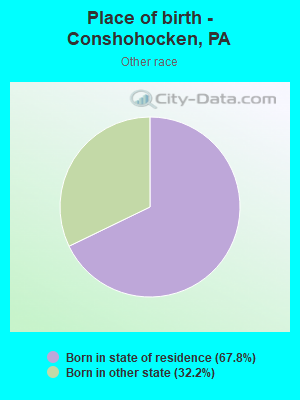
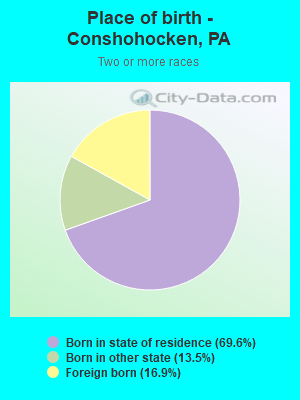
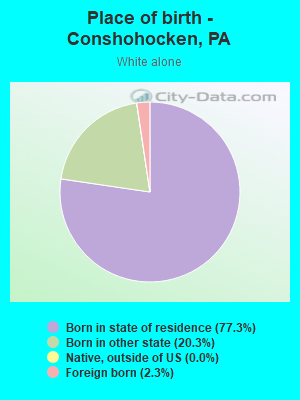
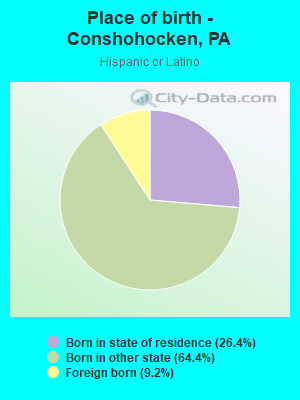
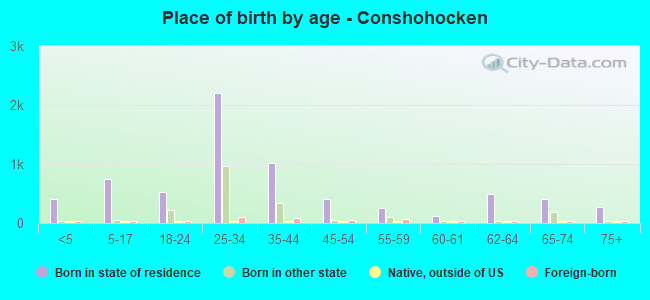
Children Nativity (place of birth) in Conshohocken
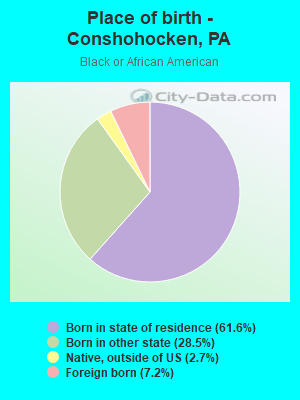
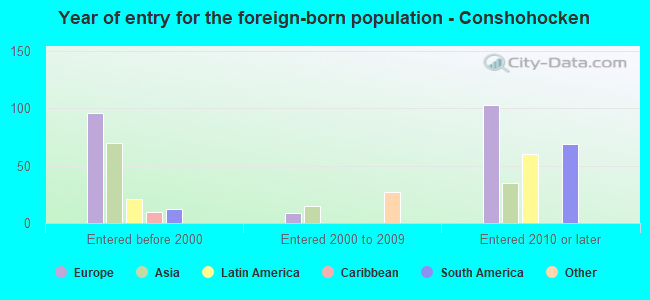
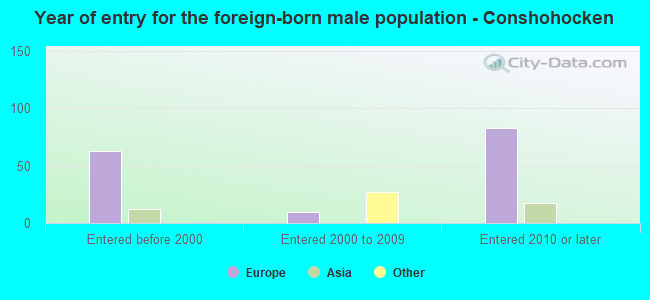
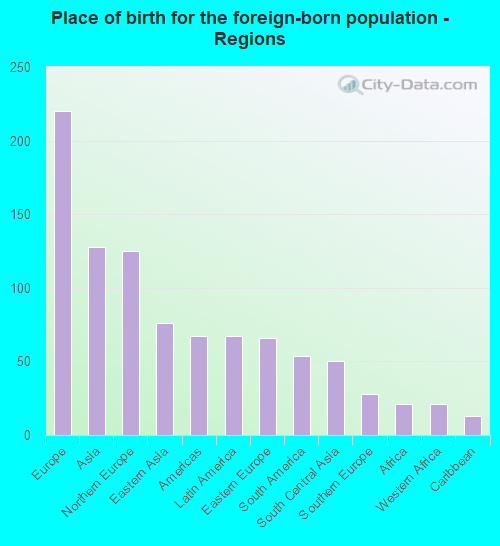
Place of birth for residents in Conshohocken
![Place of birth for the foreign-born population - Regions]()
- 220Europe
- 128Asia
- 125Northern Europe
- 76Eastern Asia
- 67Americas
- 67Latin America
- 66Eastern Europe
- 54South America
- 50South Central Asia
- 28Southern Europe
- 21Africa
- 21Western Africa
- 13Caribbean
- 1South Eastern Asia
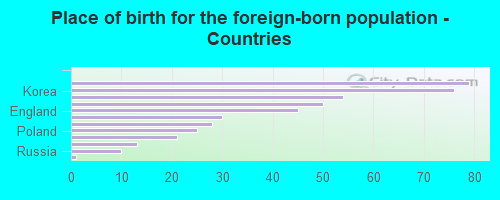
![Place of birth for the foreign-born population - Countries]()
- 79United Kingdom
- 76Korea
- 54Brazil
- 50India
- 45England
- 30Ukraine
- 28Italy
- 25Poland
- 21Nigeria
- 13Dominican Republic
- 10Russia
- 1Vietnam
Zip codes: 19428.