Races in Conway, Florida (FL) Detailed Stats
Data:
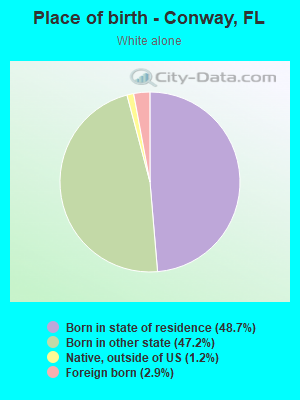
Races - White alone (%)
Races - White alone (% change since 2000)
Races - Black alone (%)
Races - Black alone (% change since 2000)
Races - American Indian alone (%)
Races - American Indian alone (% change since 2000)
Races - Asian alone (%)
Races - Asian alone (% change since 2000)
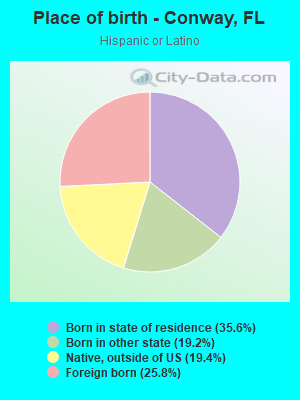
Races - Hispanic (%)
Races - Hispanic (% change since 2000)
Races - Native Hawaiian and Other Pacific Islander alone (%)
Races - Native Hawaiian and Other Pacific Islander alone (% change since 2000)
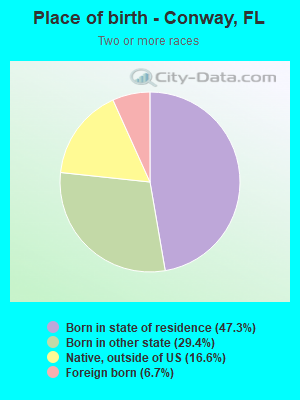
Races - Two or more races(%)
Races - Two or more races(% change since 2000)
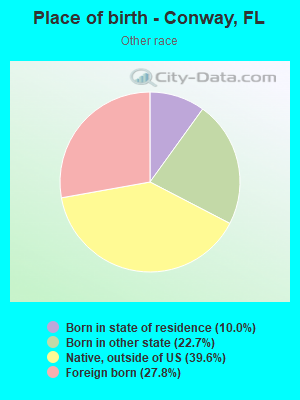
Races - Other race alone (%)
Races - Other race alone (% change since 2000)
Racial diversity
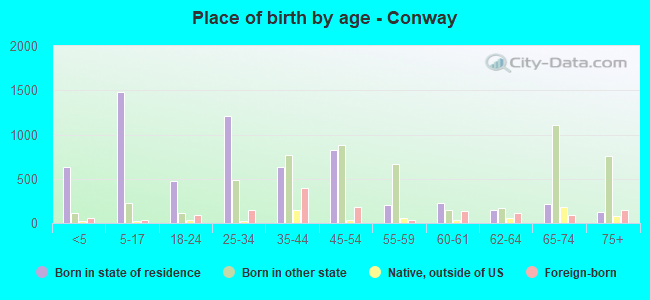
Place of birth - Born in state of residence (%)
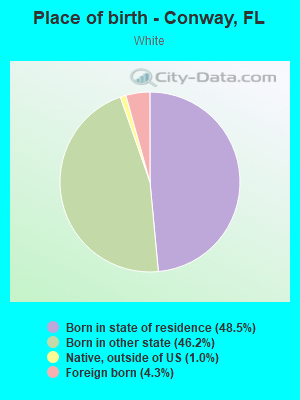
Place of birth - Born in state of residence (%) - White
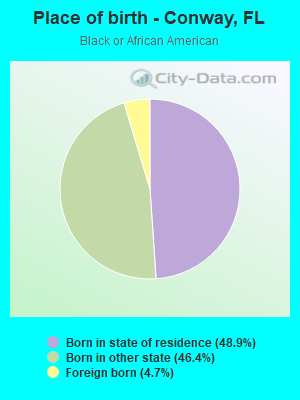
Place of birth - Born in state of residence (%) - Black or African American
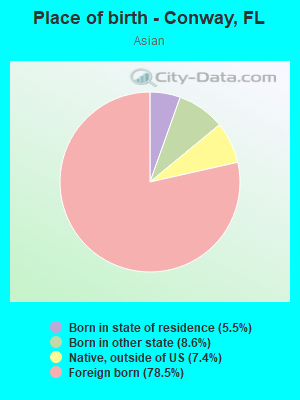
Place of birth - Born in state of residence (%) - Asian
Place of birth - Born in state of residence (%) - Hispanic or Latino
Place of birth - Born in state of residence (%) - American Indian and Alaska Native
Place of birth - Born in state of residence (%) - Multirace
Place of birth - Born in state of residence (%) - Other Race
Place of birth - Born in other state (%)
Place of birth - Born in other state (%) - White
Place of birth - Born in other state (%) - Black or African American
Place of birth - Born in other state (%) - Asian
Place of birth - Born in other state (%) - Hispanic or Latino
Place of birth - Born in other state (%) - American Indian and Alaska Native
Place of birth - Born in other state (%) - Multirace
Place of birth - Born in other state (%) - Other Race
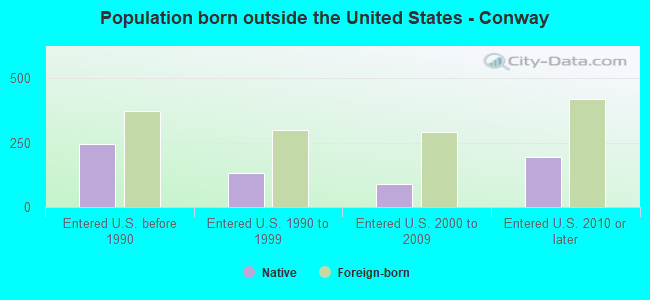
Place of birth - Native, outside of US (%)
Place of birth - Native, outside of US (%) - White
Place of birth - Native, outside of US (%) - Black or African American
Place of birth - Native, outside of US (%) - Asian
Place of birth - Native, outside of US (%) - Hispanic or Latino
Place of birth - Native, outside of US (%) - American Indian and Alaska Native
Place of birth - Native, outside of US (%) - Multirace
Place of birth - Native, outside of US (%) - Other Race
Place of birth - Foreign born (%)
Place of birth - Foreign born (%) - White
Place of birth - Foreign born (%) - Black or African American
Place of birth - Foreign born (%) - Asian
Place of birth - Foreign born (%) - Hispanic or Latino
Place of birth - Foreign born (%) - American Indian and Alaska Native
Place of birth - Foreign born (%) - Multirace
Place of birth - Foreign born (%) - Other Race
Residents speaking English at home (%)
Residents speaking English at home - Born in the United States (%)
Residents speaking English at home - Native, born elsewhere (%)
Residents speaking English at home - Foreign born (%)
Residents speaking Spanish at home (%)
Residents speaking Spanish at home - Born in the United States (%)
Residents speaking Spanish at home - Native, born elsewhere (%)
Residents speaking Spanish at home - Foreign born (%)
Residents speaking other language at home (%)
Residents speaking other language at home - Born in the United States (%)
Residents speaking other language at home - Native, born elsewhere (%)
Residents speaking other language at home - Foreign born (%)
Marital status - Never married (%)
Marital status - Now married (%)
Marital status - Separated (%)
Marital status - Widowed (%)
Marital status - Divorced (%)
Ancestries Reported - Arab (%)
Ancestries Reported - Czech (%)
Ancestries Reported - Danish (%)
Ancestries Reported - Dutch (%)
Ancestries Reported - English (%)
Ancestries Reported - French (%)
Ancestries Reported - French Canadian (%)
Ancestries Reported - German (%)
Ancestries Reported - Greek (%)
Ancestries Reported - Hungarian (%)
Ancestries Reported - Irish (%)
Ancestries Reported - Italian (%)
Ancestries Reported - Lithuanian (%)
Ancestries Reported - Norwegian (%)
Ancestries Reported - Polish (%)
Ancestries Reported - Portuguese (%)
Ancestries Reported - Russian (%)
Ancestries Reported - Scotch-Irish (%)
Ancestries Reported - Scottish (%)
Ancestries Reported - Slovak (%)
Ancestries Reported - Subsaharan African (%)
Ancestries Reported - Swedish (%)
Ancestries Reported - Swiss (%)
Ancestries Reported - Ukrainian (%)
Ancestries Reported - United States (%)
Ancestries Reported - Welsh (%)
Ancestries Reported - West Indian (%)
Ancestries Reported - Other (%)
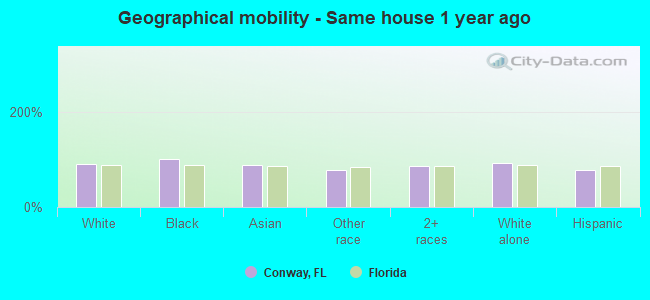
Geographical mobility - Same house 1 year ago (%)
Geographical mobility - Same house 1 year ago (%) - White
Geographical mobility - Same house 1 year ago (%) - Black or African American
Geographical mobility - Same house 1 year ago (%) - Asian
Geographical mobility - Same house 1 year ago (%) - Hispanic or Latino
Geographical mobility - Same house 1 year ago (%) - American Indian and Alaska Native
Geographical mobility - Same house 1 year ago (%) - Multirace
Geographical mobility - Same house 1 year ago (%) - Other Race
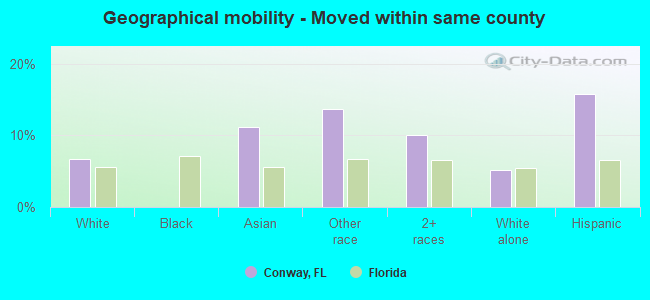
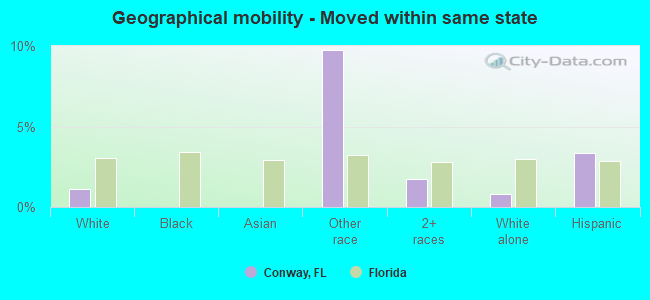
Geographical mobility - Moved within same county (%)
Geographical mobility - Moved within same county (%) - White
Geographical mobility - Moved within same county (%) - Black or African American
Geographical mobility - Moved within same county (%) - Asian
Geographical mobility - Moved within same county (%) - Hispanic or Latino
Geographical mobility - Moved within same county (%) - American Indian and Alaska Native
Geographical mobility - Moved within same county (%) - Multirace
Geographical mobility - Moved within same county (%) - Other Race
Geographical mobility - Moved from different county within same state (%)
Geographical mobility - Moved from different county within same state (%) - White
Geographical mobility - Moved from different county within same state (%) - Black or African American
Geographical mobility - Moved from different county within same state (%) - Asian
Geographical mobility - Moved from different county within same state (%) - Hispanic or Latino
Geographical mobility - Moved from different county within same state (%) - American Indian and Alaska Native
Geographical mobility - Moved from different county within same state (%) - Multirace
Geographical mobility - Moved from different county within same state (%) - Other Race
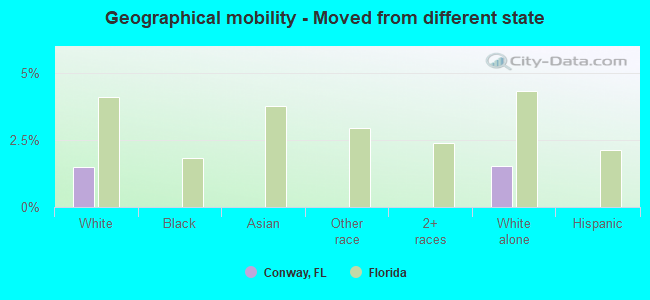
Geographical mobility - Moved from different state (%)
Geographical mobility - Moved from different state (%) - White
Geographical mobility - Moved from different state (%) - Black or African American
Geographical mobility - Moved from different state (%) - Asian
Geographical mobility - Moved from different state (%) - Hispanic or Latino
Geographical mobility - Moved from different state (%) - American Indian and Alaska Native
Geographical mobility - Moved from different state (%) - Multirace
Geographical mobility - Moved from different state (%) - Other Race
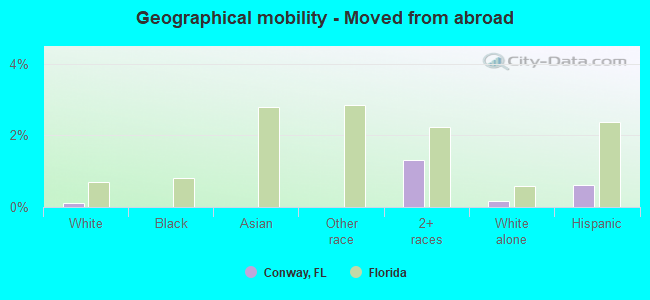
Geographical mobility - Moved from abroad (%)
Geographical mobility - Moved from abroad (%) - White
Geographical mobility - Moved from abroad (%) - Black or African American
Geographical mobility - Moved from abroad (%) - Asian
Geographical mobility - Moved from abroad (%) - Hispanic or Latino
Geographical mobility - Moved from abroad (%) - American Indian and Alaska Native
Geographical mobility - Moved from abroad (%) - Multirace
Geographical mobility - Moved from abroad (%) - Other Race
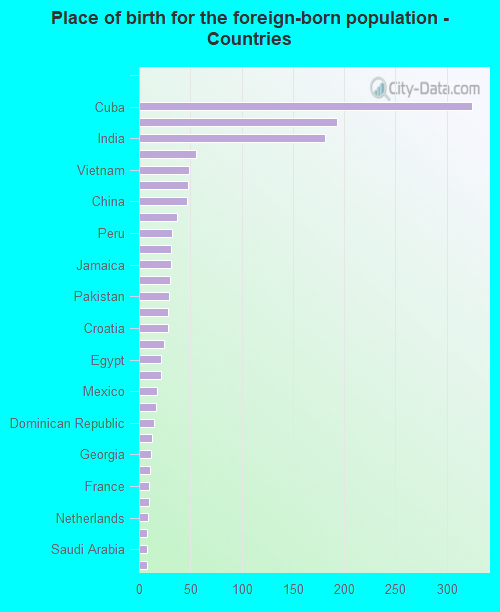
Place of birth for the foreign-born population - Ireland (%)
Place of birth for the foreign-born population - Denmark (%)
Place of birth for the foreign-born population - Norway (%)
Place of birth for the foreign-born population - Sweden (%)
Place of birth for the foreign-born population - United Kingdom (%)
Place of birth for the foreign-born population - England (%)
Place of birth for the foreign-born population - Scotland (%)
Place of birth for the foreign-born population - Other Northern Europe (%)
Place of birth for the foreign-born population - Austria (%)
Place of birth for the foreign-born population - Belgium (%)
Place of birth for the foreign-born population - France (%)
Place of birth for the foreign-born population - Germany (%)
Place of birth for the foreign-born population - Netherlands (%)
Place of birth for the foreign-born population - Switzerland (%)
Place of birth for the foreign-born population - Other Western Europe (%)
Place of birth for the foreign-born population - Greece (%)
Place of birth for the foreign-born population - Italy (%)
Place of birth for the foreign-born population - Portugal (%)
Place of birth for the foreign-born population - Spain (%)
Place of birth for the foreign-born population - Other Southern Europe (%)
Place of birth for the foreign-born population - Albania (%)
Place of birth for the foreign-born population - Belarus (%)
Place of birth for the foreign-born population - Bosnia and Herzegovina (%)
Place of birth for the foreign-born population - Bulgaria (%)
Place of birth for the foreign-born population - Croatia (%)
Place of birth for the foreign-born population - Czechoslovakia (%)
Place of birth for the foreign-born population - Hungary (%)
Place of birth for the foreign-born population - Latvia (%)
Place of birth for the foreign-born population - Lithuania (%)
Place of birth for the foreign-born population - North Macedonia (Macedonia) (%)
Place of birth for the foreign-born population - Moldova (%)
Place of birth for the foreign-born population - Poland (%)
Place of birth for the foreign-born population - Romania (%)
Place of birth for the foreign-born population - Russia (%)
Place of birth for the foreign-born population - Serbia (%)
Place of birth for the foreign-born population - Ukraine (%)
Place of birth for the foreign-born population - Other Eastern Europe (%)
Place of birth for the foreign-born population - China (%)
Place of birth for the foreign-born population - Hong Kong (%)
Place of birth for the foreign-born population - Taiwan (%)
Place of birth for the foreign-born population - Japan (%)
Place of birth for the foreign-born population - Korea (%)
Place of birth for the foreign-born population - Other Eastern Asia (%)
Place of birth for the foreign-born population - Afghanistan (%)
Place of birth for the foreign-born population - Bangladesh (%)
Place of birth for the foreign-born population - India (%)
Place of birth for the foreign-born population - Iran (%)
Place of birth for the foreign-born population - Kazakhstan (%)
Place of birth for the foreign-born population - Nepal (%)
Place of birth for the foreign-born population - Pakistan (%)
Place of birth for the foreign-born population - Sri Lanka (%)
Place of birth for the foreign-born population - Uzbekistan (%)
Place of birth for the foreign-born population - Other South Central Asia (%)
Place of birth for the foreign-born population - Burma (%)
Place of birth for the foreign-born population - Cambodia (%)
Place of birth for the foreign-born population - Indonesia (%)
Place of birth for the foreign-born population - Laos (%)
Place of birth for the foreign-born population - Malaysia (%)
Place of birth for the foreign-born population - Philippines (%)
Place of birth for the foreign-born population - Singapore (%)
Place of birth for the foreign-born population - Thailand (%)
Place of birth for the foreign-born population - Vietnam (%)
Place of birth for the foreign-born population - Other South Eastern Asia (%)
Place of birth for the foreign-born population - Armenia (%)
Place of birth for the foreign-born population - Iraq (%)
Place of birth for the foreign-born population - Israel (%)
Place of birth for the foreign-born population - Jordan (%)
Place of birth for the foreign-born population - Kuwait (%)
Place of birth for the foreign-born population - Lebanon (%)
Place of birth for the foreign-born population - Saudi Arabia (%)
Place of birth for the foreign-born population - Syria (%)
Place of birth for the foreign-born population - Turkey (%)
Place of birth for the foreign-born population - Yemen (%)
Place of birth for the foreign-born population - Other Western Asia (%)
Place of birth for the foreign-born population - Eritrea (%)
Place of birth for the foreign-born population - Ethiopia (%)
Place of birth for the foreign-born population - Kenya (%)
Place of birth for the foreign-born population - Somalia (%)
Place of birth for the foreign-born population - Uganda (%)
Place of birth for the foreign-born population - Zimbabwe (%)
Place of birth for the foreign-born population - Other Eastern Africa (%)
Place of birth for the foreign-born population - Cameroon (%)
Place of birth for the foreign-born population - Congo (%)
Place of birth for the foreign-born population - Democratic Republic of Congo (Zaire) (%)
Place of birth for the foreign-born population - Other Middle Africa (%)
Place of birth for the foreign-born population - Egypt (%)
Place of birth for the foreign-born population - Morocco (%)
Place of birth for the foreign-born population - Sudan (%)
Place of birth for the foreign-born population - Other Northern Africa (%)
Place of birth for the foreign-born population - South Africa (%)
Place of birth for the foreign-born population - Other Southern Africa (%)
Place of birth for the foreign-born population - Cabo Verde (%)
Place of birth for the foreign-born population - Ghana (%)
Place of birth for the foreign-born population - Liberia (%)
Place of birth for the foreign-born population - Nigeria (%)
Place of birth for the foreign-born population - Senegal (%)
Place of birth for the foreign-born population - Sierra Leone (%)
Place of birth for the foreign-born population - Other Western Africa (%)
Place of birth for the foreign-born population - Australia (%)
Place of birth for the foreign-born population - New Zealand (%)
Place of birth for the foreign-born population - Fiji (%)
Place of birth for the foreign-born population - Micronesia (%)
Place of birth for the foreign-born population - Bahamas (%)
Place of birth for the foreign-born population - Barbados (%)
Place of birth for the foreign-born population - Cuba (%)
Place of birth for the foreign-born population - Dominica (%)
Place of birth for the foreign-born population - Dominican Republic (%)
Place of birth for the foreign-born population - Grenada (%)
Place of birth for the foreign-born population - Haiti (%)
Place of birth for the foreign-born population - Jamaica (%)
Place of birth for the foreign-born population - St. Vincent and the Grenadines (%)
Place of birth for the foreign-born population - Trinidad and Tobago (%)
Place of birth for the foreign-born population - West Indies (%)
Place of birth for the foreign-born population - Other Caribbean (%)
Place of birth for the foreign-born population - Belize (%)
Place of birth for the foreign-born population - Costa Rica (%)
Place of birth for the foreign-born population - El Salvador (%)
Place of birth for the foreign-born population - Guatemala (%)
Place of birth for the foreign-born population - Honduras (%)
Place of birth for the foreign-born population - Mexico (%)
Place of birth for the foreign-born population - Nicaragua (%)
Place of birth for the foreign-born population - Panama (%)
Place of birth for the foreign-born population - Other Central America (%)
Place of birth for the foreign-born population - Argentina (%)
Place of birth for the foreign-born population - Bolivia (%)
Place of birth for the foreign-born population - Brazil (%)
Place of birth for the foreign-born population - Chile (%)
Place of birth for the foreign-born population - Colombia (%)
Place of birth for the foreign-born population - Ecuador (%)
Place of birth for the foreign-born population - Guyana (%)
Place of birth for the foreign-born population - Peru (%)
Place of birth for the foreign-born population - Uruguay (%)
Place of birth for the foreign-born population - Venezuela (%)
Place of birth for the foreign-born population - Other South America (%)
Place of birth for the foreign-born population - Canada (%)
Place of birth for the foreign-born population - Other Northern America (%)
Place of birth for the foreign-born population - Other (%)
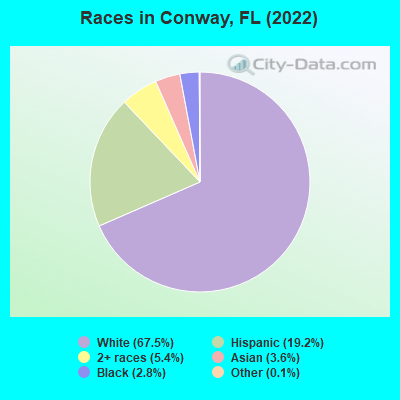
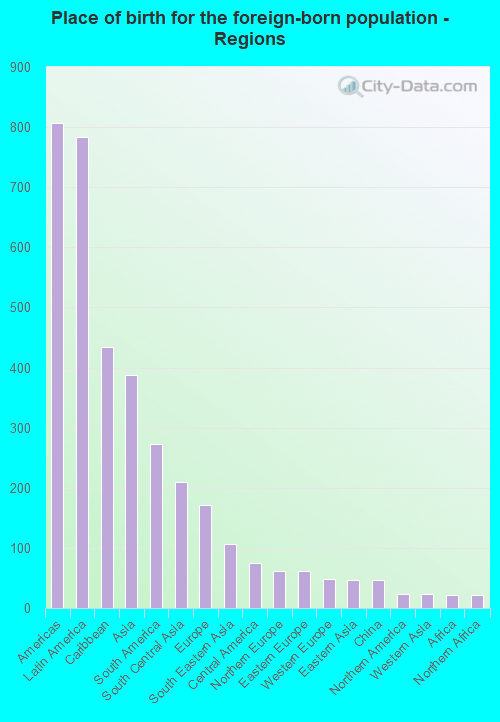
According to 2022 data, the most numerous races in Conway, FL are White alone (9,293 residents), Hispanic (2,644 residents), and Black alone (389 residents). 80.9% of Conway residents speak English at home. 10.1% of Conway, FL residents are foreign-born (5.5% born in Latin America, 2.7% born in Asia, 1.2% born in Europe), which is 108.0% less than the foreign-born rate of 21.0% across the entire state of Florida.
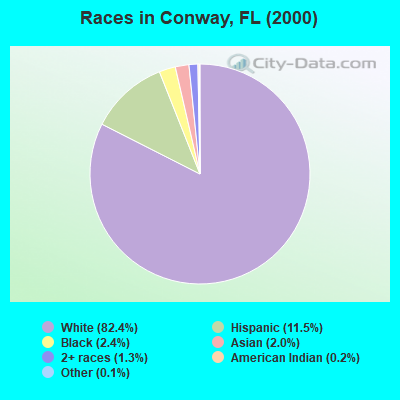
Race distribution in Conway
2000 2022
10,458,509 65.4% White alone 2,682,715 16.8% Hispanic 2,264,268 14.2% Black alone 261,693 1.6% Asian alone 236,954 1.5% Two or more races 42,358 0.3% American Indian alone 28,994 0.2% Other race alone 6,887 0.04% Native Hawaiian and Other
11,309,403 50.8% White alone 6,025,039 27.1% Hispanic 3,241,015 14.6% Black alone 861,630 3.9% Two or more races 623,692 2.8% Asian alone 152,054 0.7% Other race alone 22,504 0.1% American Indian alone 9,486 0.04% Native Hawaiian and Other
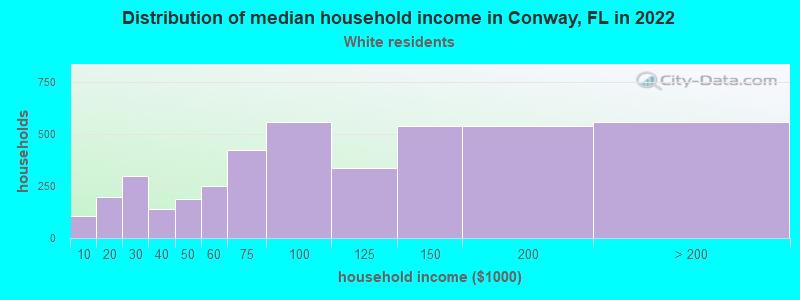
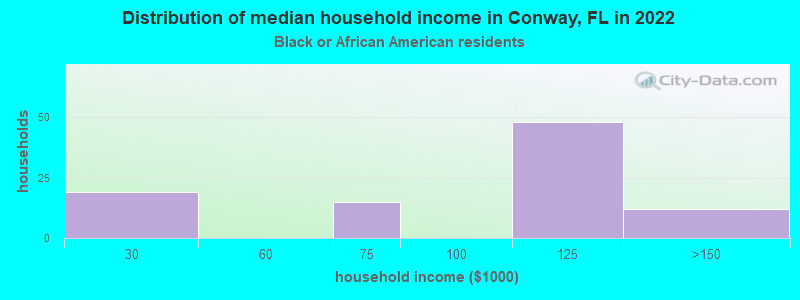
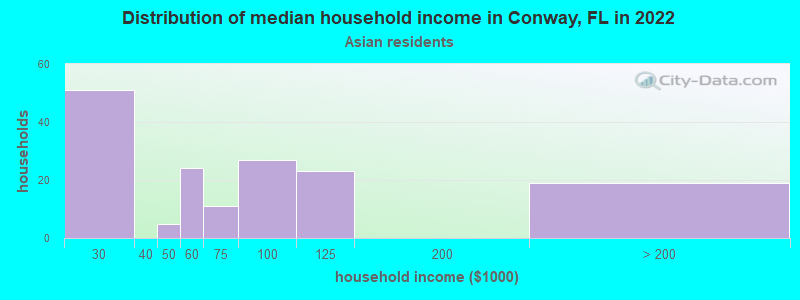
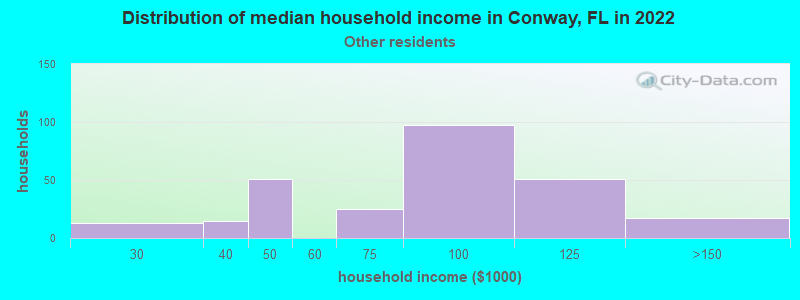
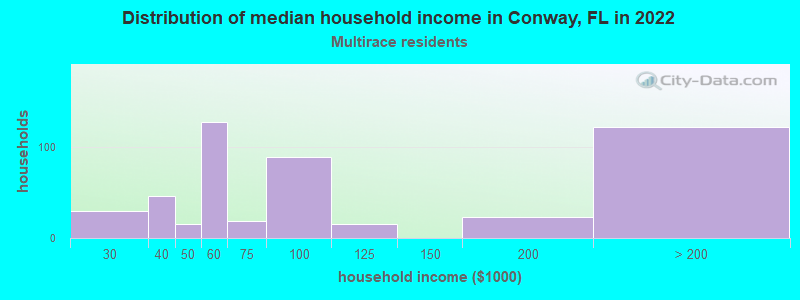
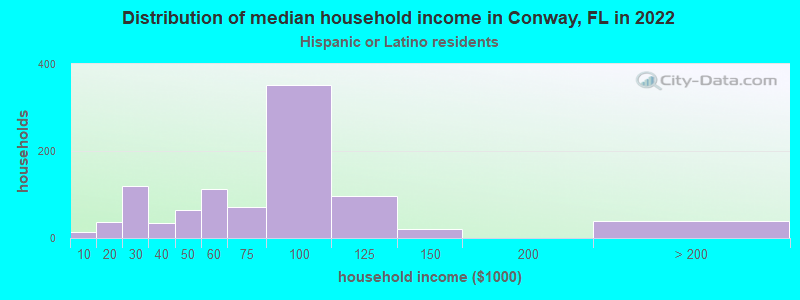
Income and house value in Conway Median household income in 2022 $97,692 White non-Hispanic householders$112,367 Black householders$83,589 Asian householders$99,088 Some other race householders$66,697 Two or more races householders$78,465 Hispanic or Latino race householdersMedian 2022 house value $406,451 White Non-Hispanic householders$311,136 Black or African American householders$127,654 American Indian or Alaska Native householders $680,822 Asian householders$360,836 Some other race householders$431,301 Two or more races householders$350,964 Hispanic or Latino householders
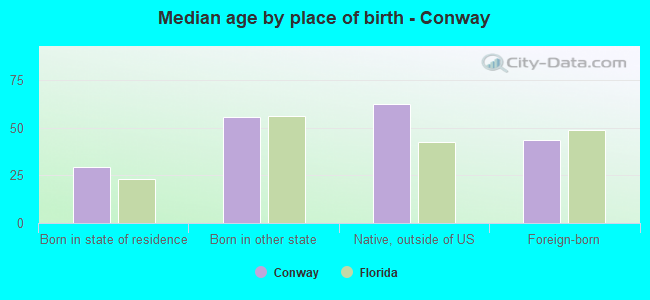
Median age by race in Conway
48.7 Median age for White residents49.0 48.3 31.2 Median age for Black or African American residents11.8 32.4 -614,300,100.1 Median age for American Indian / Alaska Native residents-735,632,183.2 -529,680,364.8 48.3 Median age for Asian residents45.3 49.4 -679,790,025.6 Median age for Native Hawaiian / Pacific Islander residents-1,327,635,326.3 -611,111,110.5 39.7 Median age for Other race residents36.9 42.6 38.3 Median age for Two or more races residents18.0 51.8 50.5 Median age for White alone residents50.1 51.3 37.3 Median age for Hispanic or Latino residents27.0 38.9
Owner/renter occupied households by race in Conway
House owners and renters - White residents 3,608 85.3% Owner occupied624 14.7% Renter occupiedHouse owners and renters - Black or African American residents 87 87.5% Owner occupied12 12.5% Renter occupiedHouse owners and renters - Asian residents 112 73.5% Owner occupied40 26.5% Renter occupiedHouse owners and renters - Other race residents 235 85.1% Owner occupied41 14.9% Renter occupiedHouse owners and renters - Two or more races residents 399 85.8% Owner occupied66 14.2% Renter occupiedHouse owners and renters - White alone residents 3,692 87.2% Owner occupied543 12.8% Renter occupiedHouse owners and renters - Hispanic or Latino residents 670 69.5% Owner occupied294 30.5% Renter occupied
Language usage in Conway
English speakers - Total 80.9% of residents of Conway speak English at home.
14.0% of residents speak Spanish at home 1,322 73.0% Speak English very well489 27.0% Speak English less than very well4.8% of residents speak other language at home 499 80.0% Speak English very well125 20.0% Speak English less than very well
English speakers - Born in the United States 88.5% of residents of Conway speak English at home.
7.9% of residents speak Spanish at home 421 100.0% Speak English very well3.3% of residents speak other language at home 178 100.0% Speak English very well
English speakers - Native, born elsewhere 24.0% of residents of Conway speak English at home.
76.4% of residents speak Spanish at home 340 69.2% Speak English very well151 30.8% Speak English less than very well
English speakers - Foreign-born 28.0% of residents of Conway speak English at home.
44.8% of residents speak Spanish at home 363 60.3% Speak English very well239 39.7% Speak English less than very well26.6% of residents speak other language at home 233 65.1% Speak English very well125 34.9% Speak English less than very well
White (Caucasian) - Speak only English Native:
100.0% (8,139)Foreign-born:
36.8% (134)
White (Caucasian) - Speak another language Native:
4.3% (350)Foreign-born:
66.7% (243)
Black or African American - Speak only English Native:
89.5% (363)Foreign-born:
100.0% (21)
Asian - Speak only English Native:
91.5% (95)Foreign-born:
40.7% (165)
Asian - Speak another language Native:
13.4% (14)Foreign-born:
61.0% (247)
Other race - Speak another language Native:
71.7% (370)Foreign-born:
100.0% (207)
Two or more races - Speak another language Native:
37.3% (613)Foreign-born:
100.0% (140)
White alone - Speak only English Native:
95.5% (8,278)Foreign-born:
49.6% (133)
White alone - Speak another language Native:
4.4% (384)Foreign-born:
42.9% (115)
Hispanic or Latino - Speak only English Native:
45.5% (786)Foreign-born:
4.6% (29)
Hispanic or Latino - Speak another language Native:
56.3% (972)Foreign-born:
95.5% (596)
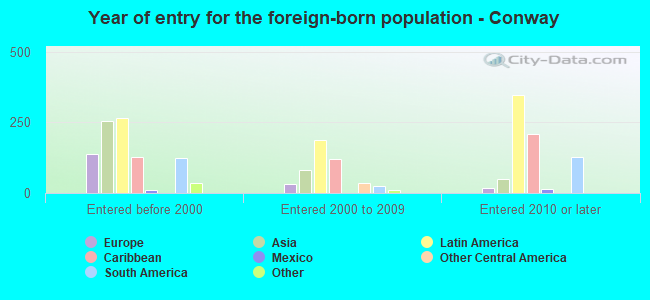
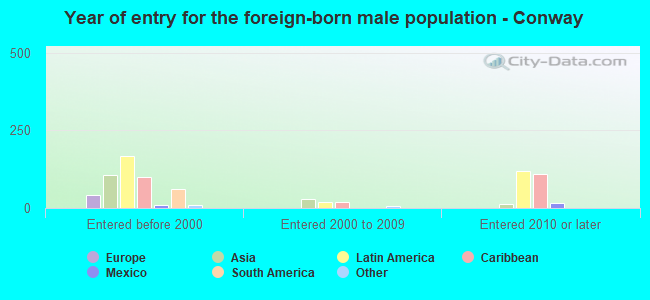
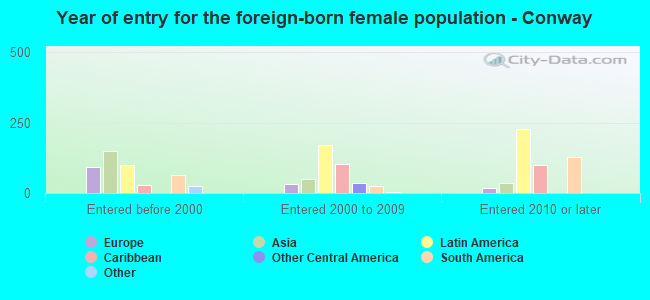
Foreign-born residents in Conway 1,389 residents are foreign born (5.5% Latin America , 2.7% Asia , 1.2% Europe ).
This city:
10.1%Florida:
21.1%
Marital status for residents in Conway Marital status - White (Caucasian) population 15 years and over
Males 27.8% Never married60.2% Now married0.5% Separated3.7% Widowed7.8% DivorcedFemales 25.5% Never married55.4% Now married0.7% Separated4.8% Widowed13.6% DivorcedWomen who gave birth in the past 12 months Now married:
90.4% (136)Unmarried:
9.6% (15)
Women who did not give birth in the past 12 months Now married:
48.5% (820)Unmarried:
51.5% (872)
Marital status - Black or African American population 15 years and over
Males 37.0% Never married63.0% Now married0.0% Separated0.0% Widowed0.0% DivorcedFemales 77.4% Never married14.8% Now married0.0% Separated0.0% Widowed7.8% DivorcedWomen who did not give birth in the past 12 months Now married:
15.9% (39)Unmarried:
84.1% (207)
Marital status - Asian population 15 years and over
Males 29.8% Never married40.9% Now married0.0% Separated0.0% Widowed29.3% DivorcedFemales 30.7% Never married58.6% Now married0.0% Separated4.4% Widowed6.4% DivorcedWomen who did not give birth in the past 12 months Now married:
37.6% (57)Unmarried:
62.4% (94)
Marital status - Other race population 15 years and over
Males 52.3% Never married43.5% Now married0.0% Separated0.0% Widowed4.2% DivorcedFemales 14.3% Never married38.2% Now married9.6% Separated19.5% Widowed18.3% DivorcedWomen who did not give birth in the past 12 months Now married:
58.7% (126)Unmarried:
41.3% (88)
Marital status - Two or more races population 15 years and over
Males 43.7% Never married47.7% Now married0.0% Separated0.0% Widowed8.6% DivorcedFemales 7.3% Never married58.0% Now married0.0% Separated13.4% Widowed21.4% DivorcedWomen who did not give birth in the past 12 months Now married:
56.8% (173)Unmarried:
43.2% (132)
Marital status - White alone, not Hispanic / Latino population 15 years and over
Males 26.4% Never married61.7% Now married0.5% Separated4.0% Widowed7.4% DivorcedFemales 24.6% Never married56.3% Now married0.7% Separated4.8% Widowed13.5% DivorcedWomen who gave birth in the past 12 months Now married:
85.0% (98)Unmarried:
15.0% (17)
Women who did not give birth in the past 12 months Now married:
49.8% (861)Unmarried:
50.2% (868)
Marital status - Hispanic or Latino population 15 years and over
Males 52.1% Never married40.3% Now married0.0% Separated0.0% Widowed7.6% DivorcedFemales 23.7% Never married46.2% Now married2.2% Separated11.9% Widowed16.0% DivorcedWomen who gave birth in the past 12 months Now married:
100.0% (68)Unmarried:
0.0% (0)
Women who did not give birth in the past 12 months Now married:
43.6% (273)Unmarried:
56.4% (353)
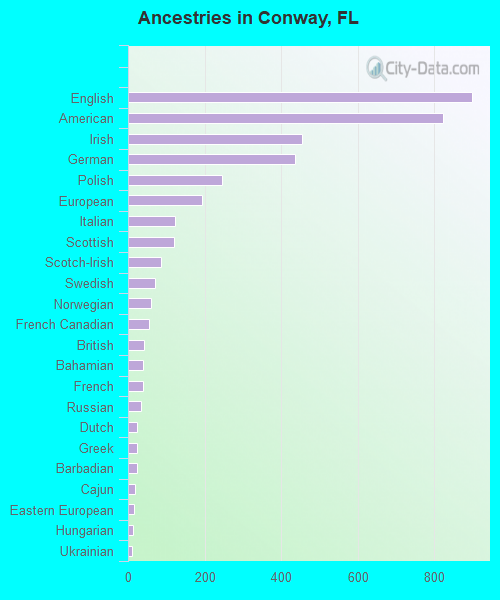
Ancestries in Conway
898 13.9% English824 12.8% American455 7.1% Irish436 6.8% German245 3.8% Polish192 3.0% European124 1.9% Italian119 1.8% Scottish85 1.3% Scotch-Irish71 1.1% Swedish61 0.9% Norwegian54 0.8% French Canadian41 0.6% British40 0.6% Bahamian38 0.6% French35 0.5% Russian24 0.4% Dutch23 0.4% Greek23 0.4% Barbadian17 0.3% Cajun16 0.2% Eastern European13 0.2% Hungarian11 0.2% Ukrainian8 0.1% Czech8 0.1% Portuguese2 0.03% Canadian1 0.02% Israeli
Children Nativity (place of birth) in Conway
Children under 6 years - Living with two parents Both parents native 431 100.0% NativeBoth parents foreign-born 149 100.0% NativeOne native, one foreign-born parent 49 100.0% NativeChildren under 6 years - Living with one parent Native parent 126 98.8% Native2 1.2% Foreign-bornForeign-born parent 54 52.6% Native48 47.4% Foreign-bornChildren 6 to 17 years - Living with two parents Both parents native 942 100.0% NativeBoth parents foreign-born 78 85.8% Native13 14.2% Foreign-bornOne native, one foreign-born parent 54 65.0% Native29 35.0% Foreign-bornChildren 6 to 17 years - Living with one parent Native parent 295 100.0% NativeForeign-born parent 98 49.1% Native102 50.9% Foreign-born
Grandparents responsible for own grandchildren in Conway
Grandparents (30 to 59 years) White / Caucasian 11 33.8% Responsible for grandchildren23 66.2% Not responsible for grandchildrenWhite alone, not Hispanic / Latino 13 29.4% Responsible for grandchildren32 70.6% Not responsible for grandchildren
Grandparents (60 years and over) White / Caucasian 34 100.0% Not responsible for grandchildrenWhite alone, not Hispanic / Latino 47 100.0% Not responsible for grandchildren