Races in Coon Rapids, Minnesota (MN) Detailed Stats
Data:
Races - White alone (%)
Races - White alone (% change since 2000)
Races - Black alone (%)
Races - Black alone (% change since 2000)
Races - American Indian alone (%)
Races - American Indian alone (% change since 2000)
Races - Asian alone (%)
Races - Asian alone (% change since 2000)
Races - Hispanic (%)
Races - Hispanic (% change since 2000)
Races - Native Hawaiian and Other Pacific Islander alone (%)
Races - Native Hawaiian and Other Pacific Islander alone (% change since 2000)
Races - Two or more races(%)
Races - Two or more races(% change since 2000)
Races - Other race alone (%)
Races - Other race alone (% change since 2000)
Racial diversity
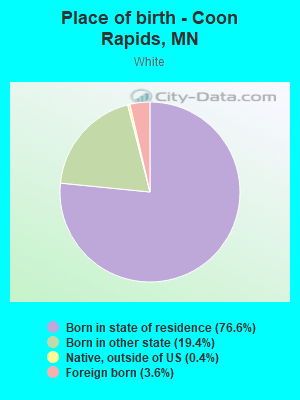
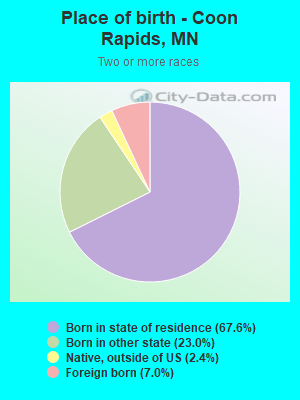
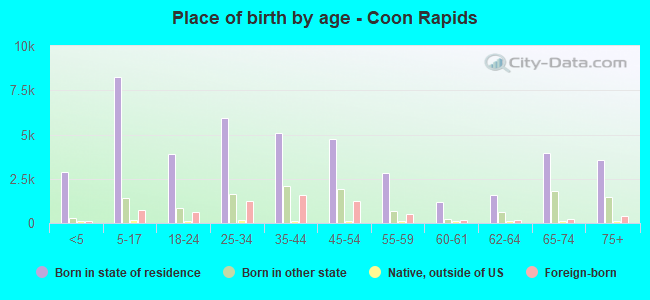
Place of birth - Born in state of residence (%)
Place of birth - Born in state of residence (%) - White
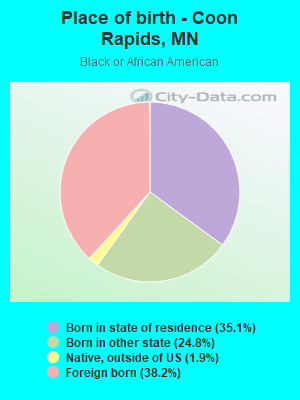
Place of birth - Born in state of residence (%) - Black or African American
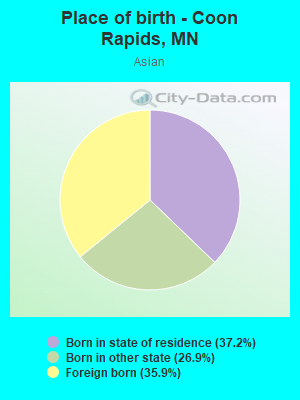
Place of birth - Born in state of residence (%) - Asian
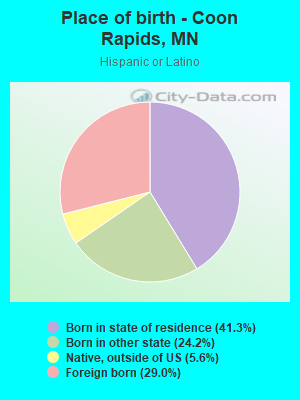
Place of birth - Born in state of residence (%) - Hispanic or Latino
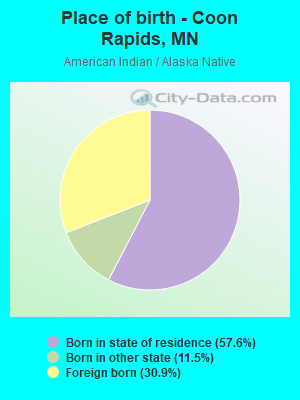
Place of birth - Born in state of residence (%) - American Indian and Alaska Native
Place of birth - Born in state of residence (%) - Multirace
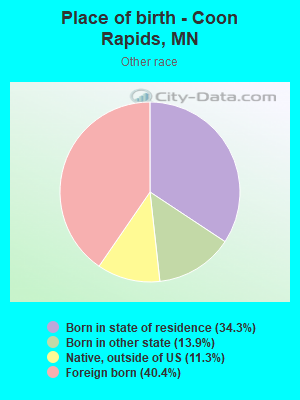
Place of birth - Born in state of residence (%) - Other Race
Place of birth - Born in other state (%)
Place of birth - Born in other state (%) - White
Place of birth - Born in other state (%) - Black or African American
Place of birth - Born in other state (%) - Asian
Place of birth - Born in other state (%) - Hispanic or Latino
Place of birth - Born in other state (%) - American Indian and Alaska Native
Place of birth - Born in other state (%) - Multirace
Place of birth - Born in other state (%) - Other Race
Place of birth - Native, outside of US (%)
Place of birth - Native, outside of US (%) - White
Place of birth - Native, outside of US (%) - Black or African American
Place of birth - Native, outside of US (%) - Asian
Place of birth - Native, outside of US (%) - Hispanic or Latino
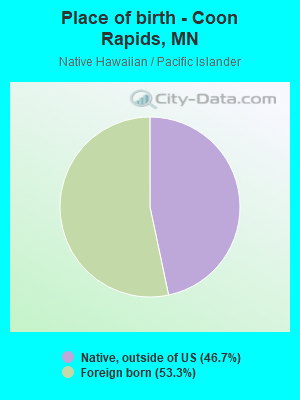
Place of birth - Native, outside of US (%) - American Indian and Alaska Native
Place of birth - Native, outside of US (%) - Multirace
Place of birth - Native, outside of US (%) - Other Race
Place of birth - Foreign born (%)
Place of birth - Foreign born (%) - White
Place of birth - Foreign born (%) - Black or African American
Place of birth - Foreign born (%) - Asian
Place of birth - Foreign born (%) - Hispanic or Latino
Place of birth - Foreign born (%) - American Indian and Alaska Native
Place of birth - Foreign born (%) - Multirace
Place of birth - Foreign born (%) - Other Race
Residents speaking English at home (%)
Residents speaking English at home - Born in the United States (%)
Residents speaking English at home - Native, born elsewhere (%)
Residents speaking English at home - Foreign born (%)
Residents speaking Spanish at home (%)
Residents speaking Spanish at home - Born in the United States (%)
Residents speaking Spanish at home - Native, born elsewhere (%)
Residents speaking Spanish at home - Foreign born (%)
Residents speaking other language at home (%)
Residents speaking other language at home - Born in the United States (%)
Residents speaking other language at home - Native, born elsewhere (%)
Residents speaking other language at home - Foreign born (%)
Marital status - Never married (%)
Marital status - Now married (%)
Marital status - Separated (%)
Marital status - Widowed (%)
Marital status - Divorced (%)
Ancestries Reported - Arab (%)
Ancestries Reported - Czech (%)
Ancestries Reported - Danish (%)
Ancestries Reported - Dutch (%)
Ancestries Reported - English (%)
Ancestries Reported - French (%)
Ancestries Reported - French Canadian (%)
Ancestries Reported - German (%)
Ancestries Reported - Greek (%)
Ancestries Reported - Hungarian (%)
Ancestries Reported - Irish (%)
Ancestries Reported - Italian (%)
Ancestries Reported - Lithuanian (%)
Ancestries Reported - Norwegian (%)
Ancestries Reported - Polish (%)
Ancestries Reported - Portuguese (%)
Ancestries Reported - Russian (%)
Ancestries Reported - Scotch-Irish (%)
Ancestries Reported - Scottish (%)
Ancestries Reported - Slovak (%)
Ancestries Reported - Subsaharan African (%)
Ancestries Reported - Swedish (%)
Ancestries Reported - Swiss (%)
Ancestries Reported - Ukrainian (%)
Ancestries Reported - United States (%)
Ancestries Reported - Welsh (%)
Ancestries Reported - West Indian (%)
Ancestries Reported - Other (%)
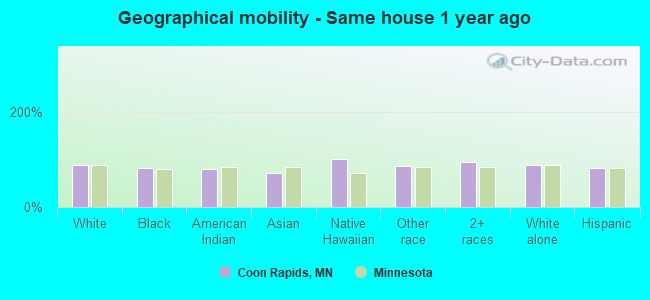
Geographical mobility - Same house 1 year ago (%)
Geographical mobility - Same house 1 year ago (%) - White
Geographical mobility - Same house 1 year ago (%) - Black or African American
Geographical mobility - Same house 1 year ago (%) - Asian
Geographical mobility - Same house 1 year ago (%) - Hispanic or Latino
Geographical mobility - Same house 1 year ago (%) - American Indian and Alaska Native
Geographical mobility - Same house 1 year ago (%) - Multirace
Geographical mobility - Same house 1 year ago (%) - Other Race
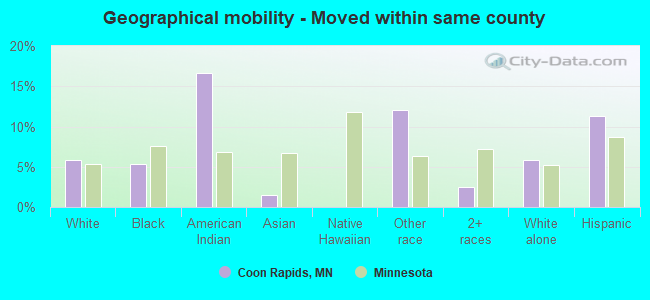
Geographical mobility - Moved within same county (%)
Geographical mobility - Moved within same county (%) - White
Geographical mobility - Moved within same county (%) - Black or African American
Geographical mobility - Moved within same county (%) - Asian
Geographical mobility - Moved within same county (%) - Hispanic or Latino
Geographical mobility - Moved within same county (%) - American Indian and Alaska Native
Geographical mobility - Moved within same county (%) - Multirace
Geographical mobility - Moved within same county (%) - Other Race
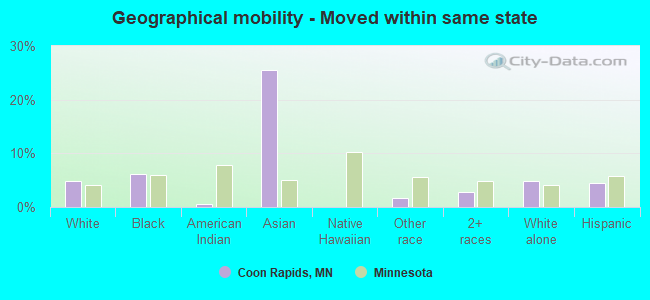
Geographical mobility - Moved from different county within same state (%)
Geographical mobility - Moved from different county within same state (%) - White
Geographical mobility - Moved from different county within same state (%) - Black or African American
Geographical mobility - Moved from different county within same state (%) - Asian
Geographical mobility - Moved from different county within same state (%) - Hispanic or Latino
Geographical mobility - Moved from different county within same state (%) - American Indian and Alaska Native
Geographical mobility - Moved from different county within same state (%) - Multirace
Geographical mobility - Moved from different county within same state (%) - Other Race
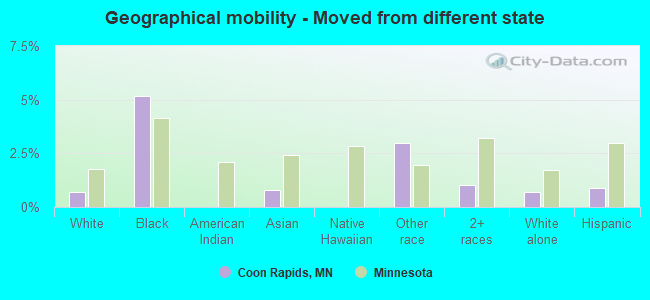
Geographical mobility - Moved from different state (%)
Geographical mobility - Moved from different state (%) - White
Geographical mobility - Moved from different state (%) - Black or African American
Geographical mobility - Moved from different state (%) - Asian
Geographical mobility - Moved from different state (%) - Hispanic or Latino
Geographical mobility - Moved from different state (%) - American Indian and Alaska Native
Geographical mobility - Moved from different state (%) - Multirace
Geographical mobility - Moved from different state (%) - Other Race
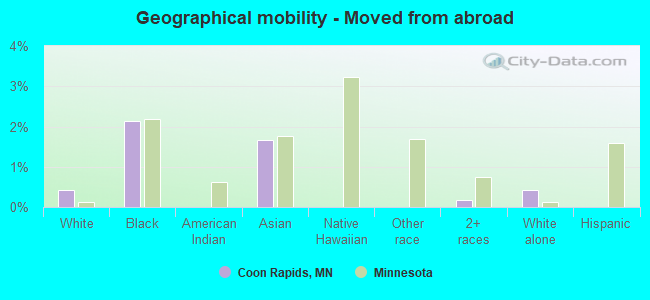
Geographical mobility - Moved from abroad (%)
Geographical mobility - Moved from abroad (%) - White
Geographical mobility - Moved from abroad (%) - Black or African American
Geographical mobility - Moved from abroad (%) - Asian
Geographical mobility - Moved from abroad (%) - Hispanic or Latino
Geographical mobility - Moved from abroad (%) - American Indian and Alaska Native
Geographical mobility - Moved from abroad (%) - Multirace
Geographical mobility - Moved from abroad (%) - Other Race
Place of birth for the foreign-born population - Ireland (%)
Place of birth for the foreign-born population - Denmark (%)
Place of birth for the foreign-born population - Norway (%)
Place of birth for the foreign-born population - Sweden (%)
Place of birth for the foreign-born population - United Kingdom (%)
Place of birth for the foreign-born population - England (%)
Place of birth for the foreign-born population - Scotland (%)
Place of birth for the foreign-born population - Other Northern Europe (%)
Place of birth for the foreign-born population - Austria (%)
Place of birth for the foreign-born population - Belgium (%)
Place of birth for the foreign-born population - France (%)
Place of birth for the foreign-born population - Germany (%)
Place of birth for the foreign-born population - Netherlands (%)
Place of birth for the foreign-born population - Switzerland (%)
Place of birth for the foreign-born population - Other Western Europe (%)
Place of birth for the foreign-born population - Greece (%)
Place of birth for the foreign-born population - Italy (%)
Place of birth for the foreign-born population - Portugal (%)
Place of birth for the foreign-born population - Spain (%)
Place of birth for the foreign-born population - Other Southern Europe (%)
Place of birth for the foreign-born population - Albania (%)
Place of birth for the foreign-born population - Belarus (%)
Place of birth for the foreign-born population - Bosnia and Herzegovina (%)
Place of birth for the foreign-born population - Bulgaria (%)
Place of birth for the foreign-born population - Croatia (%)
Place of birth for the foreign-born population - Czechoslovakia (%)
Place of birth for the foreign-born population - Hungary (%)
Place of birth for the foreign-born population - Latvia (%)
Place of birth for the foreign-born population - Lithuania (%)
Place of birth for the foreign-born population - North Macedonia (Macedonia) (%)
Place of birth for the foreign-born population - Moldova (%)
Place of birth for the foreign-born population - Poland (%)
Place of birth for the foreign-born population - Romania (%)
Place of birth for the foreign-born population - Russia (%)
Place of birth for the foreign-born population - Serbia (%)
Place of birth for the foreign-born population - Ukraine (%)
Place of birth for the foreign-born population - Other Eastern Europe (%)
Place of birth for the foreign-born population - China (%)
Place of birth for the foreign-born population - Hong Kong (%)
Place of birth for the foreign-born population - Taiwan (%)
Place of birth for the foreign-born population - Japan (%)
Place of birth for the foreign-born population - Korea (%)
Place of birth for the foreign-born population - Other Eastern Asia (%)
Place of birth for the foreign-born population - Afghanistan (%)
Place of birth for the foreign-born population - Bangladesh (%)
Place of birth for the foreign-born population - India (%)
Place of birth for the foreign-born population - Iran (%)
Place of birth for the foreign-born population - Kazakhstan (%)
Place of birth for the foreign-born population - Nepal (%)
Place of birth for the foreign-born population - Pakistan (%)
Place of birth for the foreign-born population - Sri Lanka (%)
Place of birth for the foreign-born population - Uzbekistan (%)
Place of birth for the foreign-born population - Other South Central Asia (%)
Place of birth for the foreign-born population - Burma (%)
Place of birth for the foreign-born population - Cambodia (%)
Place of birth for the foreign-born population - Indonesia (%)
Place of birth for the foreign-born population - Laos (%)
Place of birth for the foreign-born population - Malaysia (%)
Place of birth for the foreign-born population - Philippines (%)
Place of birth for the foreign-born population - Singapore (%)
Place of birth for the foreign-born population - Thailand (%)
Place of birth for the foreign-born population - Vietnam (%)
Place of birth for the foreign-born population - Other South Eastern Asia (%)
Place of birth for the foreign-born population - Armenia (%)
Place of birth for the foreign-born population - Iraq (%)
Place of birth for the foreign-born population - Israel (%)
Place of birth for the foreign-born population - Jordan (%)
Place of birth for the foreign-born population - Kuwait (%)
Place of birth for the foreign-born population - Lebanon (%)
Place of birth for the foreign-born population - Saudi Arabia (%)
Place of birth for the foreign-born population - Syria (%)
Place of birth for the foreign-born population - Turkey (%)
Place of birth for the foreign-born population - Yemen (%)
Place of birth for the foreign-born population - Other Western Asia (%)
Place of birth for the foreign-born population - Eritrea (%)
Place of birth for the foreign-born population - Ethiopia (%)
Place of birth for the foreign-born population - Kenya (%)
Place of birth for the foreign-born population - Somalia (%)
Place of birth for the foreign-born population - Uganda (%)
Place of birth for the foreign-born population - Zimbabwe (%)
Place of birth for the foreign-born population - Other Eastern Africa (%)
Place of birth for the foreign-born population - Cameroon (%)
Place of birth for the foreign-born population - Congo (%)
Place of birth for the foreign-born population - Democratic Republic of Congo (Zaire) (%)
Place of birth for the foreign-born population - Other Middle Africa (%)
Place of birth for the foreign-born population - Egypt (%)
Place of birth for the foreign-born population - Morocco (%)
Place of birth for the foreign-born population - Sudan (%)
Place of birth for the foreign-born population - Other Northern Africa (%)
Place of birth for the foreign-born population - South Africa (%)
Place of birth for the foreign-born population - Other Southern Africa (%)
Place of birth for the foreign-born population - Cabo Verde (%)
Place of birth for the foreign-born population - Ghana (%)
Place of birth for the foreign-born population - Liberia (%)
Place of birth for the foreign-born population - Nigeria (%)
Place of birth for the foreign-born population - Senegal (%)
Place of birth for the foreign-born population - Sierra Leone (%)
Place of birth for the foreign-born population - Other Western Africa (%)
Place of birth for the foreign-born population - Australia (%)
Place of birth for the foreign-born population - New Zealand (%)
Place of birth for the foreign-born population - Fiji (%)
Place of birth for the foreign-born population - Micronesia (%)
Place of birth for the foreign-born population - Bahamas (%)
Place of birth for the foreign-born population - Barbados (%)
Place of birth for the foreign-born population - Cuba (%)
Place of birth for the foreign-born population - Dominica (%)
Place of birth for the foreign-born population - Dominican Republic (%)
Place of birth for the foreign-born population - Grenada (%)
Place of birth for the foreign-born population - Haiti (%)
Place of birth for the foreign-born population - Jamaica (%)
Place of birth for the foreign-born population - St. Vincent and the Grenadines (%)
Place of birth for the foreign-born population - Trinidad and Tobago (%)
Place of birth for the foreign-born population - West Indies (%)
Place of birth for the foreign-born population - Other Caribbean (%)
Place of birth for the foreign-born population - Belize (%)
Place of birth for the foreign-born population - Costa Rica (%)
Place of birth for the foreign-born population - El Salvador (%)
Place of birth for the foreign-born population - Guatemala (%)
Place of birth for the foreign-born population - Honduras (%)
Place of birth for the foreign-born population - Mexico (%)
Place of birth for the foreign-born population - Nicaragua (%)
Place of birth for the foreign-born population - Panama (%)
Place of birth for the foreign-born population - Other Central America (%)
Place of birth for the foreign-born population - Argentina (%)
Place of birth for the foreign-born population - Bolivia (%)
Place of birth for the foreign-born population - Brazil (%)
Place of birth for the foreign-born population - Chile (%)
Place of birth for the foreign-born population - Colombia (%)
Place of birth for the foreign-born population - Ecuador (%)
Place of birth for the foreign-born population - Guyana (%)
Place of birth for the foreign-born population - Peru (%)
Place of birth for the foreign-born population - Uruguay (%)
Place of birth for the foreign-born population - Venezuela (%)
Place of birth for the foreign-born population - Other South America (%)
Place of birth for the foreign-born population - Canada (%)
Place of birth for the foreign-born population - Other Northern America (%)
Place of birth for the foreign-born population - Other (%)
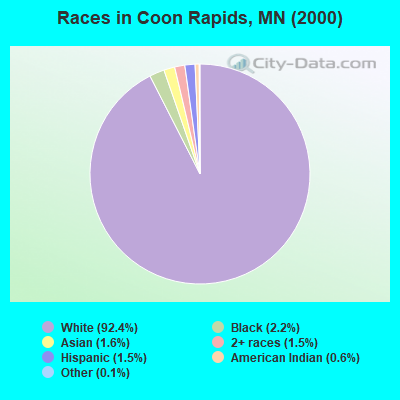
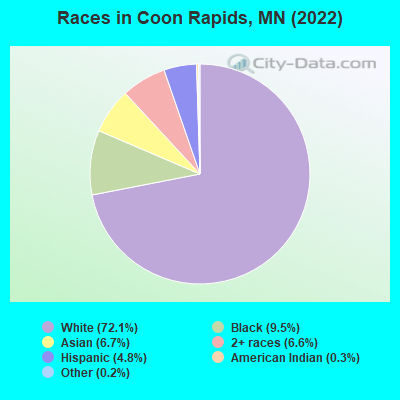
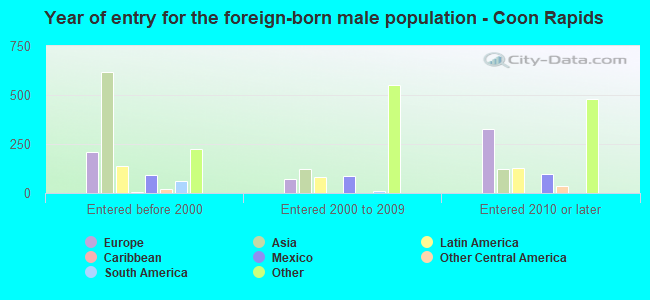
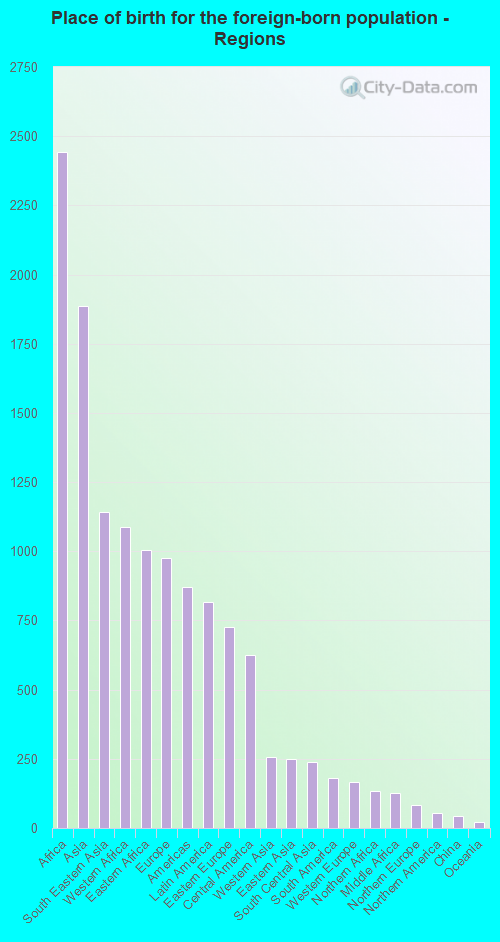
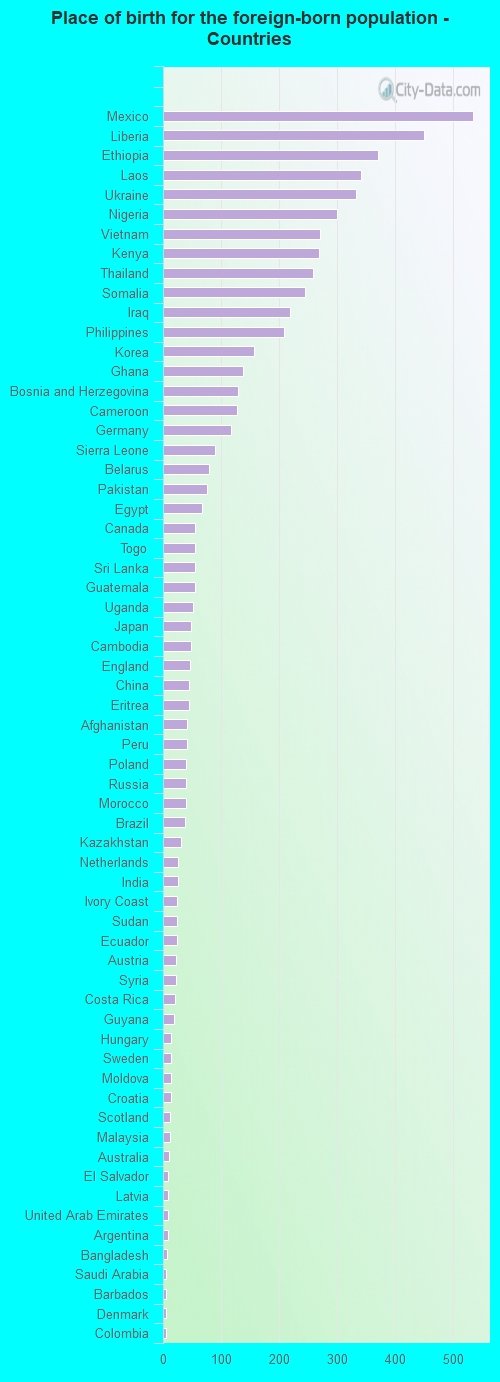
According to 2022 data, the most numerous races in Coon Rapids, MN are White alone (46,244 residents), Black alone (6,113 residents), and Hispanic (3,085 residents). 85.9% of Coon Rapids residents speak English at home. 9.7% of Coon Rapids, MN residents are foreign-born (3.7% born in Africa, 2.9% born in Asia, 1.5% born in Europe, 1.2% born in Latin America), which is 17.3% greater than the foreign-born rate of 8.0% across the entire state of Minnesota.
Race distribution in Coon Rapids
2000 2022
4,337,143 88.2% White alone 168,813 3.4% Black alone 143,382 2.9% Hispanic 141,083 2.9% Asian alone 70,304 1.4% Two or more races 52,009 1.1% American Indian alone 5,031 0.1% Other race alone 1,714 0.03% Native Hawaiian and Other
4,356,347 76.2% White alone 395,179 6.9% Black alone 333,830 5.8% Hispanic 294,800 5.2% Asian alone 259,649 4.5% Two or more races 42,125 0.7% American Indian alone 32,976 0.6% Other race alone 2,278 0.04% Native Hawaiian and Other
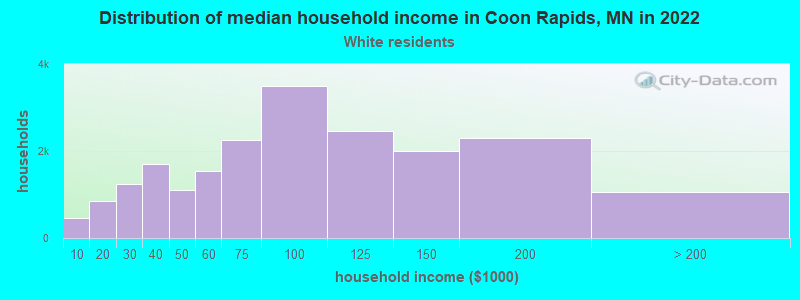
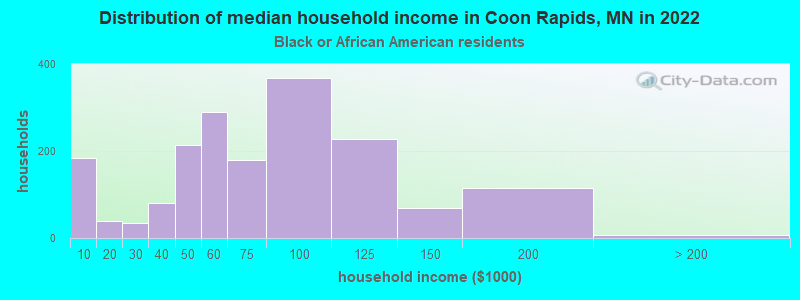
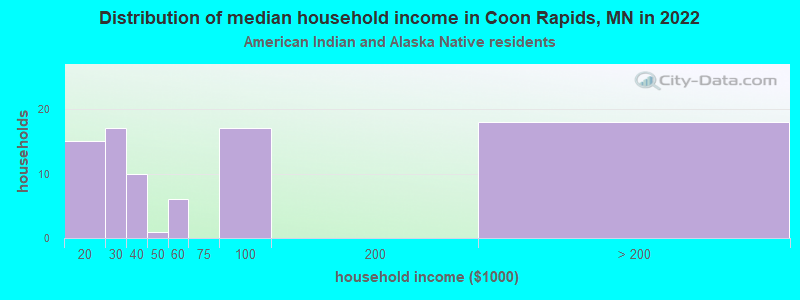
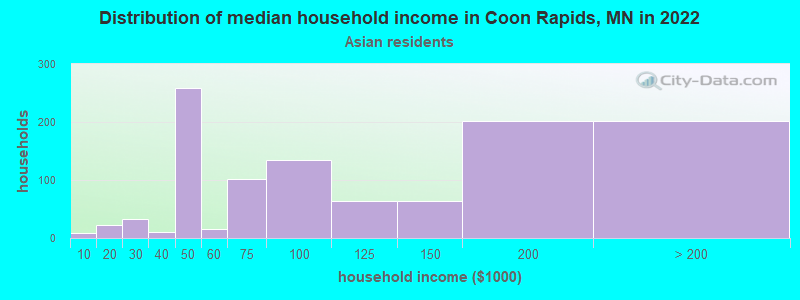
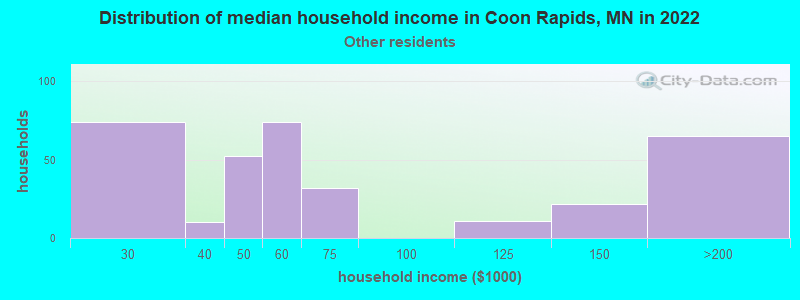
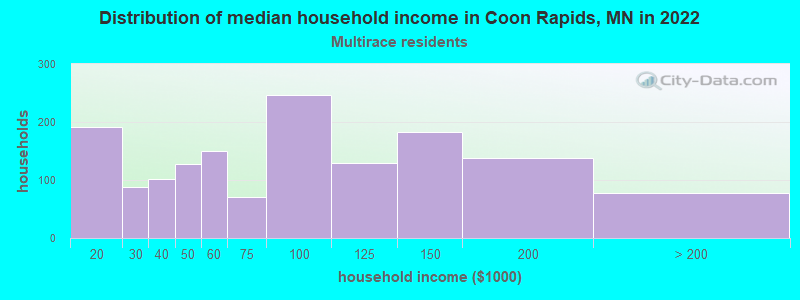
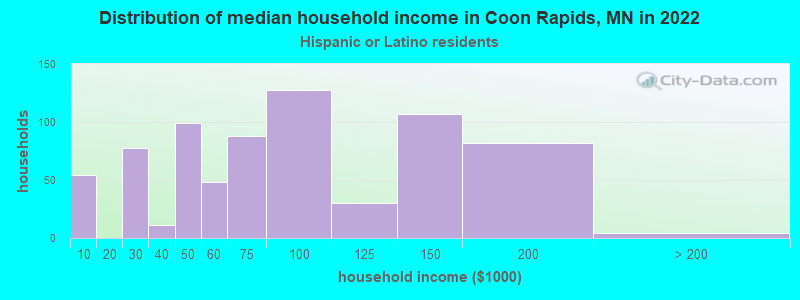
Income and house value in Coon Rapids Median household income in 2022 $84,601 White non-Hispanic householders$67,113 Black householders$107,009 Asian householders$61,081 Some other race householders$79,302 Two or more races householders$76,658 Hispanic or Latino race householdersMedian 2022 house value $301,031 White Non-Hispanic householders$336,632 Black or African American householders$283,352 American Indian or Alaska Native householders $284,078 Asian householders$191,323 Some other race householders$343,413 Two or more races householders$322,343 Hispanic or Latino householders
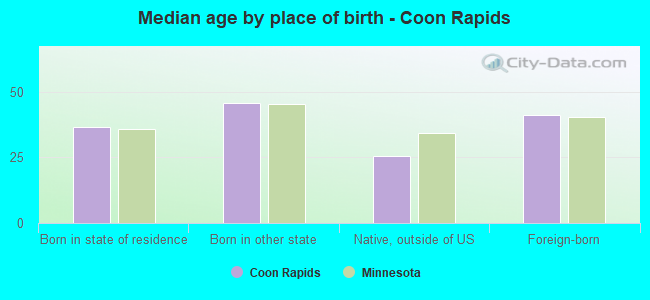
Median age by race in Coon Rapids
45.1 Median age for White residents42.6 46.2 22.0 Median age for Black or African American residents21.4 23.4 41.1 Median age for American Indian / Alaska Native residents34.5 48.3 33.2 Median age for Asian residents34.2 33.0 34.5 Median age for Native Hawaiian / Pacific Islander residents-670,553,935.2 -534,959,349.1 31.7 Median age for Other race residents28.0 34.9 29.0 Median age for Two or more races residents28.4 29.6 45.0 Median age for White alone residents42.9 46.4 28.3 Median age for Hispanic or Latino residents29.2 27.1
Owner/renter occupied households by race in Coon Rapids
House owners and renters - White residents 15,730 77.5% Owner occupied4,568 22.5% Renter occupiedHouse owners and renters - Black or African American residents 771 45.9% Owner occupied909 54.1% Renter occupiedHouse owners and renters - American Indian / Alaska Native residents 21 29.4% Owner occupied50 70.6% Renter occupiedHouse owners and renters - Asian residents 1,046 81.8% Owner occupied232 18.2% Renter occupiedHouse owners and renters - Native Hawaiian / Pacific Islander residents 25 100.0% Owner occupiedHouse owners and renters - Other race residents 244 52.7% Owner occupied220 47.3% Renter occupiedHouse owners and renters - Two or more races residents 1,057 67.4% Owner occupied510 32.6% Renter occupiedHouse owners and renters - White alone residents 15,718 77.6% Owner occupied4,525 22.4% Renter occupiedHouse owners and renters - Hispanic or Latino residents 453 63.4% Owner occupied262 36.6% Renter occupied
Language usage in Coon Rapids
English speakers - Total 85.9% of residents of Coon Rapids speak English at home.
2.6% of residents speak Spanish at home 921 58.0% Speak English very well667 42.0% Speak English less than very well11.2% of residents speak other language at home 4,543 66.3% Speak English very well2,305 33.7% Speak English less than very well
English speakers - Born in the United States 90.6% of residents of Coon Rapids speak English at home.
3.1% of residents speak Spanish at home 325 84.0% Speak English very well62 16.0% Speak English less than very well5.4% of residents speak other language at home 636 92.6% Speak English very well51 7.4% Speak English less than very well
English speakers - Native, born elsewhere 64.3% of residents of Coon Rapids speak English at home.
14.8% of residents speak Spanish at home 62 79.5% Speak English very well16 20.5% Speak English less than very well19.4% of residents speak other language at home 102 100.0% Speak English very well
English speakers - Foreign-born 23.8% of residents of Coon Rapids speak English at home.
9.2% of residents speak Spanish at home 205 32.3% Speak English very well430 67.7% Speak English less than very well66.7% of residents speak other language at home 2,520 55.0% Speak English very well2,063 45.0% Speak English less than very well
White (Caucasian) - Speak only English Native:
97.9% (42,072)Foreign-born:
19.6% (324)
White (Caucasian) - Speak another language Native:
2.0% (871)Foreign-born:
80.3% (1,331)
Black or African American - Speak only English Native:
86.9% (2,787)Foreign-born:
34.3% (802)
Black or African American - Speak another language Native:
9.6% (309)Foreign-born:
65.8% (1,537)
American Indian / Alaska Native - Speak only English Native:
100.0% (249)Foreign-born:
62.1% (76)
Asian - Speak only English Native:
51.8% (1,381)Foreign-born:
11.3% (181)
Asian - Speak another language Native:
43.8% (1,166)Foreign-born:
89.3% (1,437)
Other race - Speak only English Native:
52.2% (429)Foreign-born:
13.6% (84)
Other race - Speak another language Native:
49.7% (409)Foreign-born:
75.4% (466)
Two or more races - Speak only English Native:
91.6% (4,305)Foreign-born:
9.4% (35)
Two or more races - Speak another language Native:
7.8% (369)Foreign-born:
93.2% (344)
White alone - Speak only English Native:
98.0% (41,747)Foreign-born:
18.9% (333)
White alone - Speak another language Native:
1.9% (806)Foreign-born:
81.3% (1,437)
Hispanic or Latino - Speak only English Native:
53.9% (1,020)Foreign-born:
29.3% (256)
Hispanic or Latino - Speak another language Native:
40.8% (772)Foreign-born:
73.1% (639)
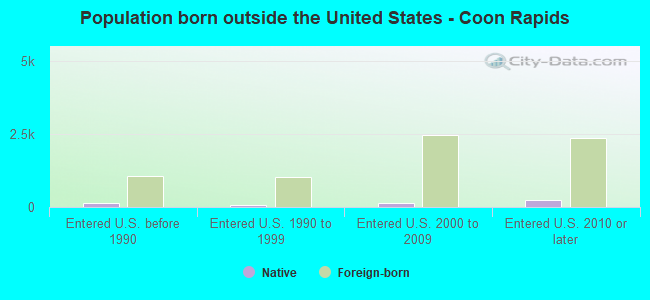
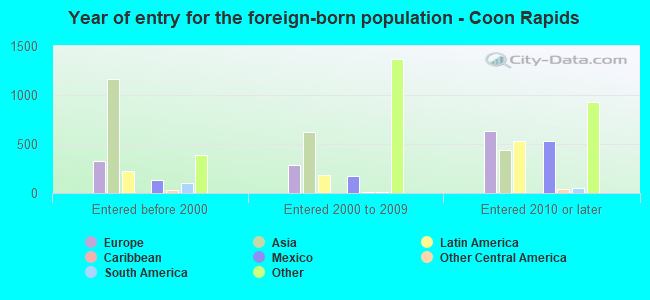
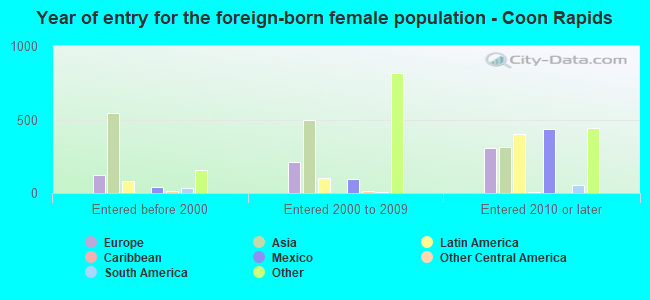
Foreign-born residents in Coon Rapids 6,203 residents are foreign born (3.7% Africa , 2.9% Asia , 1.5% Europe , 1.2% Latin America ).
This city:
9.7%Minnesota:
8.5%
Marital status for residents in Coon Rapids Marital status - White (Caucasian) population 15 years and over
Males 35.0% Never married49.2% Now married0.8% Separated3.9% Widowed11.1% DivorcedFemales 27.8% Never married47.3% Now married1.5% Separated10.7% Widowed12.7% DivorcedWomen who gave birth in the past 12 months Now married:
56.0% (337)Unmarried:
44.0% (265)
Women who did not give birth in the past 12 months Now married:
42.5% (3,991)Unmarried:
57.5% (5,389)
Marital status - Black or African American population 15 years and over
Males 48.6% Never married39.4% Now married2.3% Separated0.6% Widowed9.0% DivorcedFemales 42.1% Never married34.2% Now married5.1% Separated5.9% Widowed12.7% DivorcedWomen who gave birth in the past 12 months Now married:
21.5% (28)Unmarried:
78.5% (101)
Women who did not give birth in the past 12 months Now married:
41.0% (649)Unmarried:
59.0% (933)
Marital status - American Indian / Alaska Native population 15 years and over
Males 44.3% Never married48.4% Now married0.0% Separated0.0% Widowed7.4% DivorcedFemales 45.9% Never married37.1% Now married8.2% Separated0.6% Widowed8.2% DivorcedWomen who did not give birth in the past 12 months Now married:
36.0% (43)Unmarried:
64.0% (76)
Marital status - Asian population 15 years and over
Males 55.5% Never married36.5% Now married2.0% Separated0.0% Widowed6.1% DivorcedFemales 45.4% Never married40.5% Now married2.2% Separated3.6% Widowed8.4% DivorcedWomen who gave birth in the past 12 months Now married:
26.8% (13)Unmarried:
73.2% (37)
Women who did not give birth in the past 12 months Now married:
39.2% (556)Unmarried:
60.8% (862)
Marital status - Native Hawaiian / Pacific Islander population 15 years and over
Males 21.1% Never married0.0% Now married78.9% Separated0.0% Widowed0.0% DivorcedFemales 62.5% Never married37.5% Now married0.0% Separated0.0% Widowed0.0% DivorcedWomen who did not give birth in the past 12 months Now married:
37.5% (4)Unmarried:
62.5% (7)
Marital status - Other race population 15 years and over
Males 43.1% Never married41.9% Now married6.9% Separated0.0% Widowed8.1% DivorcedFemales 10.1% Never married74.6% Now married3.9% Separated0.0% Widowed11.4% DivorcedWomen who gave birth in the past 12 months Now married:
100.0% (43)Unmarried:
0.0% (0)
Women who did not give birth in the past 12 months Now married:
77.8% (219)Unmarried:
22.2% (62)
Marital status - Two or more races population 15 years and over
Males 66.6% Never married28.4% Now married0.0% Separated1.3% Widowed3.6% DivorcedFemales 44.7% Never married20.9% Now married11.2% Separated12.3% Widowed10.9% DivorcedWomen who gave birth in the past 12 months Now married:
60.5% (38)Unmarried:
39.5% (25)
Women who did not give birth in the past 12 months Now married:
34.5% (494)Unmarried:
65.5% (937)
Marital status - White alone, not Hispanic / Latino population 15 years and over
Males 34.7% Never married49.4% Now married0.8% Separated3.9% Widowed11.2% DivorcedFemales 26.9% Never married47.9% Now married1.5% Separated10.9% Widowed12.8% DivorcedWomen who gave birth in the past 12 months Now married:
61.8% (336)Unmarried:
38.2% (208)
Women who did not give birth in the past 12 months Now married:
43.5% (4,014)Unmarried:
56.5% (5,216)
Marital status - Hispanic or Latino population 15 years and over
Males 61.3% Never married31.6% Now married2.5% Separated0.0% Widowed4.6% DivorcedFemales 49.8% Never married28.5% Now married1.1% Separated12.6% Widowed8.1% DivorcedWomen who gave birth in the past 12 months Now married:
32.7% (35)Unmarried:
67.3% (73)
Women who did not give birth in the past 12 months Now married:
28.5% (210)Unmarried:
71.5% (526)
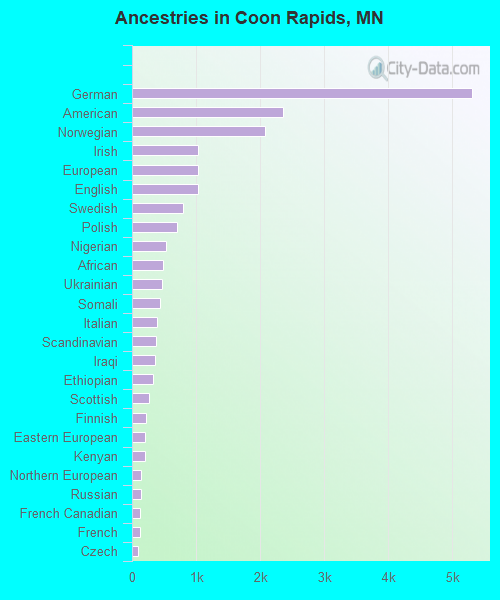
Ancestries in Coon Rapids
5,310 18.6% German2,363 8.3% American2,075 7.3% Norwegian1,037 3.6% Irish1,030 3.6% European1,029 3.6% English795 2.8% Swedish695 2.4% Polish533 1.9% Nigerian486 1.7% African474 1.7% Ukrainian443 1.6% Somali384 1.3% Italian369 1.3% Scandinavian367 1.3% Iraqi325 1.1% Ethiopian273 1.0% Scottish216 0.8% Finnish209 0.7% Eastern European197 0.7% Kenyan138 0.5% Northern European133 0.5% Russian125 0.4% French Canadian125 0.4% French87 0.3% Czech87 0.3% Danish80 0.3% Dutch77 0.3% Scotch-Irish64 0.2% Hungarian62 0.2% Afghan55 0.2% Liberian53 0.2% Brazilian47 0.2% Egyptian38 0.1% Yugoslavian37 0.1% Czechoslovakian35 0.1% Ghanaian25 0.09% Croatian24 0.08% Swiss23 0.08% Palestinian21 0.07% Portuguese20 0.07% Arab17 0.06% Guyanese17 0.06% British17 0.06% Welsh16 0.06% Lithuanian16 0.06% Slovak15 0.05% Moroccan15 0.05% Greek11 0.04% Belgian10 0.04% Austrian8 0.03% Albanian7 0.02% Latvian7 0.02% Icelander6 0.02% German Russian6 0.02% Canadian5 0.02% Slovene
Geographical mobility in Coon Rapids Same house 1 year ago 40,778 88.4% White (Caucasian)4,923 82.1% Black or African American292 79.4% American Indian / Alaska Native2,619 70.7% Asian29 100.0% Native Hawaiian / Pacific Islander1,212 85.0% Other race5,016 94.0% Two or more races40,499 88.4% White alone, not Hispanic / Latino2,434 81.4% Hispanic or LatinoMoved within same county 2,711 5.9% White / Caucasian318 5.3% Black or African American61 16.6% American Indian / Alaska Native57 1.5% Asian171 12.0% Other race130 2.4% Two or more races2,654 5.8% White alone, not Hispanic / Latino338 11.3% Hispanic or LatinoMoved within same state 2,217 4.8% White / Caucasian370 6.2% Black or African American2 0.6% American Indian / Alaska Native942 25.5% Asian25 1.8% Other race154 2.9% Two or more races2,216 4.8% White alone, not Hispanic / Latino135 4.5% Hispanic or LatinoMoved from different state 321 0.7% White / Caucasian309 5.2% Black or African American30 0.8% Asian42 3.0% Other race54 1.0% Two or more races328 0.7% White alone, not Hispanic / Latino27 0.9% Hispanic or LatinoMoved from abroad 197 0.4% White128 2.1% Black or African American61 1.7% Asian9 0.2% Two or more races197 0.4% White alone, not Hispanic / Latino
Children Nativity (place of birth) in Coon Rapids
Children under 6 years - Living with two parents Both parents native 1,722 100.0% NativeBoth parents foreign-born 264 95.9% Native11 4.1% Foreign-bornOne native, one foreign-born parent 181 100.0% NativeChildren under 6 years - Living with one parent Native parent 1,464 100.0% NativeForeign-born parent 311 97.9% Native7 2.1% Foreign-bornChildren 6 to 17 years - Living with two parents Both parents native 3,758 100.0% NativeBoth parents foreign-born 705 58.2% Native506 41.8% Foreign-bornOne native, one foreign-born parent 460 98.3% Native8 1.7% Foreign-bornChildren 6 to 17 years - Living with one parent Native parent 2,550 100.0% NativeForeign-born parent 1,372 56.6% Native1,052 43.4% Foreign-born
Grandparents responsible for own grandchildren in Coon Rapids
Grandparents (30 to 59 years) White / Caucasian 144 33.9% Responsible for grandchildren281 66.1% Not responsible for grandchildrenBlack or African American 59 88.7% Responsible for grandchildren7 11.3% Not responsible for grandchildrenAmerican Indian / Alaska Native 7 100.0% Not responsible for grandchildrenTwo or more races 2 100.0% Not responsible for grandchildrenWhite alone, not Hispanic / Latino 144 38.0% Responsible for grandchildren235 62.0% Not responsible for grandchildrenHispanic or Latino 42 100.0% Not responsible for grandchildrenGrandparents (60 years and over) White / Caucasian 113 36.7% Responsible for grandchildren194 63.3% Not responsible for grandchildrenBlack or African American 49 100.0% Not responsible for grandchildrenWhite alone, not Hispanic / Latino 113 36.7% Responsible for grandchildren194 63.3% Not responsible for grandchildrenHispanic or Latino 22 100.0% Not responsible for grandchildren