Races in Copperas Cove, Texas (TX) Detailed Stats
Data:
Races - White alone (%)
Races - White alone (% change since 2000)
Races - Black alone (%)
Races - Black alone (% change since 2000)
Races - American Indian alone (%)
Races - American Indian alone (% change since 2000)
Races - Asian alone (%)
Races - Asian alone (% change since 2000)
Races - Hispanic (%)
Races - Hispanic (% change since 2000)
Races - Native Hawaiian and Other Pacific Islander alone (%)
Races - Native Hawaiian and Other Pacific Islander alone (% change since 2000)
Races - Two or more races(%)
Races - Two or more races(% change since 2000)
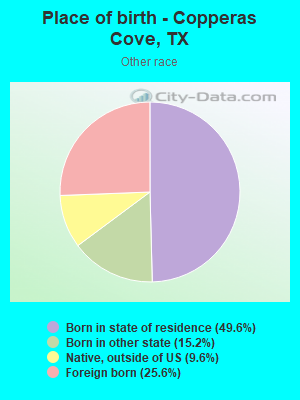
Races - Other race alone (%)
Races - Other race alone (% change since 2000)
Racial diversity
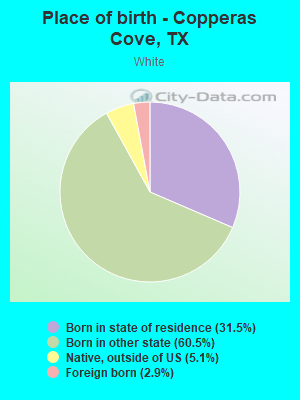
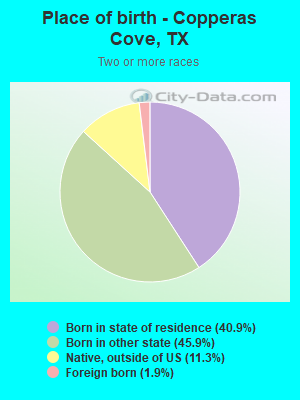
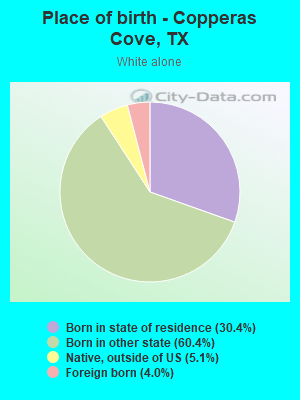
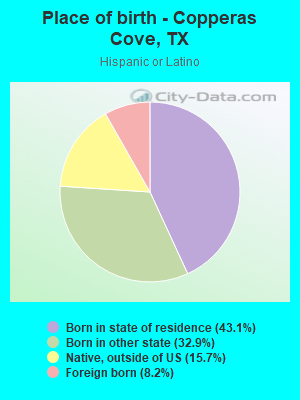
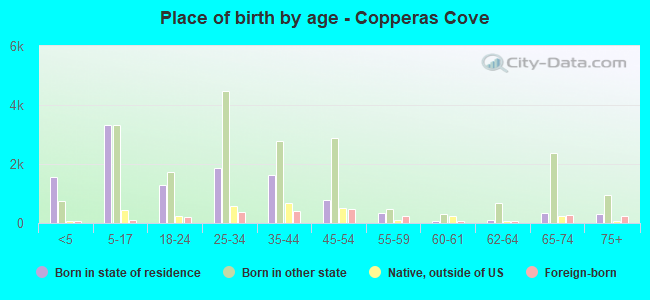
Place of birth - Born in state of residence (%)
Place of birth - Born in state of residence (%) - White
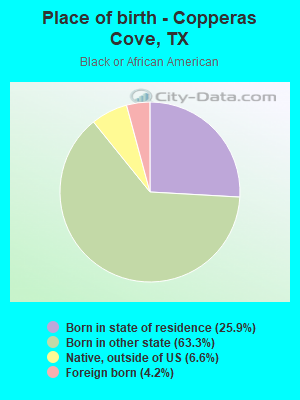
Place of birth - Born in state of residence (%) - Black or African American
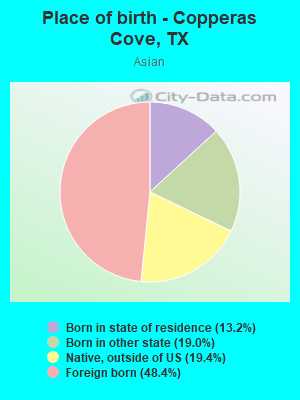
Place of birth - Born in state of residence (%) - Asian
Place of birth - Born in state of residence (%) - Hispanic or Latino
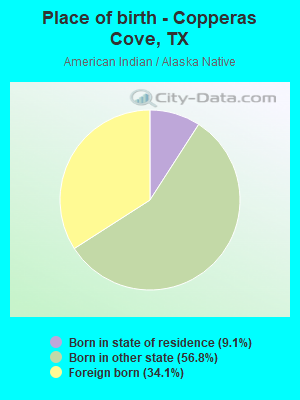
Place of birth - Born in state of residence (%) - American Indian and Alaska Native
Place of birth - Born in state of residence (%) - Multirace
Place of birth - Born in state of residence (%) - Other Race
Place of birth - Born in other state (%)
Place of birth - Born in other state (%) - White
Place of birth - Born in other state (%) - Black or African American
Place of birth - Born in other state (%) - Asian
Place of birth - Born in other state (%) - Hispanic or Latino
Place of birth - Born in other state (%) - American Indian and Alaska Native
Place of birth - Born in other state (%) - Multirace
Place of birth - Born in other state (%) - Other Race
Place of birth - Native, outside of US (%)
Place of birth - Native, outside of US (%) - White
Place of birth - Native, outside of US (%) - Black or African American
Place of birth - Native, outside of US (%) - Asian
Place of birth - Native, outside of US (%) - Hispanic or Latino
Place of birth - Native, outside of US (%) - American Indian and Alaska Native
Place of birth - Native, outside of US (%) - Multirace
Place of birth - Native, outside of US (%) - Other Race
Place of birth - Foreign born (%)
Place of birth - Foreign born (%) - White
Place of birth - Foreign born (%) - Black or African American
Place of birth - Foreign born (%) - Asian
Place of birth - Foreign born (%) - Hispanic or Latino
Place of birth - Foreign born (%) - American Indian and Alaska Native
Place of birth - Foreign born (%) - Multirace
Place of birth - Foreign born (%) - Other Race
Residents speaking English at home (%)
Residents speaking English at home - Born in the United States (%)
Residents speaking English at home - Native, born elsewhere (%)
Residents speaking English at home - Foreign born (%)
Residents speaking Spanish at home (%)
Residents speaking Spanish at home - Born in the United States (%)
Residents speaking Spanish at home - Native, born elsewhere (%)
Residents speaking Spanish at home - Foreign born (%)
Residents speaking other language at home (%)
Residents speaking other language at home - Born in the United States (%)
Residents speaking other language at home - Native, born elsewhere (%)
Residents speaking other language at home - Foreign born (%)
Marital status - Never married (%)
Marital status - Now married (%)
Marital status - Separated (%)
Marital status - Widowed (%)
Marital status - Divorced (%)
Ancestries Reported - Arab (%)
Ancestries Reported - Czech (%)
Ancestries Reported - Danish (%)
Ancestries Reported - Dutch (%)
Ancestries Reported - English (%)
Ancestries Reported - French (%)
Ancestries Reported - French Canadian (%)
Ancestries Reported - German (%)
Ancestries Reported - Greek (%)
Ancestries Reported - Hungarian (%)
Ancestries Reported - Irish (%)
Ancestries Reported - Italian (%)
Ancestries Reported - Lithuanian (%)
Ancestries Reported - Norwegian (%)
Ancestries Reported - Polish (%)
Ancestries Reported - Portuguese (%)
Ancestries Reported - Russian (%)
Ancestries Reported - Scotch-Irish (%)
Ancestries Reported - Scottish (%)
Ancestries Reported - Slovak (%)
Ancestries Reported - Subsaharan African (%)
Ancestries Reported - Swedish (%)
Ancestries Reported - Swiss (%)
Ancestries Reported - Ukrainian (%)
Ancestries Reported - United States (%)
Ancestries Reported - Welsh (%)
Ancestries Reported - West Indian (%)
Ancestries Reported - Other (%)
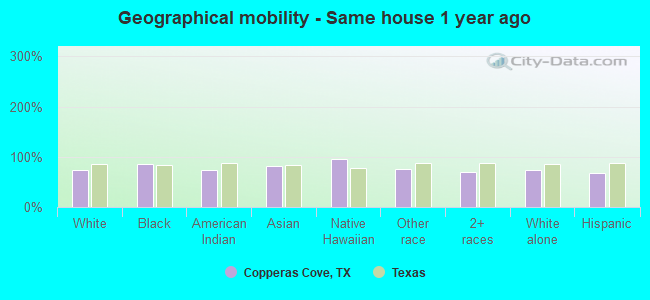
Geographical mobility - Same house 1 year ago (%)
Geographical mobility - Same house 1 year ago (%) - White
Geographical mobility - Same house 1 year ago (%) - Black or African American
Geographical mobility - Same house 1 year ago (%) - Asian
Geographical mobility - Same house 1 year ago (%) - Hispanic or Latino
Geographical mobility - Same house 1 year ago (%) - American Indian and Alaska Native
Geographical mobility - Same house 1 year ago (%) - Multirace
Geographical mobility - Same house 1 year ago (%) - Other Race
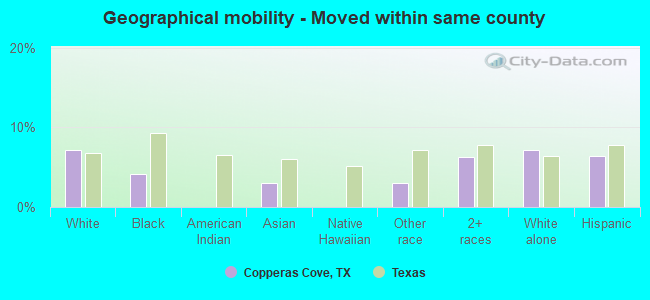
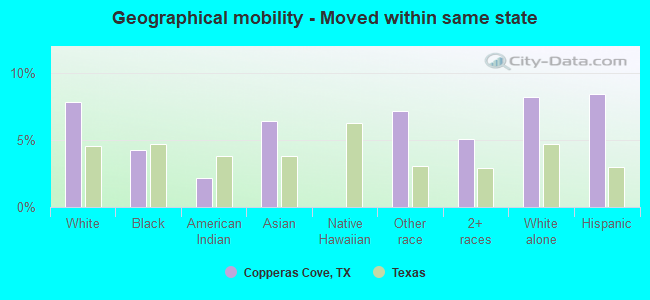
Geographical mobility - Moved within same county (%)
Geographical mobility - Moved within same county (%) - White
Geographical mobility - Moved within same county (%) - Black or African American
Geographical mobility - Moved within same county (%) - Asian
Geographical mobility - Moved within same county (%) - Hispanic or Latino
Geographical mobility - Moved within same county (%) - American Indian and Alaska Native
Geographical mobility - Moved within same county (%) - Multirace
Geographical mobility - Moved within same county (%) - Other Race
Geographical mobility - Moved from different county within same state (%)
Geographical mobility - Moved from different county within same state (%) - White
Geographical mobility - Moved from different county within same state (%) - Black or African American
Geographical mobility - Moved from different county within same state (%) - Asian
Geographical mobility - Moved from different county within same state (%) - Hispanic or Latino
Geographical mobility - Moved from different county within same state (%) - American Indian and Alaska Native
Geographical mobility - Moved from different county within same state (%) - Multirace
Geographical mobility - Moved from different county within same state (%) - Other Race
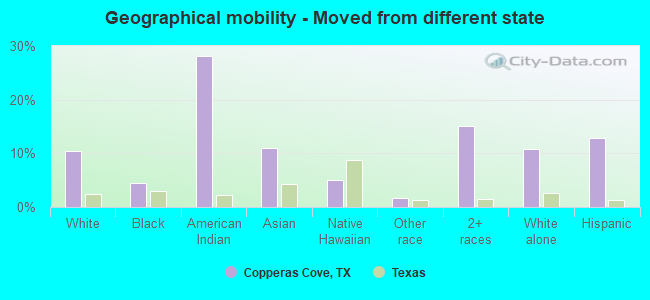
Geographical mobility - Moved from different state (%)
Geographical mobility - Moved from different state (%) - White
Geographical mobility - Moved from different state (%) - Black or African American
Geographical mobility - Moved from different state (%) - Asian
Geographical mobility - Moved from different state (%) - Hispanic or Latino
Geographical mobility - Moved from different state (%) - American Indian and Alaska Native
Geographical mobility - Moved from different state (%) - Multirace
Geographical mobility - Moved from different state (%) - Other Race
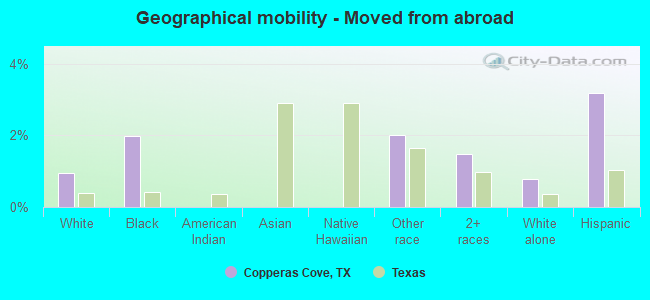
Geographical mobility - Moved from abroad (%)
Geographical mobility - Moved from abroad (%) - White
Geographical mobility - Moved from abroad (%) - Black or African American
Geographical mobility - Moved from abroad (%) - Asian
Geographical mobility - Moved from abroad (%) - Hispanic or Latino
Geographical mobility - Moved from abroad (%) - American Indian and Alaska Native
Geographical mobility - Moved from abroad (%) - Multirace
Geographical mobility - Moved from abroad (%) - Other Race
Place of birth for the foreign-born population - Ireland (%)
Place of birth for the foreign-born population - Denmark (%)
Place of birth for the foreign-born population - Norway (%)
Place of birth for the foreign-born population - Sweden (%)
Place of birth for the foreign-born population - United Kingdom (%)
Place of birth for the foreign-born population - England (%)
Place of birth for the foreign-born population - Scotland (%)
Place of birth for the foreign-born population - Other Northern Europe (%)
Place of birth for the foreign-born population - Austria (%)
Place of birth for the foreign-born population - Belgium (%)
Place of birth for the foreign-born population - France (%)
Place of birth for the foreign-born population - Germany (%)
Place of birth for the foreign-born population - Netherlands (%)
Place of birth for the foreign-born population - Switzerland (%)
Place of birth for the foreign-born population - Other Western Europe (%)
Place of birth for the foreign-born population - Greece (%)
Place of birth for the foreign-born population - Italy (%)
Place of birth for the foreign-born population - Portugal (%)
Place of birth for the foreign-born population - Spain (%)
Place of birth for the foreign-born population - Other Southern Europe (%)
Place of birth for the foreign-born population - Albania (%)
Place of birth for the foreign-born population - Belarus (%)
Place of birth for the foreign-born population - Bosnia and Herzegovina (%)
Place of birth for the foreign-born population - Bulgaria (%)
Place of birth for the foreign-born population - Croatia (%)
Place of birth for the foreign-born population - Czechoslovakia (%)
Place of birth for the foreign-born population - Hungary (%)
Place of birth for the foreign-born population - Latvia (%)
Place of birth for the foreign-born population - Lithuania (%)
Place of birth for the foreign-born population - North Macedonia (Macedonia) (%)
Place of birth for the foreign-born population - Moldova (%)
Place of birth for the foreign-born population - Poland (%)
Place of birth for the foreign-born population - Romania (%)
Place of birth for the foreign-born population - Russia (%)
Place of birth for the foreign-born population - Serbia (%)
Place of birth for the foreign-born population - Ukraine (%)
Place of birth for the foreign-born population - Other Eastern Europe (%)
Place of birth for the foreign-born population - China (%)
Place of birth for the foreign-born population - Hong Kong (%)
Place of birth for the foreign-born population - Taiwan (%)
Place of birth for the foreign-born population - Japan (%)
Place of birth for the foreign-born population - Korea (%)
Place of birth for the foreign-born population - Other Eastern Asia (%)
Place of birth for the foreign-born population - Afghanistan (%)
Place of birth for the foreign-born population - Bangladesh (%)
Place of birth for the foreign-born population - India (%)
Place of birth for the foreign-born population - Iran (%)
Place of birth for the foreign-born population - Kazakhstan (%)
Place of birth for the foreign-born population - Nepal (%)
Place of birth for the foreign-born population - Pakistan (%)
Place of birth for the foreign-born population - Sri Lanka (%)
Place of birth for the foreign-born population - Uzbekistan (%)
Place of birth for the foreign-born population - Other South Central Asia (%)
Place of birth for the foreign-born population - Burma (%)
Place of birth for the foreign-born population - Cambodia (%)
Place of birth for the foreign-born population - Indonesia (%)
Place of birth for the foreign-born population - Laos (%)
Place of birth for the foreign-born population - Malaysia (%)
Place of birth for the foreign-born population - Philippines (%)
Place of birth for the foreign-born population - Singapore (%)
Place of birth for the foreign-born population - Thailand (%)
Place of birth for the foreign-born population - Vietnam (%)
Place of birth for the foreign-born population - Other South Eastern Asia (%)
Place of birth for the foreign-born population - Armenia (%)
Place of birth for the foreign-born population - Iraq (%)
Place of birth for the foreign-born population - Israel (%)
Place of birth for the foreign-born population - Jordan (%)
Place of birth for the foreign-born population - Kuwait (%)
Place of birth for the foreign-born population - Lebanon (%)
Place of birth for the foreign-born population - Saudi Arabia (%)
Place of birth for the foreign-born population - Syria (%)
Place of birth for the foreign-born population - Turkey (%)
Place of birth for the foreign-born population - Yemen (%)
Place of birth for the foreign-born population - Other Western Asia (%)
Place of birth for the foreign-born population - Eritrea (%)
Place of birth for the foreign-born population - Ethiopia (%)
Place of birth for the foreign-born population - Kenya (%)
Place of birth for the foreign-born population - Somalia (%)
Place of birth for the foreign-born population - Uganda (%)
Place of birth for the foreign-born population - Zimbabwe (%)
Place of birth for the foreign-born population - Other Eastern Africa (%)
Place of birth for the foreign-born population - Cameroon (%)
Place of birth for the foreign-born population - Congo (%)
Place of birth for the foreign-born population - Democratic Republic of Congo (Zaire) (%)
Place of birth for the foreign-born population - Other Middle Africa (%)
Place of birth for the foreign-born population - Egypt (%)
Place of birth for the foreign-born population - Morocco (%)
Place of birth for the foreign-born population - Sudan (%)
Place of birth for the foreign-born population - Other Northern Africa (%)
Place of birth for the foreign-born population - South Africa (%)
Place of birth for the foreign-born population - Other Southern Africa (%)
Place of birth for the foreign-born population - Cabo Verde (%)
Place of birth for the foreign-born population - Ghana (%)
Place of birth for the foreign-born population - Liberia (%)
Place of birth for the foreign-born population - Nigeria (%)
Place of birth for the foreign-born population - Senegal (%)
Place of birth for the foreign-born population - Sierra Leone (%)
Place of birth for the foreign-born population - Other Western Africa (%)
Place of birth for the foreign-born population - Australia (%)
Place of birth for the foreign-born population - New Zealand (%)
Place of birth for the foreign-born population - Fiji (%)
Place of birth for the foreign-born population - Micronesia (%)
Place of birth for the foreign-born population - Bahamas (%)
Place of birth for the foreign-born population - Barbados (%)
Place of birth for the foreign-born population - Cuba (%)
Place of birth for the foreign-born population - Dominica (%)
Place of birth for the foreign-born population - Dominican Republic (%)
Place of birth for the foreign-born population - Grenada (%)
Place of birth for the foreign-born population - Haiti (%)
Place of birth for the foreign-born population - Jamaica (%)
Place of birth for the foreign-born population - St. Vincent and the Grenadines (%)
Place of birth for the foreign-born population - Trinidad and Tobago (%)
Place of birth for the foreign-born population - West Indies (%)
Place of birth for the foreign-born population - Other Caribbean (%)
Place of birth for the foreign-born population - Belize (%)
Place of birth for the foreign-born population - Costa Rica (%)
Place of birth for the foreign-born population - El Salvador (%)
Place of birth for the foreign-born population - Guatemala (%)
Place of birth for the foreign-born population - Honduras (%)
Place of birth for the foreign-born population - Mexico (%)
Place of birth for the foreign-born population - Nicaragua (%)
Place of birth for the foreign-born population - Panama (%)
Place of birth for the foreign-born population - Other Central America (%)
Place of birth for the foreign-born population - Argentina (%)
Place of birth for the foreign-born population - Bolivia (%)
Place of birth for the foreign-born population - Brazil (%)
Place of birth for the foreign-born population - Chile (%)
Place of birth for the foreign-born population - Colombia (%)
Place of birth for the foreign-born population - Ecuador (%)
Place of birth for the foreign-born population - Guyana (%)
Place of birth for the foreign-born population - Peru (%)
Place of birth for the foreign-born population - Uruguay (%)
Place of birth for the foreign-born population - Venezuela (%)
Place of birth for the foreign-born population - Other South America (%)
Place of birth for the foreign-born population - Canada (%)
Place of birth for the foreign-born population - Other Northern America (%)
Place of birth for the foreign-born population - Other (%)
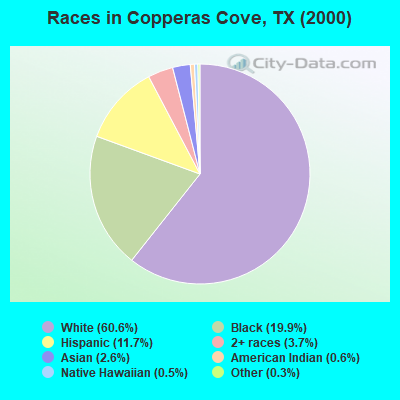
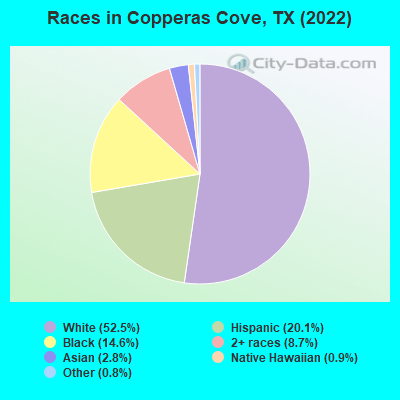
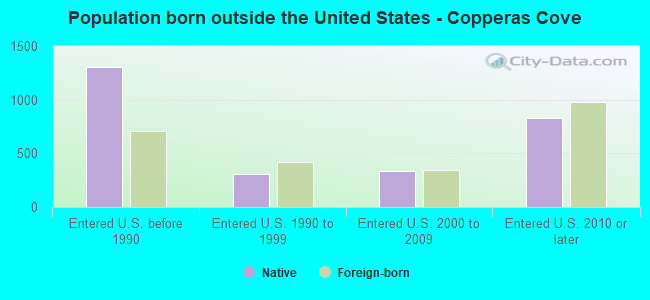
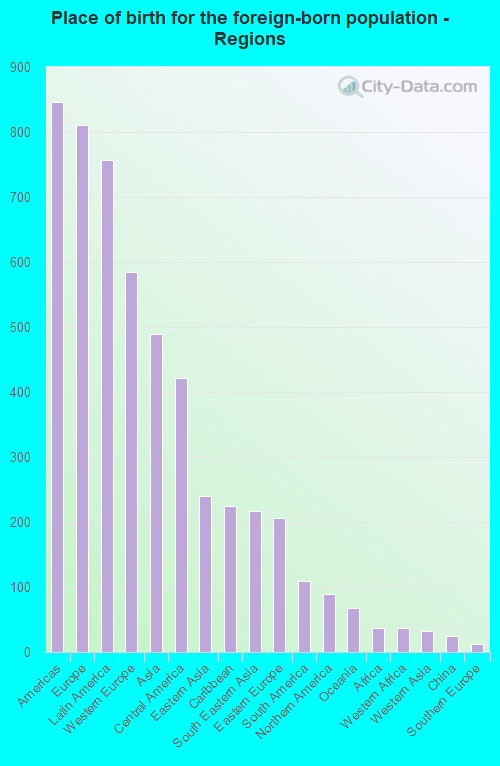
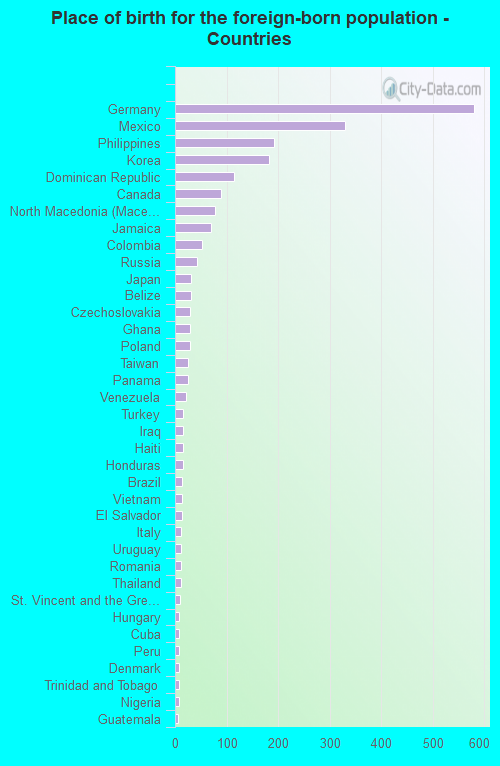
According to 2022 data, the most numerous races in Copperas Cove, TX are Hispanic (7,498 residents), White alone (19,635 residents), and Black alone (5,458 residents). 83.3% of Copperas Cove residents speak English at home. 6.0% of Copperas Cove, TX residents are foreign-born (2.1% born in Europe, 2.0% born in Latin America, 1.3% born in Asia), which is 182.0% less than the foreign-born rate of 17.0% across the entire state of Texas.
Race distribution in Copperas Cove
2000 2022
10,933,313 52.4% White alone 6,669,666 32.0% Hispanic 2,364,255 11.3% Black alone 554,445 2.7% Asian alone 230,567 1.1% Two or more races 68,859 0.3% American Indian alone 19,958 0.10% Other race alone 10,757 0.05% Native Hawaiian and Other
12,070,642 40.2% Hispanic 11,683,430 38.9% White alone 3,508,706 11.7% Black alone 1,608,173 5.4% Asian alone 956,560 3.2% Two or more races 125,763 0.4% Other race alone 47,023 0.2% American Indian alone 29,275 0.10% Native Hawaiian and Other
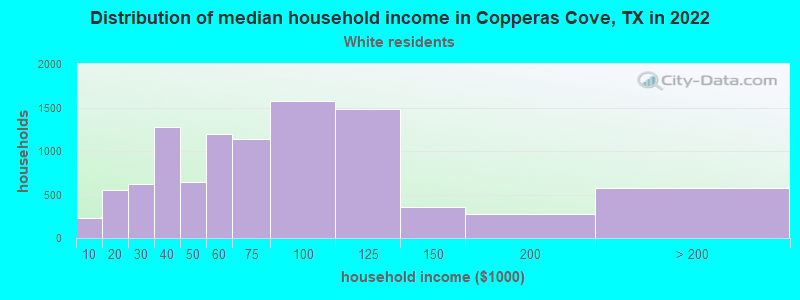
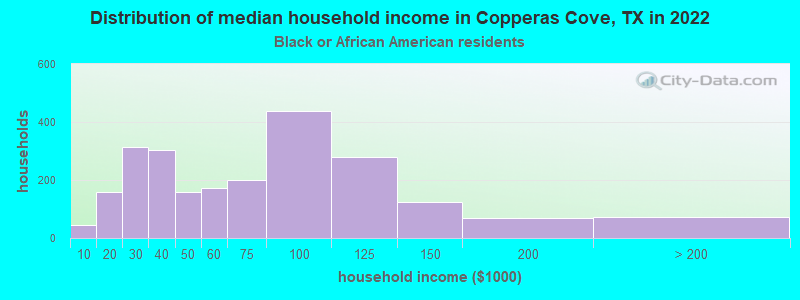
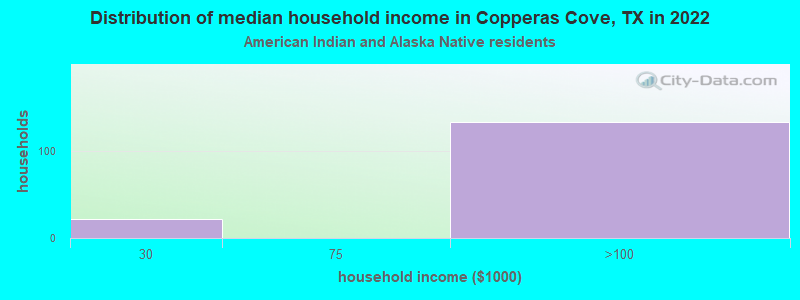
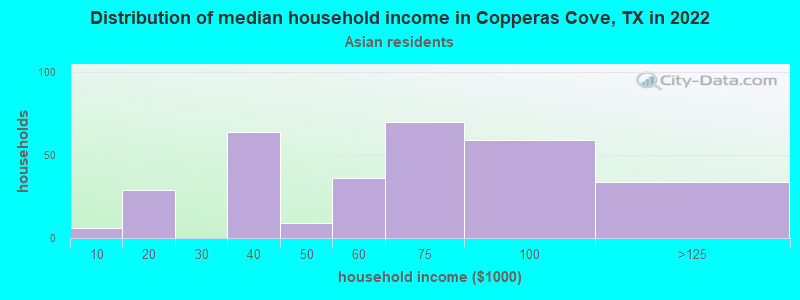
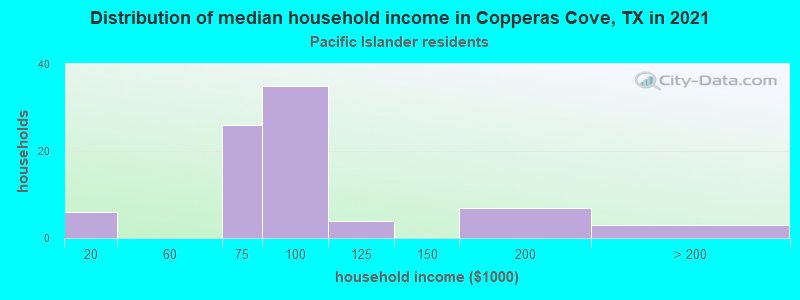
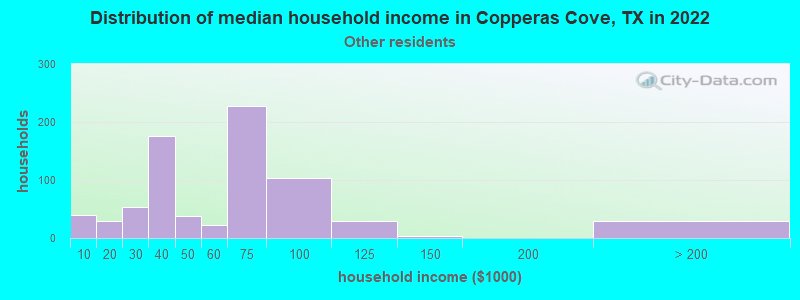
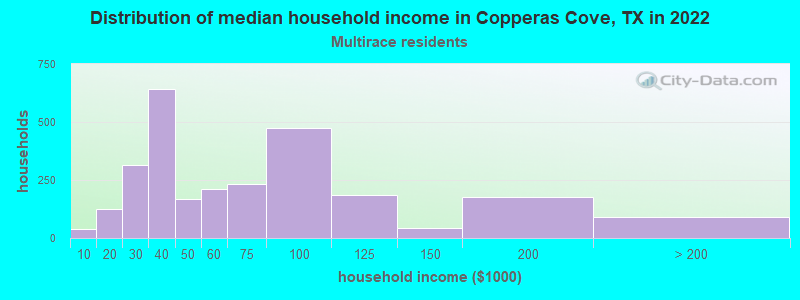
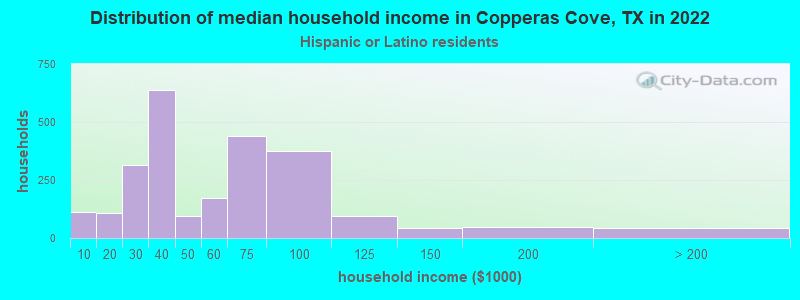
Income and house value in Copperas Cove Median household income in 2022 $69,247 White non-Hispanic householders$59,950 Black householders$76,780 American Indian and Alaska Native householders$54,010 Asian householders$76,977 Native Hawaiian and other Pacific Islander householders$66,291 Some other race householders$77,149 Two or more races householders$56,533 Hispanic or Latino race householdersMedian 2022 house value $172,534 White Non-Hispanic householders$184,101 Black or African American householders$147,955 American Indian or Alaska Native householders $167,233 Asian householders$256,151 Native Hawaiian and other Pacific Islander householders$175,185 Some other race householders$154,943 Two or more races householders$183,378 Hispanic or Latino householders
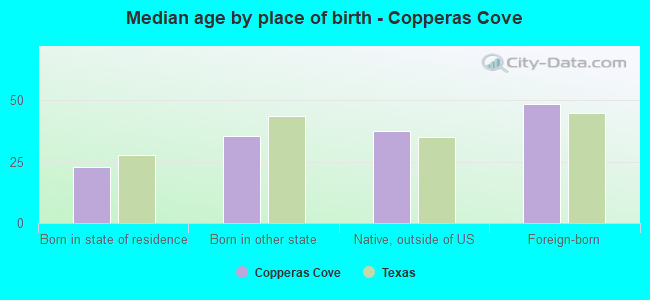
Median age by race in Copperas Cove
35.7 Median age for White residents35.2 37.5 33.0 Median age for Black or African American residents35.6 28.7 29.4 Median age for American Indian / Alaska Native residents-1,167,206,039.8 29.2 31.0 Median age for Asian residents25.6 47.2 34.7 Median age for Native Hawaiian / Pacific Islander residents35.2 39.4 34.0 Median age for Other race residents37.6 24.5 20.3 Median age for Two or more races residents23.4 19.8 36.6 Median age for White alone residents36.0 38.4 24.1 Median age for Hispanic or Latino residents29.2 21.3
Owner/renter occupied households by race in Copperas Cove
House owners and renters - White residents 5,194 55.1% Owner occupied4,235 44.9% Renter occupiedHouse owners and renters - Black or African American residents 510 21.7% Owner occupied1,834 78.3% Renter occupiedHouse owners and renters - American Indian / Alaska Native residents 149 90.9% Owner occupied15 9.1% Renter occupiedHouse owners and renters - Asian residents 109 25.2% Owner occupied325 74.8% Renter occupiedHouse owners and renters - Native Hawaiian / Pacific Islander residents 52 47.7% Owner occupied58 52.3% Renter occupiedHouse owners and renters - Other race residents 610 82.0% Owner occupied134 18.0% Renter occupiedHouse owners and renters - Two or more races residents 1,849 69.3% Owner occupied817 30.7% Renter occupiedHouse owners and renters - White alone residents 5,097 56.4% Owner occupied3,933 43.6% Renter occupiedHouse owners and renters - Hispanic or Latino residents 1,414 60.1% Owner occupied939 39.9% Renter occupied
Language usage in Copperas Cove
English speakers - Total 83.3% of residents of Copperas Cove speak English at home.
10.7% of residents speak Spanish at home 3,030 81.1% Speak English very well705 18.9% Speak English less than very well6.0% of residents speak other language at home 1,386 65.7% Speak English very well722 34.3% Speak English less than very well
English speakers - Born in the United States 91.6% of residents of Copperas Cove speak English at home.
6.8% of residents speak Spanish at home 1,301 97.0% Speak English very well40 3.0% Speak English less than very well1.6% of residents speak other language at home 227 72.5% Speak English very well86 27.5% Speak English less than very well
English speakers - Native, born elsewhere 62.4% of residents of Copperas Cove speak English at home.
28.0% of residents speak Spanish at home 441 54.4% Speak English very well369 45.6% Speak English less than very well11.0% of residents speak other language at home 82 25.8% Speak English very well236 74.2% Speak English less than very well
English speakers - Foreign-born 15.8% of residents of Copperas Cove speak English at home.
22.8% of residents speak Spanish at home 306 55.0% Speak English very well250 45.0% Speak English less than very well59.9% of residents speak other language at home 1,083 74.0% Speak English very well380 26.0% Speak English less than very well
White (Caucasian) - Speak only English Native:
96.9% (18,310)Foreign-born:
33.4% (205)
White (Caucasian) - Speak another language Native:
3.5% (662)Foreign-born:
61.9% (380)
Black or African American - Speak only English Native:
95.4% (4,813)Foreign-born:
44.8% (125)
Black or African American - Speak another language Native:
4.6% (232)Foreign-born:
53.1% (148)
American Indian / Alaska Native - Speak another language Native:
3.9% (5)Foreign-born:
98.9% (57)
Asian - Speak only English Native:
50.1% (247)Foreign-born:
27.5% (148)
Asian - Speak another language Native:
48.7% (240)Foreign-born:
94.7% (510)
Native Hawaiian / Pacific Islander - Speak only English Native:
47.5% (110)Foreign-born:
12.4% (9)
Native Hawaiian / Pacific Islander - Speak another language Native:
53.8% (125)Foreign-born:
89.1% (61)
Other race - Speak only English Native:
54.6% (655)Foreign-born:
2.5% (6)
Other race - Speak another language Native:
46.7% (560)Foreign-born:
97.2% (222)
Two or more races - Speak another language Native:
29.8% (1,954)Foreign-born:
99.1% (146)
White alone - Speak only English Native:
97.5% (17,387)Foreign-born:
25.0% (203)
White alone - Speak another language Native:
2.4% (430)Foreign-born:
74.4% (603)
Hispanic or Latino - Speak only English Native:
56.5% (3,578)Foreign-born:
11.4% (69)
Hispanic or Latino - Speak another language Native:
43.1% (2,727)Foreign-born:
88.0% (532)
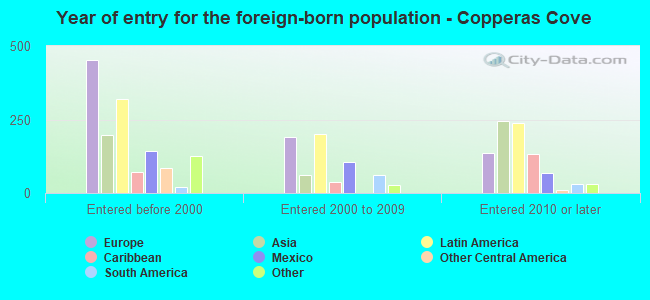
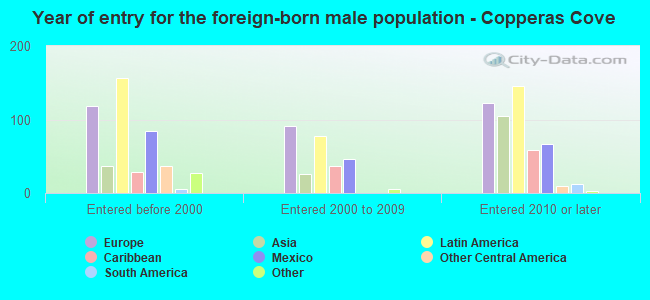
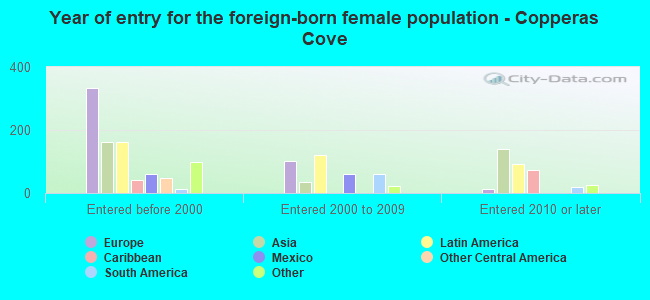
Foreign-born residents in Copperas Cove 2,253 residents are foreign born (2.1% Europe , 2.0% Latin America , 1.3% Asia ).
This city:
6.0%Texas:
17.1%
Marital status for residents in Copperas Cove Marital status - White (Caucasian) population 15 years and over
Males 28.9% Never married56.7% Now married1.8% Separated3.4% Widowed9.2% DivorcedFemales 24.1% Never married49.9% Now married2.7% Separated8.4% Widowed14.8% DivorcedWomen who gave birth in the past 12 months Now married:
82.5% (240)Unmarried:
17.5% (51)
Women who did not give birth in the past 12 months Now married:
55.2% (2,848)Unmarried:
44.8% (2,308)
Marital status - Black or African American population 15 years and over
Males 25.3% Never married57.0% Now married1.9% Separated0.6% Widowed15.3% DivorcedFemales 43.1% Never married29.3% Now married1.2% Separated4.6% Widowed21.8% DivorcedWomen who gave birth in the past 12 months Now married:
76.9% (50)Unmarried:
23.1% (15)
Women who did not give birth in the past 12 months Now married:
24.0% (377)Unmarried:
76.0% (1,196)
Marital status - American Indian / Alaska Native population 15 years and over
Males 53.3% Never married0.0% Now married0.0% Separated0.0% Widowed46.7% DivorcedFemales 0.0% Never married89.8% Now married0.0% Separated0.0% Widowed10.2% DivorcedWomen who gave birth in the past 12 months Now married:
100.0% (89)Unmarried:
0.0% (0)
Women who did not give birth in the past 12 months Now married:
76.1% (50)Unmarried:
23.9% (16)
Marital status - Asian population 15 years and over
Males 26.0% Never married66.0% Now married0.0% Separated0.0% Widowed8.0% DivorcedFemales 13.2% Never married76.2% Now married1.5% Separated9.1% Widowed0.0% DivorcedWomen who gave birth in the past 12 months Now married:
100.0% (94)Unmarried:
0.0% (0)
Women who did not give birth in the past 12 months Now married:
74.3% (189)Unmarried:
25.7% (66)
Marital status - Native Hawaiian / Pacific Islander population 15 years and over
Males 25.4% Never married62.3% Now married0.0% Separated0.0% Widowed12.3% DivorcedFemales 20.0% Never married26.7% Now married0.0% Separated43.3% Widowed10.0% DivorcedWomen who did not give birth in the past 12 months Now married:
45.5% (12)Unmarried:
54.5% (15)
Marital status - Other race population 15 years and over
Males 25.9% Never married62.3% Now married5.9% Separated0.0% Widowed5.9% DivorcedFemales 10.8% Never married86.7% Now married0.0% Separated0.0% Widowed2.5% DivorcedWomen who gave birth in the past 12 months Now married:
100.0% (19)Unmarried:
0.0% (0)
Women who did not give birth in the past 12 months Now married:
84.4% (365)Unmarried:
15.6% (67)
Marital status - Two or more races population 15 years and over
Males 33.7% Never married45.0% Now married7.2% Separated0.7% Widowed13.4% DivorcedFemales 44.3% Never married28.4% Now married4.3% Separated3.0% Widowed20.0% DivorcedWomen who gave birth in the past 12 months Now married:
9.2% (12)Unmarried:
90.8% (121)
Women who did not give birth in the past 12 months Now married:
32.4% (601)Unmarried:
67.6% (1,253)
Marital status - White alone, not Hispanic / Latino population 15 years and over
Males 26.5% Never married57.7% Now married2.0% Separated3.7% Widowed10.2% DivorcedFemales 23.5% Never married49.6% Now married2.4% Separated8.6% Widowed15.9% DivorcedWomen who gave birth in the past 12 months Now married:
81.7% (248)Unmarried:
18.3% (56)
Women who did not give birth in the past 12 months Now married:
55.1% (2,751)Unmarried:
44.9% (2,240)
Marital status - Hispanic or Latino population 15 years and over
Males 34.4% Never married50.8% Now married5.9% Separated0.8% Widowed8.1% DivorcedFemales 33.2% Never married48.9% Now married2.7% Separated4.7% Widowed10.5% DivorcedWomen who gave birth in the past 12 months Now married:
51.3% (85)Unmarried:
48.7% (81)
Women who did not give birth in the past 12 months Now married:
49.3% (996)Unmarried:
50.7% (1,026)
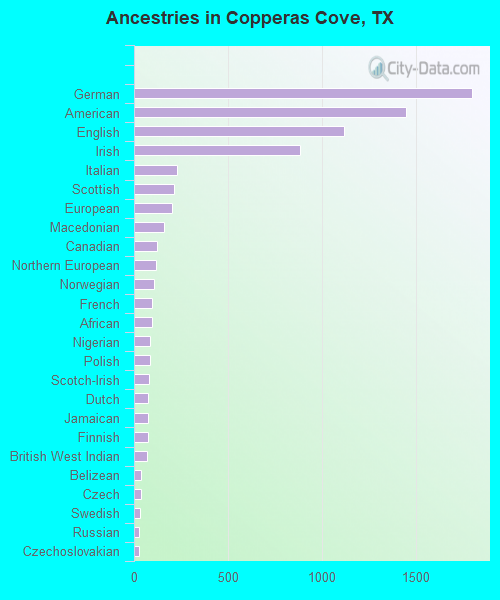
Ancestries in Copperas Cove
1,799 11.3% German1,447 9.1% American1,120 7.0% English883 5.5% Irish228 1.4% Italian213 1.3% Scottish204 1.3% European161 1.0% Macedonian123 0.8% Canadian115 0.7% Northern European105 0.7% Norwegian95 0.6% French94 0.6% African85 0.5% Nigerian84 0.5% Polish80 0.5% Scotch-Irish77 0.5% Dutch76 0.5% Jamaican74 0.5% Finnish71 0.4% British West Indian39 0.2% Belizean36 0.2% Czech31 0.2% Swedish29 0.2% Russian28 0.2% Czechoslovakian28 0.2% Icelander26 0.2% Arab24 0.2% Scandinavian22 0.1% British20 0.1% Israeli20 0.1% Haitian19 0.1% Welsh18 0.1% Albanian17 0.1% Brazilian17 0.1% Lebanese17 0.1% Turkish11 0.07% Latvian10 0.06% Romanian9 0.06% French Canadian8 0.05% Danish4 0.03% Australian
Geographical mobility in Copperas Cove Same house 1 year ago 14,793 73.5% White (Caucasian)4,820 85.2% Black or African American132 73.4% American Indian / Alaska Native760 81.1% Asian316 95.6% Native Hawaiian / Pacific Islander1,408 76.5% Other race5,475 70.5% Two or more races14,054 73.2% White alone, not Hispanic / Latino4,959 67.3% Hispanic or LatinoMoved within same county 1,447 7.2% White / Caucasian237 4.2% Black or African American28 3.0% Asian56 3.0% Other race485 6.2% Two or more races1,382 7.2% White alone, not Hispanic / Latino475 6.4% Hispanic or LatinoMoved within same state 1,583 7.9% White / Caucasian240 4.3% Black or African American4 2.1% American Indian / Alaska Native60 6.4% Asian131 7.1% Other race396 5.1% Two or more races1,575 8.2% White alone, not Hispanic / Latino619 8.4% Hispanic or LatinoMoved from different state 2,110 10.5% White / Caucasian250 4.4% Black or African American51 28.2% American Indian / Alaska Native103 11.0% Asian16 4.9% Native Hawaiian / Pacific Islander30 1.6% Other race1,172 15.1% Two or more races2,087 10.9% White alone, not Hispanic / Latino950 12.9% Hispanic or LatinoMoved from abroad 192 1.0% White113 2.0% Black or African American37 2.0% Other race116 1.5% Two or more races149 0.8% White alone, not Hispanic / Latino234 3.2% Hispanic or Latino
Children Nativity (place of birth) in Copperas Cove
Children under 6 years - Living with two parents Both parents native 1,258 100.0% NativeBoth parents foreign-born 24 100.0% NativeOne native, one foreign-born parent 211 100.0% NativeChildren under 6 years - Living with one parent Native parent 1,143 100.0% NativeForeign-born parent 95 72.9% Native35 27.1% Foreign-bornChildren 6 to 17 years - Living with two parents Both parents native 3,556 100.0% NativeBoth parents foreign-born 28 100.0% NativeOne native, one foreign-born parent 572 91.8% Native51 8.2% Foreign-bornChildren 6 to 17 years - Living with one parent Native parent 1,794 100.0% NativeForeign-born parent 118 58.9% Native82 41.1% Foreign-born
Grandparents responsible for own grandchildren in Copperas Cove
Grandparents (30 to 59 years) White / Caucasian 43 75.4% Responsible for grandchildren14 24.6% Not responsible for grandchildrenBlack or African American 69 100.0% Responsible for grandchildrenOther race 5 100.0% Responsible for grandchildrenTwo or more races 21 13.8% Responsible for grandchildren132 86.2% Not responsible for grandchildrenWhite alone, not Hispanic / Latino 56 72.0% Responsible for grandchildren22 28.0% Not responsible for grandchildrenHispanic or Latino 11 12.7% Responsible for grandchildren72 87.3% Not responsible for grandchildrenGrandparents (60 years and over) White / Caucasian 120 58.5% Responsible for grandchildren85 41.5% Not responsible for grandchildrenBlack or African American 41 76.2% Responsible for grandchildren13 23.8% Not responsible for grandchildrenTwo or more races 37 31.6% Responsible for grandchildren81 68.4% Not responsible for grandchildrenWhite alone, not Hispanic / Latino 139 54.3% Responsible for grandchildren117 45.7% Not responsible for grandchildrenHispanic or Latino 28 44.2% Responsible for grandchildren35 55.8% Not responsible for grandchildren