Races in Coram, New York (NY) Detailed Stats
Data:
Races - White alone (%)
Races - White alone (% change since 2000)
Races - Black alone (%)
Races - Black alone (% change since 2000)
Races - American Indian alone (%)
Races - American Indian alone (% change since 2000)
Races - Asian alone (%)
Races - Asian alone (% change since 2000)
Races - Hispanic (%)
Races - Hispanic (% change since 2000)
Races - Native Hawaiian and Other Pacific Islander alone (%)
Races - Native Hawaiian and Other Pacific Islander alone (% change since 2000)
Races - Two or more races(%)
Races - Two or more races(% change since 2000)
Races - Other race alone (%)
Races - Other race alone (% change since 2000)
Racial diversity
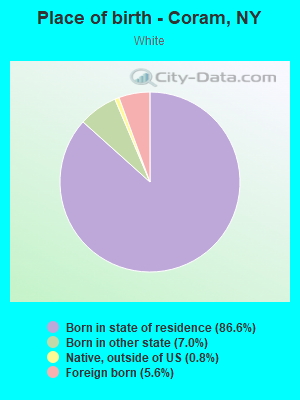
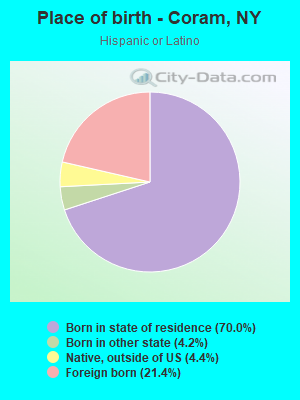
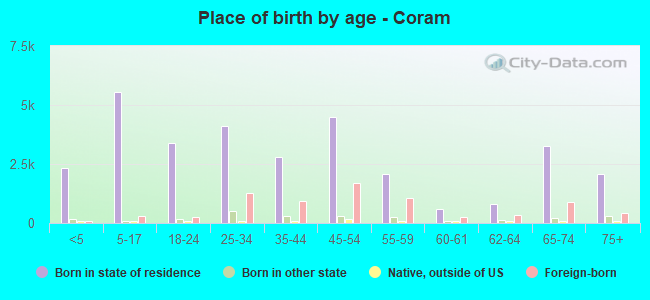
Place of birth - Born in state of residence (%)
Place of birth - Born in state of residence (%) - White
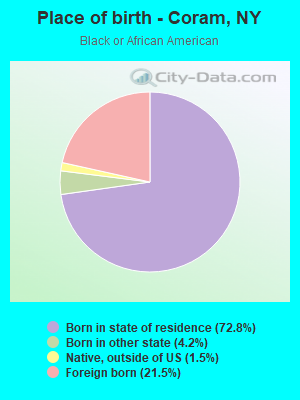
Place of birth - Born in state of residence (%) - Black or African American
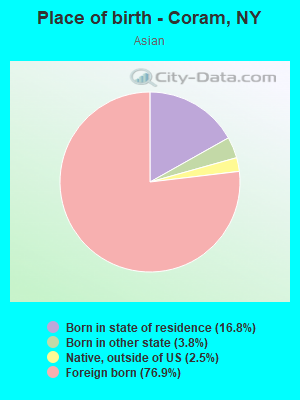
Place of birth - Born in state of residence (%) - Asian
Place of birth - Born in state of residence (%) - Hispanic or Latino
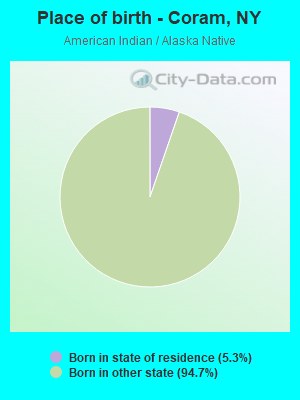
Place of birth - Born in state of residence (%) - American Indian and Alaska Native
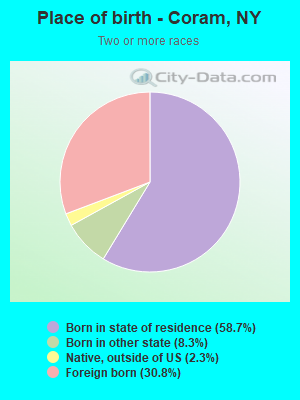
Place of birth - Born in state of residence (%) - Multirace
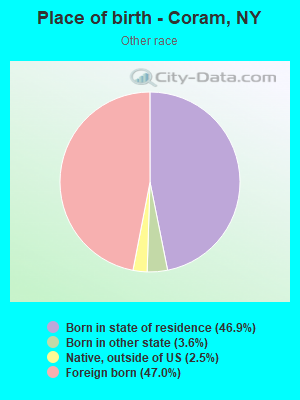
Place of birth - Born in state of residence (%) - Other Race
Place of birth - Born in other state (%)
Place of birth - Born in other state (%) - White
Place of birth - Born in other state (%) - Black or African American
Place of birth - Born in other state (%) - Asian
Place of birth - Born in other state (%) - Hispanic or Latino
Place of birth - Born in other state (%) - American Indian and Alaska Native
Place of birth - Born in other state (%) - Multirace
Place of birth - Born in other state (%) - Other Race
Place of birth - Native, outside of US (%)
Place of birth - Native, outside of US (%) - White
Place of birth - Native, outside of US (%) - Black or African American
Place of birth - Native, outside of US (%) - Asian
Place of birth - Native, outside of US (%) - Hispanic or Latino
Place of birth - Native, outside of US (%) - American Indian and Alaska Native
Place of birth - Native, outside of US (%) - Multirace
Place of birth - Native, outside of US (%) - Other Race
Place of birth - Foreign born (%)
Place of birth - Foreign born (%) - White
Place of birth - Foreign born (%) - Black or African American
Place of birth - Foreign born (%) - Asian
Place of birth - Foreign born (%) - Hispanic or Latino
Place of birth - Foreign born (%) - American Indian and Alaska Native
Place of birth - Foreign born (%) - Multirace
Place of birth - Foreign born (%) - Other Race
Residents speaking English at home (%)
Residents speaking English at home - Born in the United States (%)
Residents speaking English at home - Native, born elsewhere (%)
Residents speaking English at home - Foreign born (%)
Residents speaking Spanish at home (%)
Residents speaking Spanish at home - Born in the United States (%)
Residents speaking Spanish at home - Native, born elsewhere (%)
Residents speaking Spanish at home - Foreign born (%)
Residents speaking other language at home (%)
Residents speaking other language at home - Born in the United States (%)
Residents speaking other language at home - Native, born elsewhere (%)
Residents speaking other language at home - Foreign born (%)
Marital status - Never married (%)
Marital status - Now married (%)
Marital status - Separated (%)
Marital status - Widowed (%)
Marital status - Divorced (%)
Ancestries Reported - Arab (%)
Ancestries Reported - Czech (%)
Ancestries Reported - Danish (%)
Ancestries Reported - Dutch (%)
Ancestries Reported - English (%)
Ancestries Reported - French (%)
Ancestries Reported - French Canadian (%)
Ancestries Reported - German (%)
Ancestries Reported - Greek (%)
Ancestries Reported - Hungarian (%)
Ancestries Reported - Irish (%)
Ancestries Reported - Italian (%)
Ancestries Reported - Lithuanian (%)
Ancestries Reported - Norwegian (%)
Ancestries Reported - Polish (%)
Ancestries Reported - Portuguese (%)
Ancestries Reported - Russian (%)
Ancestries Reported - Scotch-Irish (%)
Ancestries Reported - Scottish (%)
Ancestries Reported - Slovak (%)
Ancestries Reported - Subsaharan African (%)
Ancestries Reported - Swedish (%)
Ancestries Reported - Swiss (%)
Ancestries Reported - Ukrainian (%)
Ancestries Reported - United States (%)
Ancestries Reported - Welsh (%)
Ancestries Reported - West Indian (%)
Ancestries Reported - Other (%)
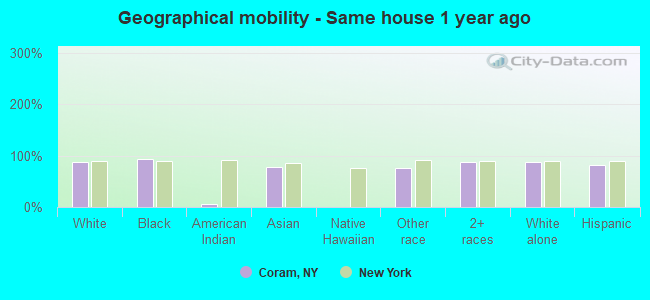
Geographical mobility - Same house 1 year ago (%)
Geographical mobility - Same house 1 year ago (%) - White
Geographical mobility - Same house 1 year ago (%) - Black or African American
Geographical mobility - Same house 1 year ago (%) - Asian
Geographical mobility - Same house 1 year ago (%) - Hispanic or Latino
Geographical mobility - Same house 1 year ago (%) - American Indian and Alaska Native
Geographical mobility - Same house 1 year ago (%) - Multirace
Geographical mobility - Same house 1 year ago (%) - Other Race
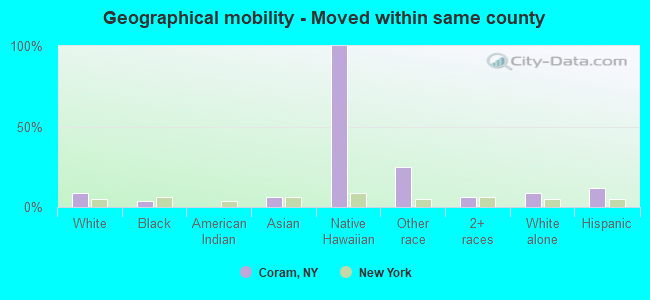
Geographical mobility - Moved within same county (%)
Geographical mobility - Moved within same county (%) - White
Geographical mobility - Moved within same county (%) - Black or African American
Geographical mobility - Moved within same county (%) - Asian
Geographical mobility - Moved within same county (%) - Hispanic or Latino
Geographical mobility - Moved within same county (%) - American Indian and Alaska Native
Geographical mobility - Moved within same county (%) - Multirace
Geographical mobility - Moved within same county (%) - Other Race
Geographical mobility - Moved from different county within same state (%)
Geographical mobility - Moved from different county within same state (%) - White
Geographical mobility - Moved from different county within same state (%) - Black or African American
Geographical mobility - Moved from different county within same state (%) - Asian
Geographical mobility - Moved from different county within same state (%) - Hispanic or Latino
Geographical mobility - Moved from different county within same state (%) - American Indian and Alaska Native
Geographical mobility - Moved from different county within same state (%) - Multirace
Geographical mobility - Moved from different county within same state (%) - Other Race
Geographical mobility - Moved from different state (%)
Geographical mobility - Moved from different state (%) - White
Geographical mobility - Moved from different state (%) - Black or African American
Geographical mobility - Moved from different state (%) - Asian
Geographical mobility - Moved from different state (%) - Hispanic or Latino
Geographical mobility - Moved from different state (%) - American Indian and Alaska Native
Geographical mobility - Moved from different state (%) - Multirace
Geographical mobility - Moved from different state (%) - Other Race
Geographical mobility - Moved from abroad (%)
Geographical mobility - Moved from abroad (%) - White
Geographical mobility - Moved from abroad (%) - Black or African American
Geographical mobility - Moved from abroad (%) - Asian
Geographical mobility - Moved from abroad (%) - Hispanic or Latino
Geographical mobility - Moved from abroad (%) - American Indian and Alaska Native
Geographical mobility - Moved from abroad (%) - Multirace
Geographical mobility - Moved from abroad (%) - Other Race
Place of birth for the foreign-born population - Ireland (%)
Place of birth for the foreign-born population - Denmark (%)
Place of birth for the foreign-born population - Norway (%)
Place of birth for the foreign-born population - Sweden (%)
Place of birth for the foreign-born population - United Kingdom (%)
Place of birth for the foreign-born population - England (%)
Place of birth for the foreign-born population - Scotland (%)
Place of birth for the foreign-born population - Other Northern Europe (%)
Place of birth for the foreign-born population - Austria (%)
Place of birth for the foreign-born population - Belgium (%)
Place of birth for the foreign-born population - France (%)
Place of birth for the foreign-born population - Germany (%)
Place of birth for the foreign-born population - Netherlands (%)
Place of birth for the foreign-born population - Switzerland (%)
Place of birth for the foreign-born population - Other Western Europe (%)
Place of birth for the foreign-born population - Greece (%)
Place of birth for the foreign-born population - Italy (%)
Place of birth for the foreign-born population - Portugal (%)
Place of birth for the foreign-born population - Spain (%)
Place of birth for the foreign-born population - Other Southern Europe (%)
Place of birth for the foreign-born population - Albania (%)
Place of birth for the foreign-born population - Belarus (%)
Place of birth for the foreign-born population - Bosnia and Herzegovina (%)
Place of birth for the foreign-born population - Bulgaria (%)
Place of birth for the foreign-born population - Croatia (%)
Place of birth for the foreign-born population - Czechoslovakia (%)
Place of birth for the foreign-born population - Hungary (%)
Place of birth for the foreign-born population - Latvia (%)
Place of birth for the foreign-born population - Lithuania (%)
Place of birth for the foreign-born population - North Macedonia (Macedonia) (%)
Place of birth for the foreign-born population - Moldova (%)
Place of birth for the foreign-born population - Poland (%)
Place of birth for the foreign-born population - Romania (%)
Place of birth for the foreign-born population - Russia (%)
Place of birth for the foreign-born population - Serbia (%)
Place of birth for the foreign-born population - Ukraine (%)
Place of birth for the foreign-born population - Other Eastern Europe (%)
Place of birth for the foreign-born population - China (%)
Place of birth for the foreign-born population - Hong Kong (%)
Place of birth for the foreign-born population - Taiwan (%)
Place of birth for the foreign-born population - Japan (%)
Place of birth for the foreign-born population - Korea (%)
Place of birth for the foreign-born population - Other Eastern Asia (%)
Place of birth for the foreign-born population - Afghanistan (%)
Place of birth for the foreign-born population - Bangladesh (%)
Place of birth for the foreign-born population - India (%)
Place of birth for the foreign-born population - Iran (%)
Place of birth for the foreign-born population - Kazakhstan (%)
Place of birth for the foreign-born population - Nepal (%)
Place of birth for the foreign-born population - Pakistan (%)
Place of birth for the foreign-born population - Sri Lanka (%)
Place of birth for the foreign-born population - Uzbekistan (%)
Place of birth for the foreign-born population - Other South Central Asia (%)
Place of birth for the foreign-born population - Burma (%)
Place of birth for the foreign-born population - Cambodia (%)
Place of birth for the foreign-born population - Indonesia (%)
Place of birth for the foreign-born population - Laos (%)
Place of birth for the foreign-born population - Malaysia (%)
Place of birth for the foreign-born population - Philippines (%)
Place of birth for the foreign-born population - Singapore (%)
Place of birth for the foreign-born population - Thailand (%)
Place of birth for the foreign-born population - Vietnam (%)
Place of birth for the foreign-born population - Other South Eastern Asia (%)
Place of birth for the foreign-born population - Armenia (%)
Place of birth for the foreign-born population - Iraq (%)
Place of birth for the foreign-born population - Israel (%)
Place of birth for the foreign-born population - Jordan (%)
Place of birth for the foreign-born population - Kuwait (%)
Place of birth for the foreign-born population - Lebanon (%)
Place of birth for the foreign-born population - Saudi Arabia (%)
Place of birth for the foreign-born population - Syria (%)
Place of birth for the foreign-born population - Turkey (%)
Place of birth for the foreign-born population - Yemen (%)
Place of birth for the foreign-born population - Other Western Asia (%)
Place of birth for the foreign-born population - Eritrea (%)
Place of birth for the foreign-born population - Ethiopia (%)
Place of birth for the foreign-born population - Kenya (%)
Place of birth for the foreign-born population - Somalia (%)
Place of birth for the foreign-born population - Uganda (%)
Place of birth for the foreign-born population - Zimbabwe (%)
Place of birth for the foreign-born population - Other Eastern Africa (%)
Place of birth for the foreign-born population - Cameroon (%)
Place of birth for the foreign-born population - Congo (%)
Place of birth for the foreign-born population - Democratic Republic of Congo (Zaire) (%)
Place of birth for the foreign-born population - Other Middle Africa (%)
Place of birth for the foreign-born population - Egypt (%)
Place of birth for the foreign-born population - Morocco (%)
Place of birth for the foreign-born population - Sudan (%)
Place of birth for the foreign-born population - Other Northern Africa (%)
Place of birth for the foreign-born population - South Africa (%)
Place of birth for the foreign-born population - Other Southern Africa (%)
Place of birth for the foreign-born population - Cabo Verde (%)
Place of birth for the foreign-born population - Ghana (%)
Place of birth for the foreign-born population - Liberia (%)
Place of birth for the foreign-born population - Nigeria (%)
Place of birth for the foreign-born population - Senegal (%)
Place of birth for the foreign-born population - Sierra Leone (%)
Place of birth for the foreign-born population - Other Western Africa (%)
Place of birth for the foreign-born population - Australia (%)
Place of birth for the foreign-born population - New Zealand (%)
Place of birth for the foreign-born population - Fiji (%)
Place of birth for the foreign-born population - Micronesia (%)
Place of birth for the foreign-born population - Bahamas (%)
Place of birth for the foreign-born population - Barbados (%)
Place of birth for the foreign-born population - Cuba (%)
Place of birth for the foreign-born population - Dominica (%)
Place of birth for the foreign-born population - Dominican Republic (%)
Place of birth for the foreign-born population - Grenada (%)
Place of birth for the foreign-born population - Haiti (%)
Place of birth for the foreign-born population - Jamaica (%)
Place of birth for the foreign-born population - St. Vincent and the Grenadines (%)
Place of birth for the foreign-born population - Trinidad and Tobago (%)
Place of birth for the foreign-born population - West Indies (%)
Place of birth for the foreign-born population - Other Caribbean (%)
Place of birth for the foreign-born population - Belize (%)
Place of birth for the foreign-born population - Costa Rica (%)
Place of birth for the foreign-born population - El Salvador (%)
Place of birth for the foreign-born population - Guatemala (%)
Place of birth for the foreign-born population - Honduras (%)
Place of birth for the foreign-born population - Mexico (%)
Place of birth for the foreign-born population - Nicaragua (%)
Place of birth for the foreign-born population - Panama (%)
Place of birth for the foreign-born population - Other Central America (%)
Place of birth for the foreign-born population - Argentina (%)
Place of birth for the foreign-born population - Bolivia (%)
Place of birth for the foreign-born population - Brazil (%)
Place of birth for the foreign-born population - Chile (%)
Place of birth for the foreign-born population - Colombia (%)
Place of birth for the foreign-born population - Ecuador (%)
Place of birth for the foreign-born population - Guyana (%)
Place of birth for the foreign-born population - Peru (%)
Place of birth for the foreign-born population - Uruguay (%)
Place of birth for the foreign-born population - Venezuela (%)
Place of birth for the foreign-born population - Other South America (%)
Place of birth for the foreign-born population - Canada (%)
Place of birth for the foreign-born population - Other Northern America (%)
Place of birth for the foreign-born population - Other (%)
Latest news about races in Coram, NY collected exclusively by city-data.com from local newspapers, TV, and radio stations
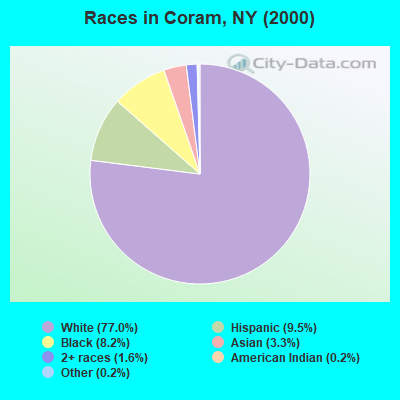
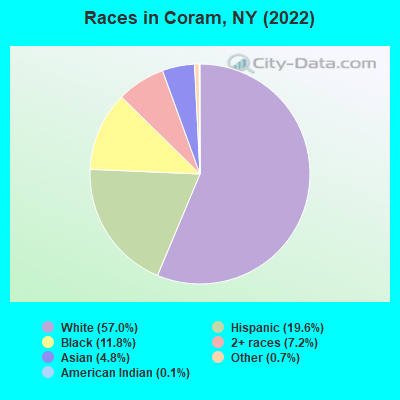
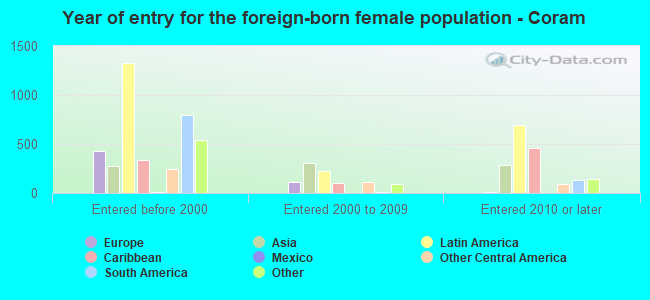
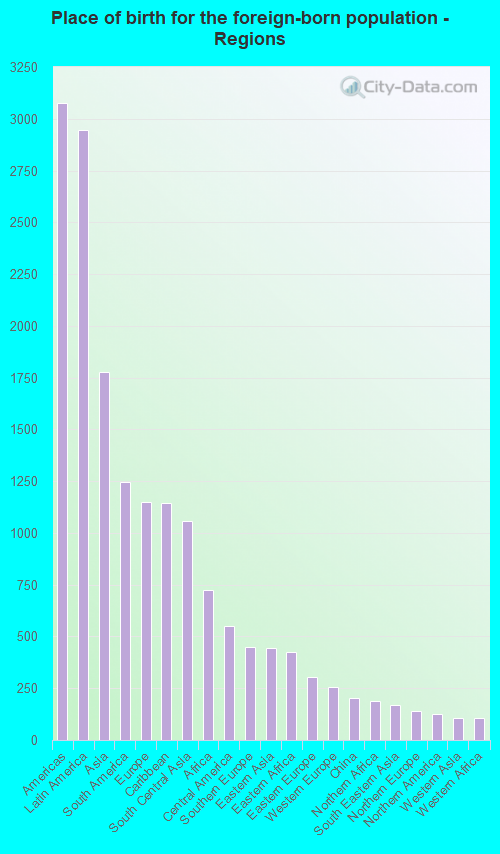
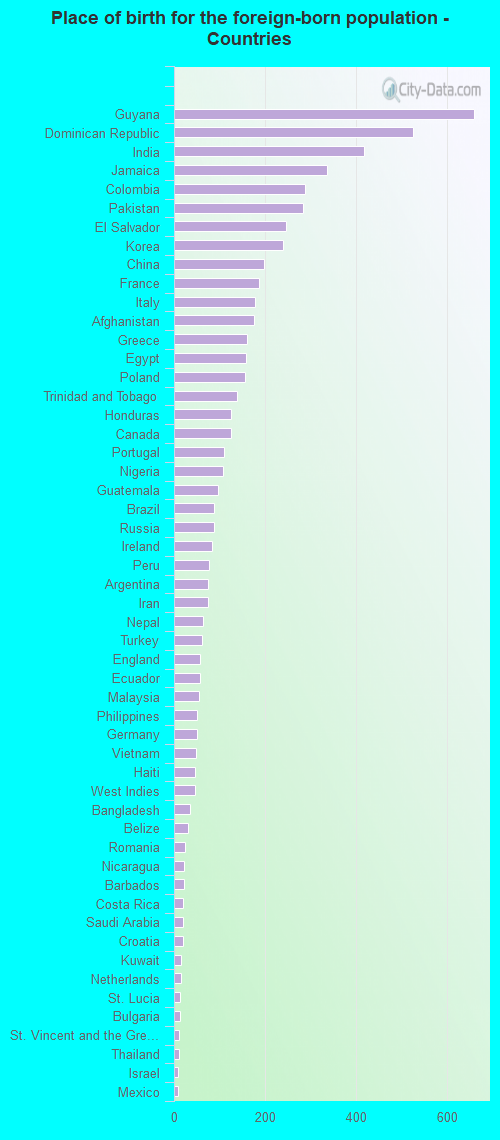
According to 2022 data, the most numerous races in Coram, NY are White alone (24,052 residents), Hispanic (8,277 residents), and Black alone (4,970 residents). 78.3% of Coram residents speak English at home. 15.9% of Coram, NY residents are foreign-born (7.1% born in Latin America, 4.3% born in Asia, 2.8% born in Europe, 1.7% born in Africa), which is 38.1% less than the foreign-born rate of 22.0% across the entire state of New York.
Race distribution in Coram
2000 2022
11,760,981 62.0% White alone 2,867,583 15.1% Hispanic 2,812,623 14.8% Black alone 1,035,926 5.5% Asian alone 366,116 1.9% Two or more races 75,499 0.4% Other race alone 52,499 0.3% American Indian alone 5,230 0.03% Native Hawaiian and Other
10,408,933 52.9% White alone 3,867,299 19.7% Hispanic 2,633,840 13.4% Black alone 1,776,286 9.0% Asian alone 732,670 3.7% Two or more races 216,110 1.1% Other race alone 35,082 0.2% American Indian alone 6,931 0.04% Native Hawaiian and Other
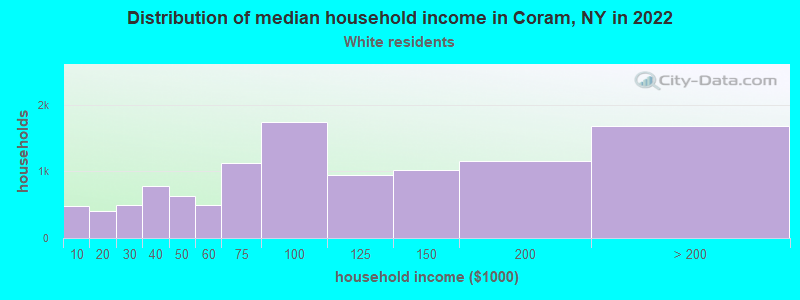
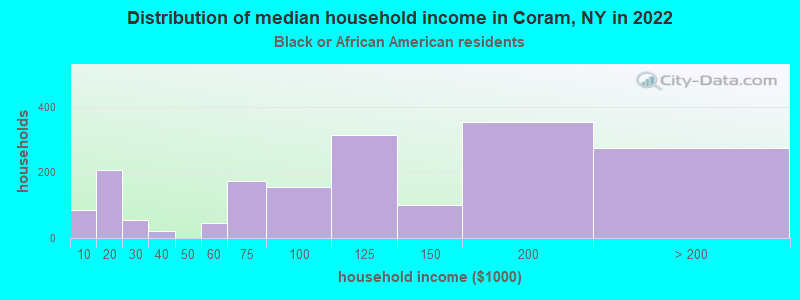
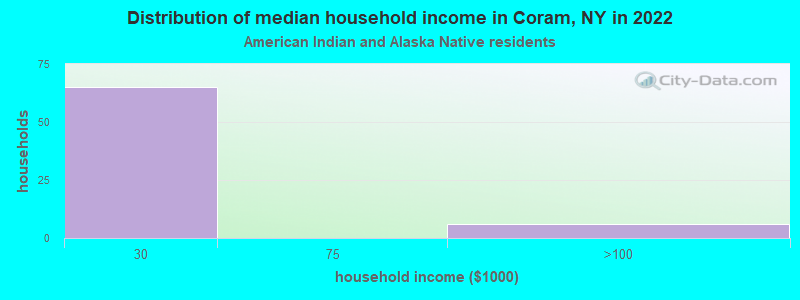
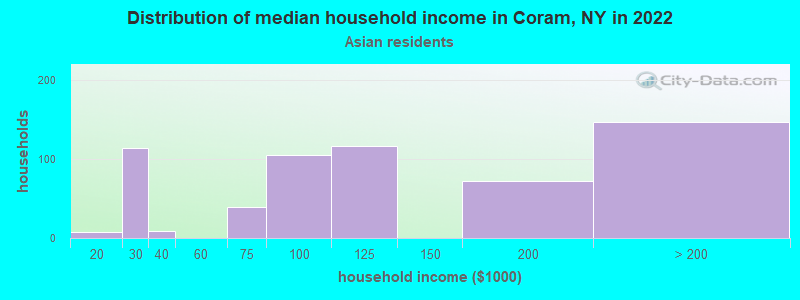
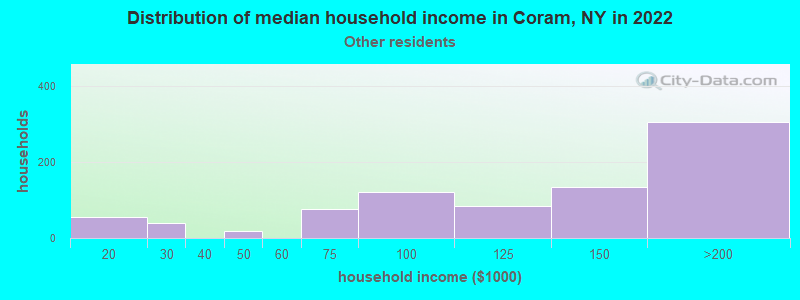
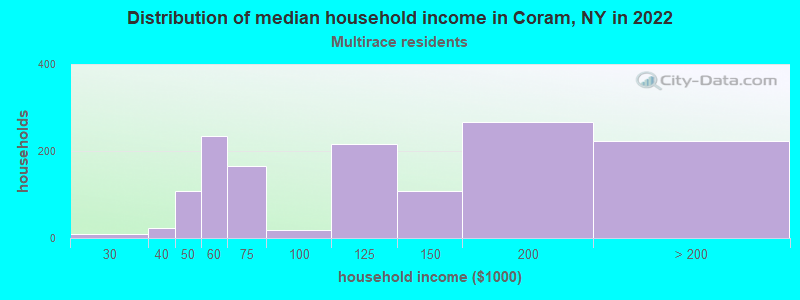
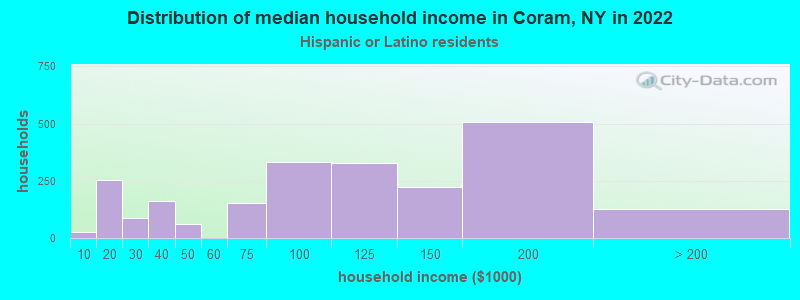
Income and house value in Coram Median household income in 2022 $91,454 White non-Hispanic householders$119,386 Black householders$101,658 Asian householders$117,485 Some other race householders$104,035 Two or more races householders$98,522 Hispanic or Latino race householdersMedian 2022 house value $428,299 White Non-Hispanic householders$435,942 Black or African American householders$382,166 American Indian or Alaska Native householders $440,310 Asian householders$470,337 Some other race householders$446,042 Two or more races householders$471,975 Hispanic or Latino householders
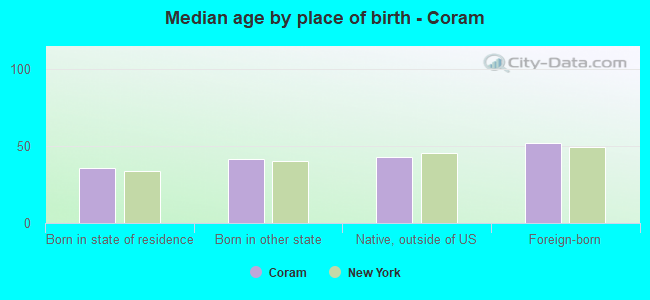
Median age by race in Coram
48.4 Median age for White residents47.8 48.9 29.6 Median age for Black or African American residents28.1 30.2 -748,832,865.7 Median age for American Indian / Alaska Native residents-807,017,543.1 -513,692,161.9 35.0 Median age for Asian residents36.3 32.0 -742,816,091.2 Median age for Native Hawaiian / Pacific Islander residents-831,187,409.8 -771,300,447.7 32.0 Median age for Other race residents30.4 36.1 34.5 Median age for Two or more races residents36.9 29.9 49.0 Median age for White alone residents48.5 49.6 26.7 Median age for Hispanic or Latino residents22.2 30.5
Owner/renter occupied households by race in Coram
House owners and renters - White residents 8,042 74.7% Owner occupied2,727 25.3% Renter occupiedHouse owners and renters - Black or African American residents 892 50.8% Owner occupied863 49.2% Renter occupiedHouse owners and renters - American Indian / Alaska Native residents 4 3.0% Owner occupied143 97.0% Renter occupiedHouse owners and renters - Asian residents 285 50.8% Owner occupied276 49.2% Renter occupiedHouse owners and renters - Native Hawaiian / Pacific Islander residents 24 100.0% Renter occupiedHouse owners and renters - Other race residents 447 52.5% Owner occupied405 47.5% Renter occupiedHouse owners and renters - Two or more races residents 968 64.9% Owner occupied522 35.1% Renter occupiedHouse owners and renters - White alone residents 7,671 75.3% Owner occupied2,516 24.7% Renter occupiedHouse owners and renters - Hispanic or Latino residents 1,218 53.6% Owner occupied1,054 46.4% Renter occupied
Language usage in Coram
English speakers - Total 78.3% of residents of Coram speak English at home.
10.2% of residents speak Spanish at home 2,861 70.9% Speak English very well1,177 29.1% Speak English less than very well11.1% of residents speak other language at home 2,883 65.8% Speak English very well1,499 34.2% Speak English less than very well
English speakers - Born in the United States 89.1% of residents of Coram speak English at home.
7.1% of residents speak Spanish at home 162 91.5% Speak English very well15 8.5% Speak English less than very well3.2% of residents speak other language at home 79 100.0% Speak English very well
English speakers - Native, born elsewhere 45.2% of residents of Coram speak English at home.
48.4% of residents speak Spanish at home 173 65.5% Speak English very well91 34.5% Speak English less than very well4.0% of residents speak other language at home 22 100.0% Speak English very well
English speakers - Foreign-born 30.9% of residents of Coram speak English at home.
23.2% of residents speak Spanish at home 799 47.1% Speak English very well896 52.9% Speak English less than very well43.1% of residents speak other language at home 1,643 52.3% Speak English very well1,500 47.7% Speak English less than very well
White (Caucasian) - Speak only English Native:
95.2% (22,331)Foreign-born:
56.8% (817)
White (Caucasian) - Speak another language Native:
4.9% (1,148)Foreign-born:
51.4% (740)
Black or African American - Speak only English Native:
82.5% (3,288)Foreign-born:
44.9% (604)
Black or African American - Speak another language Native:
19.4% (775)Foreign-born:
53.2% (716)
Asian - Speak only English Native:
75.1% (263)Foreign-born:
15.3% (234)
Asian - Speak another language Native:
19.5% (68)Foreign-born:
82.1% (1,255)
Other race - Speak only English Native:
55.6% (645)Foreign-born:
3.1% (37)
Other race - Speak another language Native:
46.3% (538)Foreign-born:
97.9% (1,168)
Two or more races - Speak only English Native:
70.8% (2,273)Foreign-born:
34.0% (553)
Two or more races - Speak another language Native:
29.4% (943)Foreign-born:
63.2% (1,029)
White alone - Speak only English Native:
96.0% (20,635)Foreign-born:
46.7% (797)
White alone - Speak another language Native:
4.0% (864)Foreign-born:
53.3% (911)
Hispanic or Latino - Speak only English Native:
66.7% (3,721)Foreign-born:
8.1% (141)
Hispanic or Latino - Speak another language Native:
34.5% (1,924)Foreign-born:
91.8% (1,596)
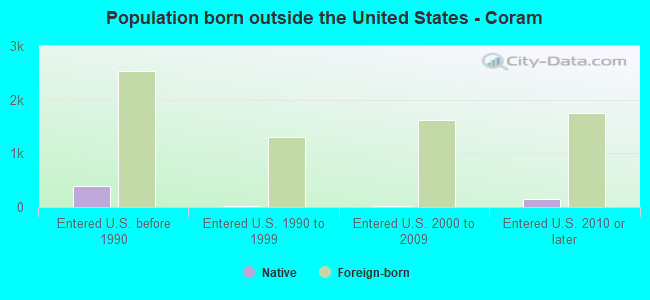
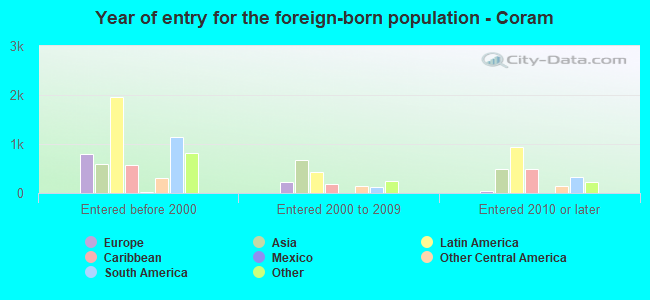
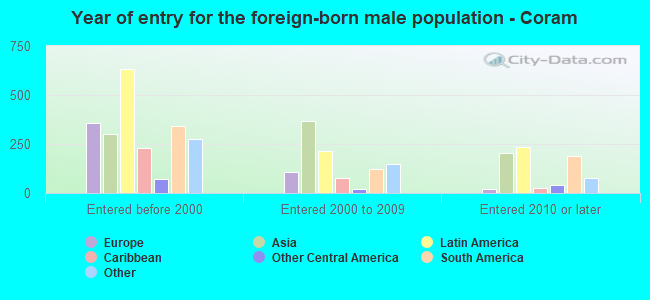
Foreign-born residents in Coram 6,723 residents are foreign born (7.1% Latin America , 4.3% Asia , 2.8% Europe , 1.7% Africa ).
This city:
15.9%New York:
22.6%
Marital status for residents in Coram Marital status - White (Caucasian) population 15 years and over
Males 35.4% Never married49.7% Now married1.8% Separated5.5% Widowed7.5% DivorcedFemales 29.1% Never married43.2% Now married2.3% Separated10.1% Widowed15.3% DivorcedWomen who gave birth in the past 12 months Now married:
64.6% (172)Unmarried:
35.4% (94)
Women who did not give birth in the past 12 months Now married:
39.9% (2,159)Unmarried:
60.1% (3,251)
Marital status - Black or African American population 15 years and over
Males 50.9% Never married39.4% Now married1.8% Separated0.3% Widowed7.7% DivorcedFemales 31.3% Never married45.4% Now married5.2% Separated4.5% Widowed13.6% DivorcedWomen who gave birth in the past 12 months Now married:
100.0% (81)Unmarried:
0.0% (0)
Women who did not give birth in the past 12 months Now married:
45.0% (575)Unmarried:
55.0% (704)
Marital status - American Indian / Alaska Native population 15 years and over
Males 0.0% Never married100.0% Now married0.0% Separated0.0% Widowed0.0% DivorcedFemales 0.0% Never married0.0% Now married0.0% Separated100.0% Widowed0.0% DivorcedMarital status - Asian population 15 years and over
Males 32.9% Never married63.3% Now married1.9% Separated0.5% Widowed1.3% DivorcedFemales 33.1% Never married57.4% Now married1.0% Separated5.8% Widowed2.6% DivorcedWomen who gave birth in the past 12 months Now married:
100.0% (7)Unmarried:
0.0% (0)
Women who did not give birth in the past 12 months Now married:
47.8% (249)Unmarried:
52.2% (272)
Marital status - Other race population 15 years and over
Males 35.5% Never married64.5% Now married0.0% Separated0.0% Widowed0.0% DivorcedFemales 20.6% Never married49.2% Now married0.0% Separated6.8% Widowed23.4% DivorcedWomen who gave birth in the past 12 months Now married:
100.0% (184)Unmarried:
0.0% (0)
Women who did not give birth in the past 12 months Now married:
46.1% (299)Unmarried:
53.9% (350)
Marital status - Two or more races population 15 years and over
Males 18.0% Never married59.2% Now married7.4% Separated0.1% Widowed15.3% DivorcedFemales 52.1% Never married40.3% Now married0.7% Separated2.2% Widowed4.7% DivorcedWomen who gave birth in the past 12 months Now married:
100.0% (1)Unmarried:
0.0% (0)
Women who did not give birth in the past 12 months Now married:
31.4% (498)Unmarried:
68.6% (1,089)
Marital status - White alone, not Hispanic / Latino population 15 years and over
Males 34.5% Never married50.5% Now married1.6% Separated5.1% Widowed8.3% DivorcedFemales 29.0% Never married43.1% Now married2.2% Separated9.6% Widowed16.0% DivorcedWomen who gave birth in the past 12 months Now married:
61.2% (162)Unmarried:
38.8% (102)
Women who did not give birth in the past 12 months Now married:
38.1% (1,946)Unmarried:
61.9% (3,160)
Marital status - Hispanic or Latino population 15 years and over
Males 38.8% Never married50.3% Now married5.6% Separated4.7% Widowed0.5% DivorcedFemales 29.5% Never married47.3% Now married1.6% Separated9.8% Widowed11.8% DivorcedWomen who gave birth in the past 12 months Now married:
100.0% (158)Unmarried:
0.0% (0)
Women who did not give birth in the past 12 months Now married:
49.5% (956)Unmarried:
50.5% (976)
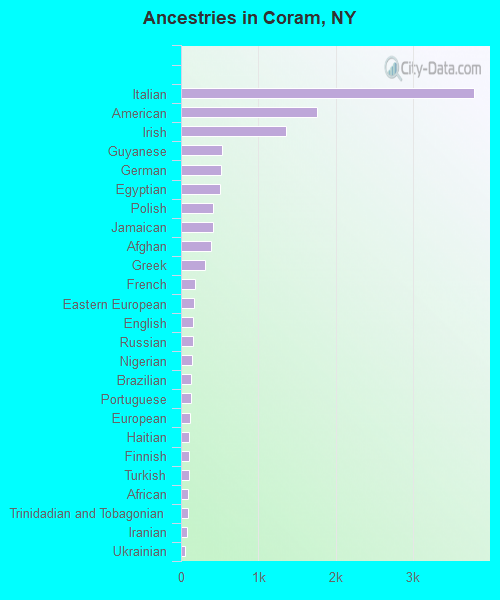
Ancestries in Coram
3,794 18.9% Italian1,761 8.8% American1,355 6.8% Irish524 2.6% Guyanese515 2.6% German505 2.5% Egyptian414 2.1% Polish408 2.0% Jamaican387 1.9% Afghan310 1.5% Greek185 0.9% French166 0.8% Eastern European156 0.8% English153 0.8% Russian147 0.7% Nigerian126 0.6% Brazilian125 0.6% Portuguese122 0.6% European107 0.5% Haitian105 0.5% Finnish99 0.5% Turkish97 0.5% African88 0.4% Trinidadian and Tobagonian82 0.4% Iranian49 0.2% Ukrainian33 0.2% Swedish33 0.2% Barbadian32 0.2% Jordanian24 0.1% Israeli22 0.1% French Canadian19 0.09% Hungarian18 0.09% Czechoslovakian17 0.08% Dutch15 0.07% Czech15 0.07% Scandinavian12 0.06% Austrian11 0.05% Norwegian11 0.05% Scottish11 0.05% Bulgarian9 0.04% Romanian7 0.03% Maltese7 0.03% Croatian
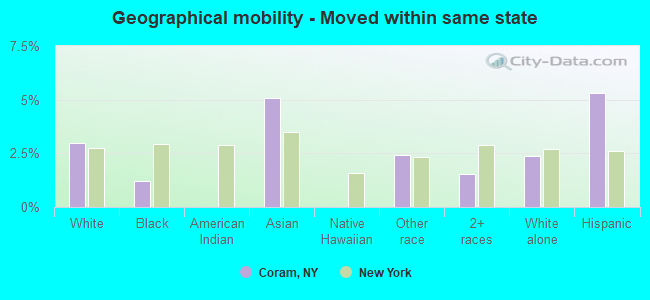
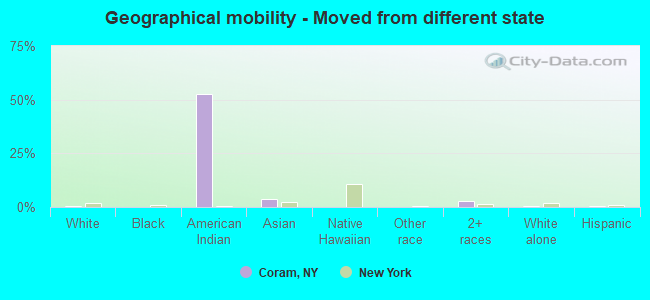
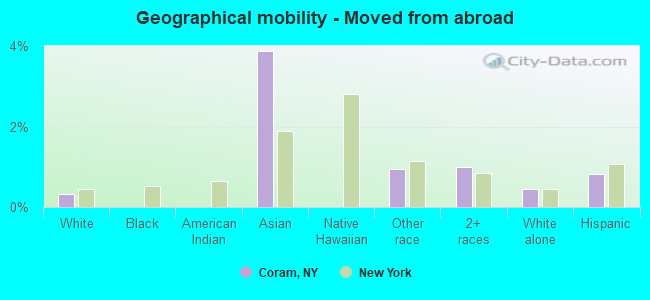
Geographical mobility in Coram Same house 1 year ago 22,330 87.4% White (Caucasian)5,588 93.5% Black or African American5 6.4% American Indian / Alaska Native1,584 78.3% Asian1,849 75.5% Other race4,694 88.5% Two or more races21,041 88.3% White alone, not Hispanic / Latino6,617 82.2% Hispanic or LatinoMoved within same county 2,247 8.8% White / Caucasian242 4.1% Black or African American129 6.4% Asian32 100.0% Native Hawaiian / Pacific Islander608 24.8% Other race325 6.1% Two or more races2,041 8.6% White alone, not Hispanic / Latino967 12.0% Hispanic or LatinoMoved within same state 760 3.0% White / Caucasian72 1.2% Black or African American103 5.1% Asian59 2.4% Other race81 1.5% Two or more races562 2.4% White alone, not Hispanic / Latino427 5.3% Hispanic or LatinoMoved from different state 129 0.5% White / Caucasian4 0.1% Black or African American45 52.6% American Indian / Alaska Native75 3.7% Asian148 2.8% Two or more races136 0.6% White alone, not Hispanic / Latino21 0.3% Hispanic or LatinoMoved from abroad 80 0.3% White79 3.9% Asian23 0.9% Other race53 1.0% Two or more races107 0.4% White alone, not Hispanic / Latino67 0.8% Hispanic or Latino
Children Nativity (place of birth) in Coram
Children under 6 years - Living with two parents Both parents native 1,662 100.0% NativeBoth parents foreign-born 352 100.0% NativeOne native, one foreign-born parent 155 100.0% NativeChildren under 6 years - Living with one parent Native parent 420 100.0% NativeForeign-born parent 342 100.0% NativeChildren 6 to 17 years - Living with two parents Both parents native 2,712 98.7% Native37 1.3% Foreign-bornBoth parents foreign-born 372 75.4% Native122 24.6% Foreign-bornOne native, one foreign-born parent 347 100.0% NativeChildren 6 to 17 years - Living with one parent Native parent 1,114 100.0% NativeForeign-born parent 407 56.1% Native318 43.9% Foreign-born
Grandparents responsible for own grandchildren in Coram
Grandparents (30 to 59 years) White / Caucasian 39 100.0% Not responsible for grandchildrenBlack or African American 18 17.5% Responsible for grandchildren87 82.5% Not responsible for grandchildrenTwo or more races 202 100.0% Not responsible for grandchildrenWhite alone, not Hispanic / Latino 44 100.0% Not responsible for grandchildrenGrandparents (60 years and over) White / Caucasian 28 10.1% Responsible for grandchildren251 89.9% Not responsible for grandchildrenBlack or African American 45 74.4% Responsible for grandchildren15 25.6% Not responsible for grandchildrenTwo or more races 50 100.0% Not responsible for grandchildrenWhite alone, not Hispanic / Latino 34 11.4% Responsible for grandchildren266 88.6% Not responsible for grandchildren