Races in Cornelius, Oregon (OR) Detailed Stats
Data:
Races - White alone (%)
Races - White alone (% change since 2000)
Races - Black alone (%)
Races - Black alone (% change since 2000)
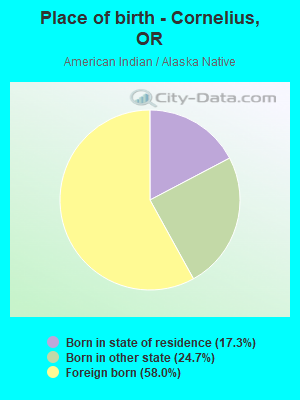
Races - American Indian alone (%)
Races - American Indian alone (% change since 2000)
Races - Asian alone (%)
Races - Asian alone (% change since 2000)
Races - Hispanic (%)
Races - Hispanic (% change since 2000)
Races - Native Hawaiian and Other Pacific Islander alone (%)
Races - Native Hawaiian and Other Pacific Islander alone (% change since 2000)
Races - Two or more races(%)
Races - Two or more races(% change since 2000)
Races - Other race alone (%)
Races - Other race alone (% change since 2000)
Racial diversity
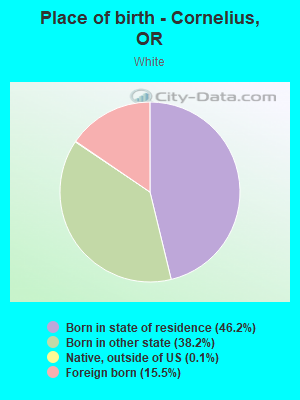
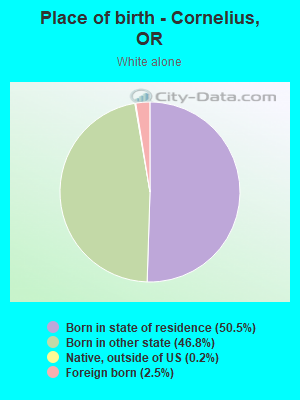
Place of birth - Born in state of residence (%)
Place of birth - Born in state of residence (%) - White
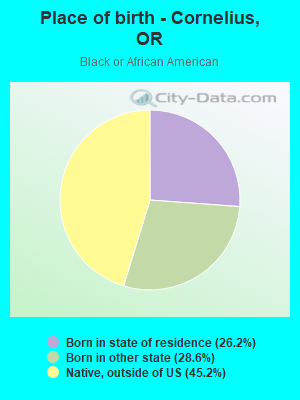
Place of birth - Born in state of residence (%) - Black or African American
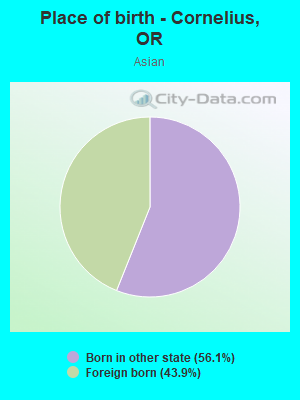
Place of birth - Born in state of residence (%) - Asian
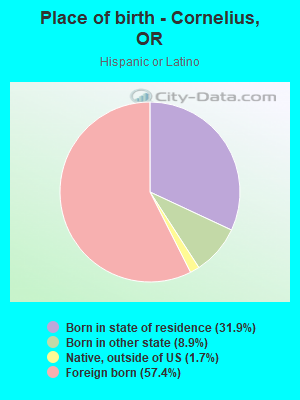
Place of birth - Born in state of residence (%) - Hispanic or Latino
Place of birth - Born in state of residence (%) - American Indian and Alaska Native
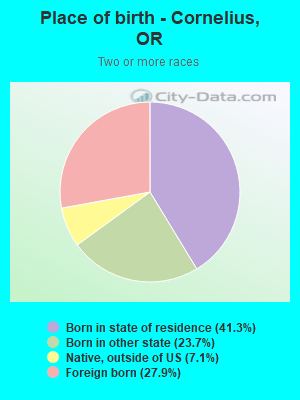
Place of birth - Born in state of residence (%) - Multirace
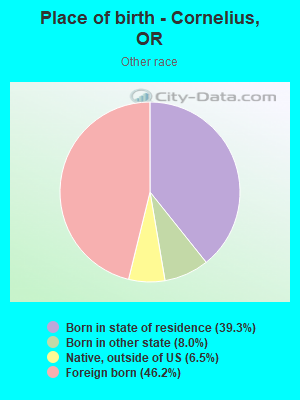
Place of birth - Born in state of residence (%) - Other Race
Place of birth - Born in other state (%)
Place of birth - Born in other state (%) - White
Place of birth - Born in other state (%) - Black or African American
Place of birth - Born in other state (%) - Asian
Place of birth - Born in other state (%) - Hispanic or Latino
Place of birth - Born in other state (%) - American Indian and Alaska Native
Place of birth - Born in other state (%) - Multirace
Place of birth - Born in other state (%) - Other Race
Place of birth - Native, outside of US (%)
Place of birth - Native, outside of US (%) - White
Place of birth - Native, outside of US (%) - Black or African American
Place of birth - Native, outside of US (%) - Asian
Place of birth - Native, outside of US (%) - Hispanic or Latino
Place of birth - Native, outside of US (%) - American Indian and Alaska Native
Place of birth - Native, outside of US (%) - Multirace
Place of birth - Native, outside of US (%) - Other Race
Place of birth - Foreign born (%)
Place of birth - Foreign born (%) - White
Place of birth - Foreign born (%) - Black or African American
Place of birth - Foreign born (%) - Asian
Place of birth - Foreign born (%) - Hispanic or Latino
Place of birth - Foreign born (%) - American Indian and Alaska Native
Place of birth - Foreign born (%) - Multirace
Place of birth - Foreign born (%) - Other Race
Residents speaking English at home (%)
Residents speaking English at home - Born in the United States (%)
Residents speaking English at home - Native, born elsewhere (%)
Residents speaking English at home - Foreign born (%)
Residents speaking Spanish at home (%)
Residents speaking Spanish at home - Born in the United States (%)
Residents speaking Spanish at home - Native, born elsewhere (%)
Residents speaking Spanish at home - Foreign born (%)
Residents speaking other language at home (%)
Residents speaking other language at home - Born in the United States (%)
Residents speaking other language at home - Native, born elsewhere (%)
Residents speaking other language at home - Foreign born (%)
Marital status - Never married (%)
Marital status - Now married (%)
Marital status - Separated (%)
Marital status - Widowed (%)
Marital status - Divorced (%)
Ancestries Reported - Arab (%)
Ancestries Reported - Czech (%)
Ancestries Reported - Danish (%)
Ancestries Reported - Dutch (%)
Ancestries Reported - English (%)
Ancestries Reported - French (%)
Ancestries Reported - French Canadian (%)
Ancestries Reported - German (%)
Ancestries Reported - Greek (%)
Ancestries Reported - Hungarian (%)
Ancestries Reported - Irish (%)
Ancestries Reported - Italian (%)
Ancestries Reported - Lithuanian (%)
Ancestries Reported - Norwegian (%)
Ancestries Reported - Polish (%)
Ancestries Reported - Portuguese (%)
Ancestries Reported - Russian (%)
Ancestries Reported - Scotch-Irish (%)
Ancestries Reported - Scottish (%)
Ancestries Reported - Slovak (%)
Ancestries Reported - Subsaharan African (%)
Ancestries Reported - Swedish (%)
Ancestries Reported - Swiss (%)
Ancestries Reported - Ukrainian (%)
Ancestries Reported - United States (%)
Ancestries Reported - Welsh (%)
Ancestries Reported - West Indian (%)
Ancestries Reported - Other (%)
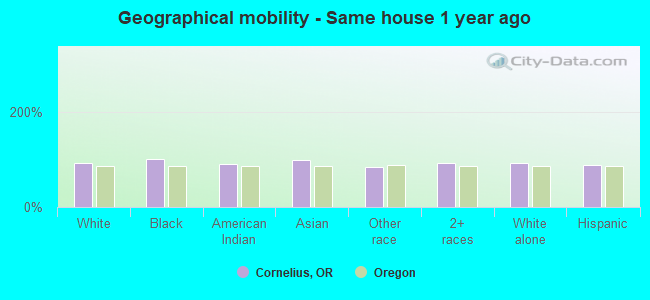
Geographical mobility - Same house 1 year ago (%)
Geographical mobility - Same house 1 year ago (%) - White
Geographical mobility - Same house 1 year ago (%) - Black or African American
Geographical mobility - Same house 1 year ago (%) - Asian
Geographical mobility - Same house 1 year ago (%) - Hispanic or Latino
Geographical mobility - Same house 1 year ago (%) - American Indian and Alaska Native
Geographical mobility - Same house 1 year ago (%) - Multirace
Geographical mobility - Same house 1 year ago (%) - Other Race
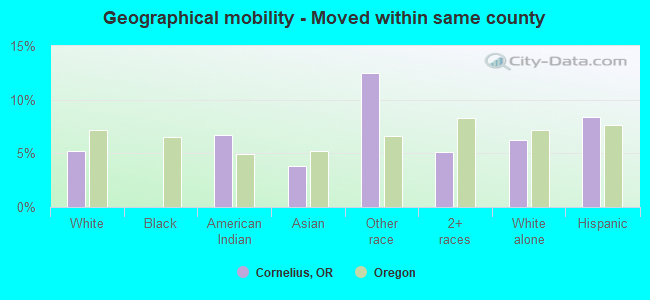
Geographical mobility - Moved within same county (%)
Geographical mobility - Moved within same county (%) - White
Geographical mobility - Moved within same county (%) - Black or African American
Geographical mobility - Moved within same county (%) - Asian
Geographical mobility - Moved within same county (%) - Hispanic or Latino
Geographical mobility - Moved within same county (%) - American Indian and Alaska Native
Geographical mobility - Moved within same county (%) - Multirace
Geographical mobility - Moved within same county (%) - Other Race
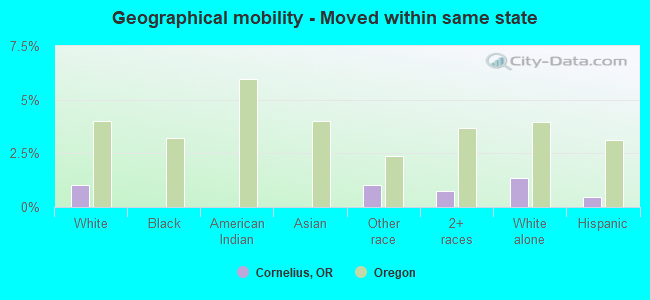
Geographical mobility - Moved from different county within same state (%)
Geographical mobility - Moved from different county within same state (%) - White
Geographical mobility - Moved from different county within same state (%) - Black or African American
Geographical mobility - Moved from different county within same state (%) - Asian
Geographical mobility - Moved from different county within same state (%) - Hispanic or Latino
Geographical mobility - Moved from different county within same state (%) - American Indian and Alaska Native
Geographical mobility - Moved from different county within same state (%) - Multirace
Geographical mobility - Moved from different county within same state (%) - Other Race
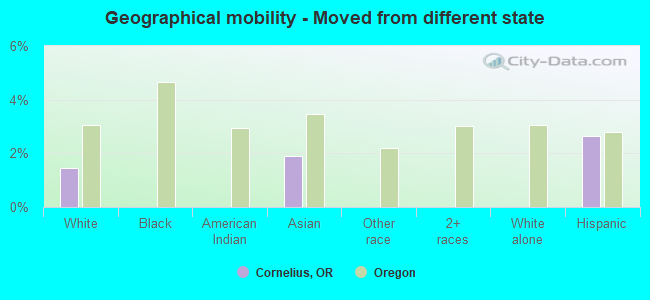
Geographical mobility - Moved from different state (%)
Geographical mobility - Moved from different state (%) - White
Geographical mobility - Moved from different state (%) - Black or African American
Geographical mobility - Moved from different state (%) - Asian
Geographical mobility - Moved from different state (%) - Hispanic or Latino
Geographical mobility - Moved from different state (%) - American Indian and Alaska Native
Geographical mobility - Moved from different state (%) - Multirace
Geographical mobility - Moved from different state (%) - Other Race
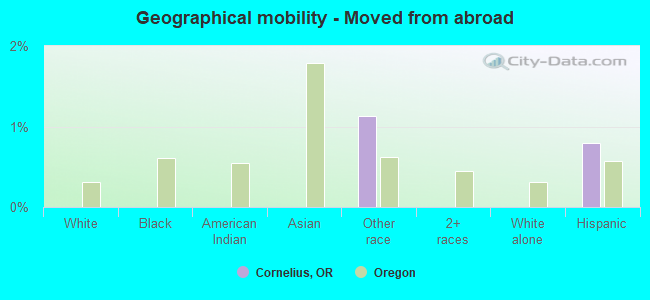
Geographical mobility - Moved from abroad (%)
Geographical mobility - Moved from abroad (%) - White
Geographical mobility - Moved from abroad (%) - Black or African American
Geographical mobility - Moved from abroad (%) - Asian
Geographical mobility - Moved from abroad (%) - Hispanic or Latino
Geographical mobility - Moved from abroad (%) - American Indian and Alaska Native
Geographical mobility - Moved from abroad (%) - Multirace
Geographical mobility - Moved from abroad (%) - Other Race
Place of birth for the foreign-born population - Ireland (%)
Place of birth for the foreign-born population - Denmark (%)
Place of birth for the foreign-born population - Norway (%)
Place of birth for the foreign-born population - Sweden (%)
Place of birth for the foreign-born population - United Kingdom (%)
Place of birth for the foreign-born population - England (%)
Place of birth for the foreign-born population - Scotland (%)
Place of birth for the foreign-born population - Other Northern Europe (%)
Place of birth for the foreign-born population - Austria (%)
Place of birth for the foreign-born population - Belgium (%)
Place of birth for the foreign-born population - France (%)
Place of birth for the foreign-born population - Germany (%)
Place of birth for the foreign-born population - Netherlands (%)
Place of birth for the foreign-born population - Switzerland (%)
Place of birth for the foreign-born population - Other Western Europe (%)
Place of birth for the foreign-born population - Greece (%)
Place of birth for the foreign-born population - Italy (%)
Place of birth for the foreign-born population - Portugal (%)
Place of birth for the foreign-born population - Spain (%)
Place of birth for the foreign-born population - Other Southern Europe (%)
Place of birth for the foreign-born population - Albania (%)
Place of birth for the foreign-born population - Belarus (%)
Place of birth for the foreign-born population - Bosnia and Herzegovina (%)
Place of birth for the foreign-born population - Bulgaria (%)
Place of birth for the foreign-born population - Croatia (%)
Place of birth for the foreign-born population - Czechoslovakia (%)
Place of birth for the foreign-born population - Hungary (%)
Place of birth for the foreign-born population - Latvia (%)
Place of birth for the foreign-born population - Lithuania (%)
Place of birth for the foreign-born population - North Macedonia (Macedonia) (%)
Place of birth for the foreign-born population - Moldova (%)
Place of birth for the foreign-born population - Poland (%)
Place of birth for the foreign-born population - Romania (%)
Place of birth for the foreign-born population - Russia (%)
Place of birth for the foreign-born population - Serbia (%)
Place of birth for the foreign-born population - Ukraine (%)
Place of birth for the foreign-born population - Other Eastern Europe (%)
Place of birth for the foreign-born population - China (%)
Place of birth for the foreign-born population - Hong Kong (%)
Place of birth for the foreign-born population - Taiwan (%)
Place of birth for the foreign-born population - Japan (%)
Place of birth for the foreign-born population - Korea (%)
Place of birth for the foreign-born population - Other Eastern Asia (%)
Place of birth for the foreign-born population - Afghanistan (%)
Place of birth for the foreign-born population - Bangladesh (%)
Place of birth for the foreign-born population - India (%)
Place of birth for the foreign-born population - Iran (%)
Place of birth for the foreign-born population - Kazakhstan (%)
Place of birth for the foreign-born population - Nepal (%)
Place of birth for the foreign-born population - Pakistan (%)
Place of birth for the foreign-born population - Sri Lanka (%)
Place of birth for the foreign-born population - Uzbekistan (%)
Place of birth for the foreign-born population - Other South Central Asia (%)
Place of birth for the foreign-born population - Burma (%)
Place of birth for the foreign-born population - Cambodia (%)
Place of birth for the foreign-born population - Indonesia (%)
Place of birth for the foreign-born population - Laos (%)
Place of birth for the foreign-born population - Malaysia (%)
Place of birth for the foreign-born population - Philippines (%)
Place of birth for the foreign-born population - Singapore (%)
Place of birth for the foreign-born population - Thailand (%)
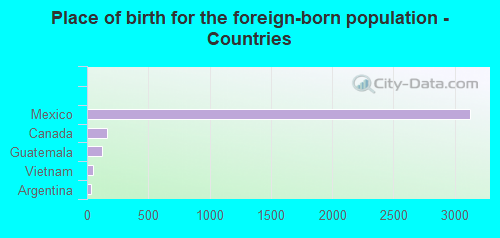
Place of birth for the foreign-born population - Vietnam (%)
Place of birth for the foreign-born population - Other South Eastern Asia (%)
Place of birth for the foreign-born population - Armenia (%)
Place of birth for the foreign-born population - Iraq (%)
Place of birth for the foreign-born population - Israel (%)
Place of birth for the foreign-born population - Jordan (%)
Place of birth for the foreign-born population - Kuwait (%)
Place of birth for the foreign-born population - Lebanon (%)
Place of birth for the foreign-born population - Saudi Arabia (%)
Place of birth for the foreign-born population - Syria (%)
Place of birth for the foreign-born population - Turkey (%)
Place of birth for the foreign-born population - Yemen (%)
Place of birth for the foreign-born population - Other Western Asia (%)
Place of birth for the foreign-born population - Eritrea (%)
Place of birth for the foreign-born population - Ethiopia (%)
Place of birth for the foreign-born population - Kenya (%)
Place of birth for the foreign-born population - Somalia (%)
Place of birth for the foreign-born population - Uganda (%)
Place of birth for the foreign-born population - Zimbabwe (%)
Place of birth for the foreign-born population - Other Eastern Africa (%)
Place of birth for the foreign-born population - Cameroon (%)
Place of birth for the foreign-born population - Congo (%)
Place of birth for the foreign-born population - Democratic Republic of Congo (Zaire) (%)
Place of birth for the foreign-born population - Other Middle Africa (%)
Place of birth for the foreign-born population - Egypt (%)
Place of birth for the foreign-born population - Morocco (%)
Place of birth for the foreign-born population - Sudan (%)
Place of birth for the foreign-born population - Other Northern Africa (%)
Place of birth for the foreign-born population - South Africa (%)
Place of birth for the foreign-born population - Other Southern Africa (%)
Place of birth for the foreign-born population - Cabo Verde (%)
Place of birth for the foreign-born population - Ghana (%)
Place of birth for the foreign-born population - Liberia (%)
Place of birth for the foreign-born population - Nigeria (%)
Place of birth for the foreign-born population - Senegal (%)
Place of birth for the foreign-born population - Sierra Leone (%)
Place of birth for the foreign-born population - Other Western Africa (%)
Place of birth for the foreign-born population - Australia (%)
Place of birth for the foreign-born population - New Zealand (%)
Place of birth for the foreign-born population - Fiji (%)
Place of birth for the foreign-born population - Micronesia (%)
Place of birth for the foreign-born population - Bahamas (%)
Place of birth for the foreign-born population - Barbados (%)
Place of birth for the foreign-born population - Cuba (%)
Place of birth for the foreign-born population - Dominica (%)
Place of birth for the foreign-born population - Dominican Republic (%)
Place of birth for the foreign-born population - Grenada (%)
Place of birth for the foreign-born population - Haiti (%)
Place of birth for the foreign-born population - Jamaica (%)
Place of birth for the foreign-born population - St. Vincent and the Grenadines (%)
Place of birth for the foreign-born population - Trinidad and Tobago (%)
Place of birth for the foreign-born population - West Indies (%)
Place of birth for the foreign-born population - Other Caribbean (%)
Place of birth for the foreign-born population - Belize (%)
Place of birth for the foreign-born population - Costa Rica (%)
Place of birth for the foreign-born population - El Salvador (%)
Place of birth for the foreign-born population - Guatemala (%)
Place of birth for the foreign-born population - Honduras (%)
Place of birth for the foreign-born population - Mexico (%)
Place of birth for the foreign-born population - Nicaragua (%)
Place of birth for the foreign-born population - Panama (%)
Place of birth for the foreign-born population - Other Central America (%)
Place of birth for the foreign-born population - Argentina (%)
Place of birth for the foreign-born population - Bolivia (%)
Place of birth for the foreign-born population - Brazil (%)
Place of birth for the foreign-born population - Chile (%)
Place of birth for the foreign-born population - Colombia (%)
Place of birth for the foreign-born population - Ecuador (%)
Place of birth for the foreign-born population - Guyana (%)
Place of birth for the foreign-born population - Peru (%)
Place of birth for the foreign-born population - Uruguay (%)
Place of birth for the foreign-born population - Venezuela (%)
Place of birth for the foreign-born population - Other South America (%)
Place of birth for the foreign-born population - Canada (%)
Place of birth for the foreign-born population - Other Northern America (%)
Place of birth for the foreign-born population - Other (%)
Latest news about races in Cornelius, OR collected exclusively by city-data.com from local newspapers, TV, and radio stations
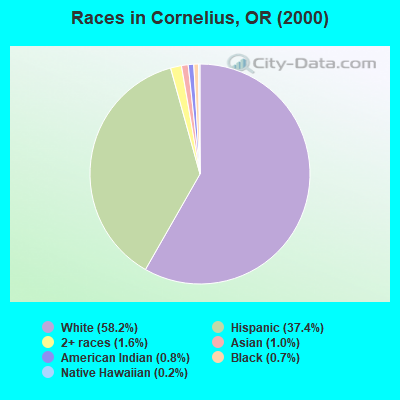
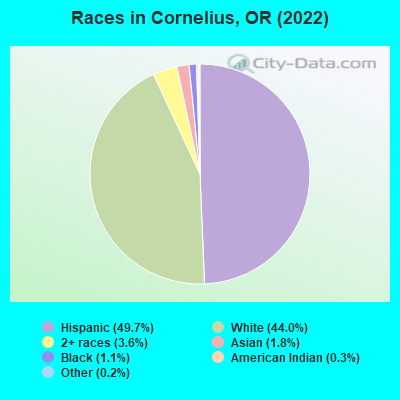
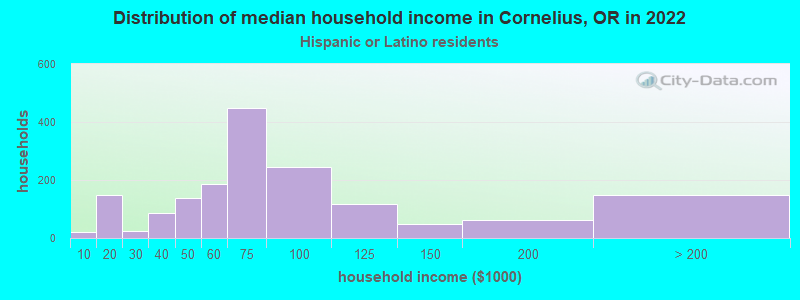
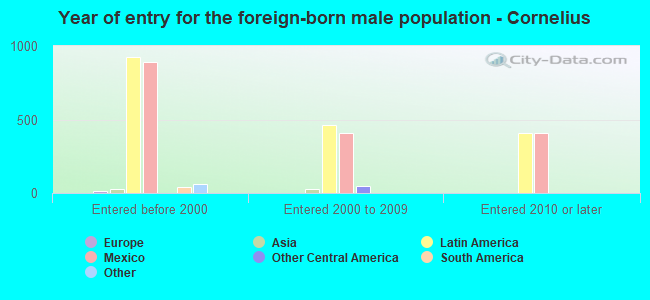
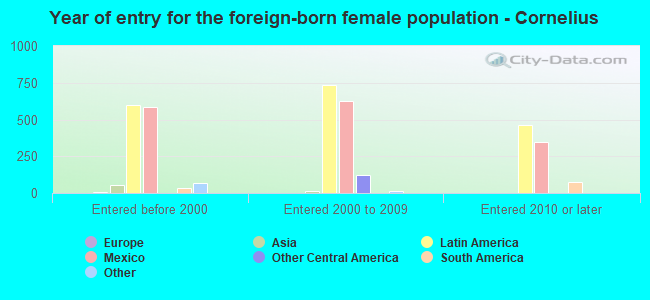
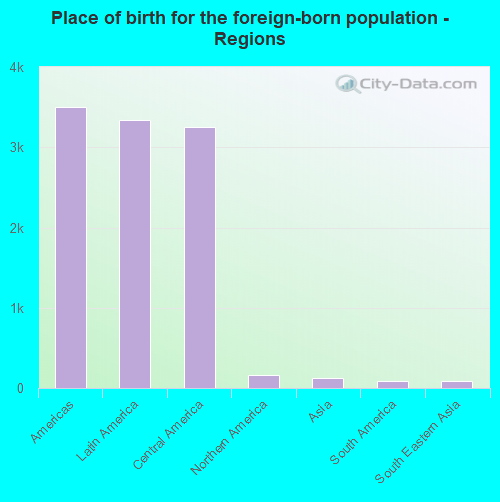
According to 2022 data, the most numerous races in Cornelius, OR are White alone (5,828 residents), Hispanic (6,589 residents), and Two or more races (480 residents). 54.5% of Cornelius residents speak English at home. 27.6% of Cornelius, OR residents are foreign-born (24.8% born in Latin America), which is 67.4% greater than the foreign-born rate of 9.0% across the entire state of Oregon.
Race distribution in Cornelius
2000 2022
2,857,616 83.5% White alone 275,314 8.0% Hispanic 100,333 2.9% Asian alone 82,733 2.4% Two or more races 53,325 1.6% Black alone 40,130 1.2% American Indian alone 7,398 0.2% Native Hawaiian and Other 4,550 0.1% Other race alone
3,037,571 71.6% White alone 609,538 14.4% Hispanic 252,744 6.0% Two or more races 191,283 4.5% Asian alone 78,228 1.8% Black alone 29,399 0.7% American Indian alone 25,731 0.6% Other race alone 15,643 0.4% Native Hawaiian and Other
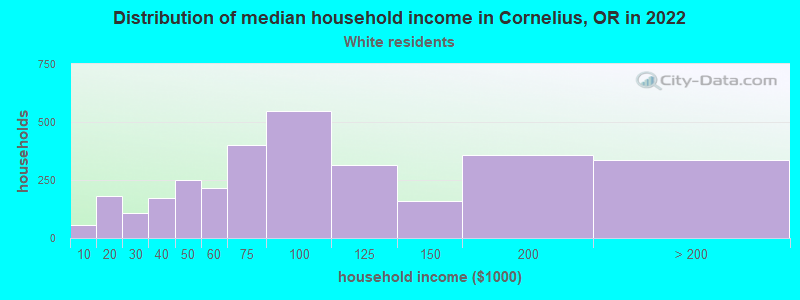
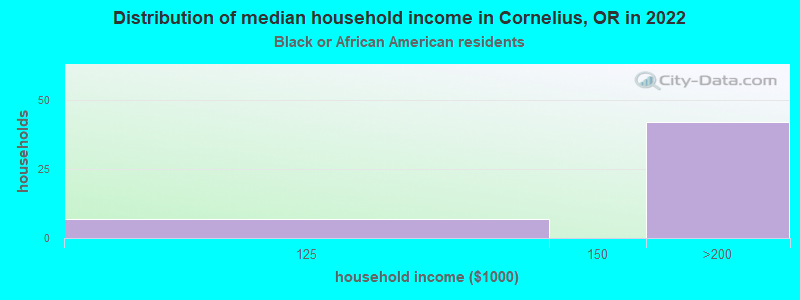
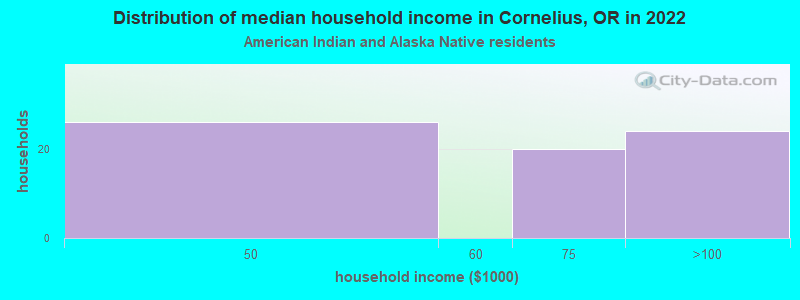
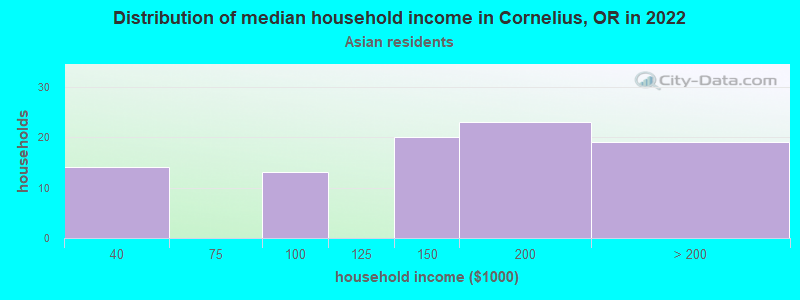
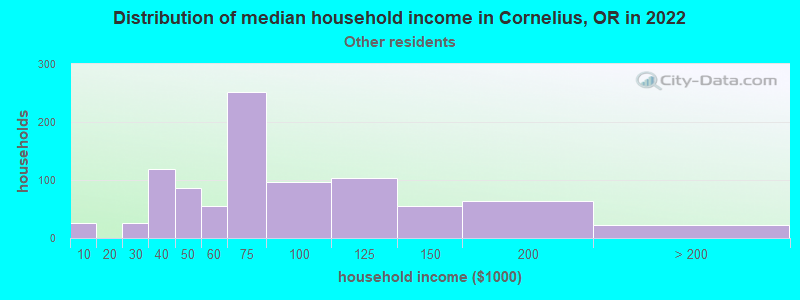
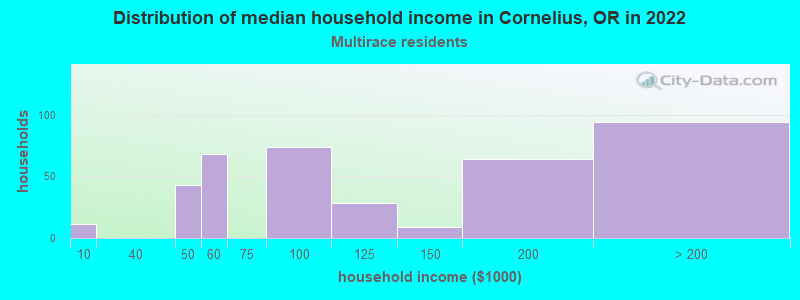
Income and house value in Cornelius Median household income in 2022 $89,004 White non-Hispanic householders$70,091 American Indian and Alaska Native householders$132,581 Asian householders$72,855 Some other race householders$112,117 Two or more races householders$67,147 Hispanic or Latino race householdersMedian 2022 house value $458,606 White Non-Hispanic householders$279,037 Black or African American householders$369,314 American Indian or Alaska Native householders $377,521 Asian householders$460,247 Some other race householders$489,792 Two or more races householders$456,964 Hispanic or Latino householders
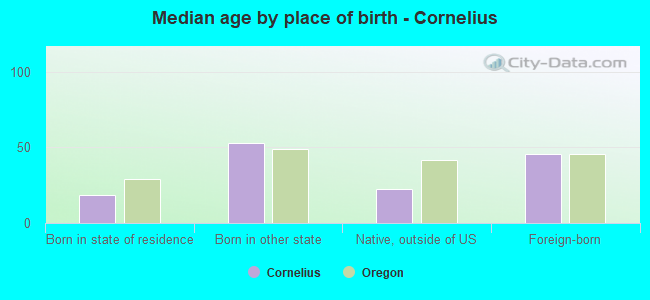
Median age by race in Cornelius
45.9 Median age for White residents45.9 46.0 24.8 Median age for Black or African American residents-707,566,461.5 18.3 51.4 Median age for American Indian / Alaska Native residents58.2 40.4 36.4 Median age for Asian residents40.3 26.5 -642,169,728.1 Median age for Native Hawaiian / Pacific Islander residents-476,923,076.4 -850,649,349.8 24.5 Median age for Other race residents26.8 17.1 26.7 Median age for Two or more races residents35.5 23.9 49.0 Median age for White alone residents47.3 51.4 30.0 Median age for Hispanic or Latino residents34.1 23.4
Owner/renter occupied households by race in Cornelius
House owners and renters - White residents 2,388 76.0% Owner occupied756 24.0% Renter occupiedHouse owners and renters - Black or African American residents 29 100.0% Owner occupiedHouse owners and renters - American Indian / Alaska Native residents 90 88.1% Owner occupied12 11.9% Renter occupiedHouse owners and renters - Asian residents 92 100.0% Owner occupiedHouse owners and renters - Other race residents 536 56.6% Owner occupied411 43.4% Renter occupiedHouse owners and renters - Two or more races residents 293 85.0% Owner occupied52 15.0% Renter occupiedHouse owners and renters - White alone residents 2,054 78.9% Owner occupied550 21.1% Renter occupiedHouse owners and renters - Hispanic or Latino residents 992 62.0% Owner occupied607 38.0% Renter occupied
Language usage in Cornelius
English speakers - Total 54.5% of residents of Cornelius speak English at home.
45.1% of residents speak Spanish at home 3,125 54.3% Speak English very well2,625 45.7% Speak English less than very well2.3% of residents speak other language at home 189 63.6% Speak English very well108 36.4% Speak English less than very well
English speakers - Born in the United States 84.5% of residents of Cornelius speak English at home.
14.2% of residents speak Spanish at home 411 77.8% Speak English very well117 22.2% Speak English less than very well3.3% of residents speak other language at home 5 4.0% Speak English very well119 96.0% Speak English less than very well
English speakers - Native, born elsewhere 16.5% of residents of Cornelius speak English at home.
58.6% of residents speak Spanish at home 162 83.1% Speak English very well33 16.9% Speak English less than very well39.9% of residents speak other language at home 133 100.0% Speak English very well
English speakers - Foreign-born 11.0% of residents of Cornelius speak English at home.
90.7% of residents speak Spanish at home 1,078 32.5% Speak English very well2,235 67.5% Speak English less than very well3.2% of residents speak other language at home 81 69.8% Speak English very well35 30.2% Speak English less than very well
White (Caucasian) - Speak only English Native:
90.9% (5,615)Foreign-born:
14.6% (172)
White (Caucasian) - Speak another language Native:
8.7% (537)Foreign-born:
83.4% (980)
American Indian / Alaska Native - Speak only English Native:
34.3% (38)Foreign-born:
14.1% (21)
American Indian / Alaska Native - Speak another language Native:
56.6% (62)Foreign-born:
99.0% (148)
Asian - Speak only English Native:
38.0% (49)Foreign-born:
13.8% (15)
Asian - Speak another language Native:
64.2% (82)Foreign-born:
85.7% (91)
Other race - Speak only English Native:
19.2% (415)Foreign-born:
8.7% (169)
Other race - Speak another language Native:
81.8% (1,765)Foreign-born:
90.8% (1,760)
Two or more races - Speak only English Native:
48.2% (323)Foreign-born:
25.5% (85)
Two or more races - Speak another language Native:
55.2% (371)Foreign-born:
74.0% (246)
White alone - Speak only English Native:
98.8% (5,541)Foreign-born:
76.1% (113)
White alone - Speak another language Native:
0.7% (39)Foreign-born:
24.7% (37)
Hispanic or Latino - Speak only English Native:
17.9% (489)Foreign-born:
7.5% (282)
Hispanic or Latino - Speak another language Native:
86.0% (2,345)Foreign-born:
92.1% (3,465)
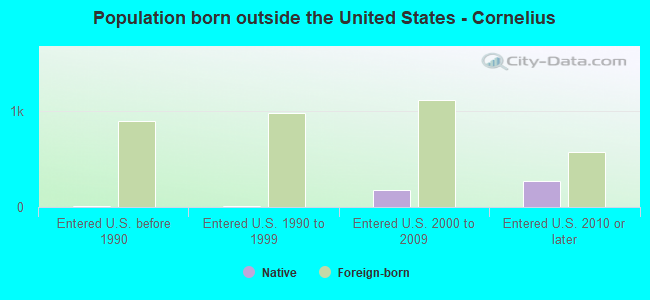
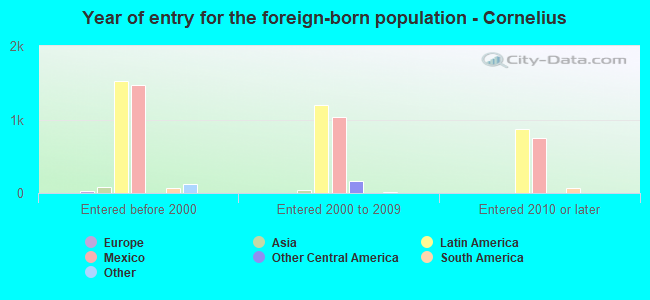
Foreign-born residents in Cornelius 3,657 residents are foreign born (24.8% Latin America ).
This city:
27.6%Oregon:
9.8%
Marital status for residents in Cornelius Marital status - White (Caucasian) population 15 years and over
Males 36.3% Never married50.0% Now married0.0% Separated2.7% Widowed10.9% DivorcedFemales 31.5% Never married45.6% Now married1.4% Separated4.8% Widowed16.6% DivorcedWomen who gave birth in the past 12 months Now married:
56.1% (54)Unmarried:
43.9% (43)
Women who did not give birth in the past 12 months Now married:
41.7% (788)Unmarried:
58.3% (1,100)
Marital status - Black or African American population 15 years and over
Males 64.8% Never married35.2% Now married0.0% Separated0.0% Widowed0.0% DivorcedFemales 89.1% Never married10.9% Now married0.0% Separated0.0% Widowed0.0% DivorcedWomen who did not give birth in the past 12 months Now married:
10.9% (6)Unmarried:
89.1% (52)
Marital status - American Indian / Alaska Native population 15 years and over
Males 67.9% Never married32.1% Now married0.0% Separated0.0% Widowed0.0% DivorcedFemales 32.1% Never married17.4% Now married20.2% Separated19.3% Widowed11.0% DivorcedWomen who did not give birth in the past 12 months Now married:
42.3% (45)Unmarried:
57.7% (61)
Marital status - Asian population 15 years and over
Males 27.8% Never married51.4% Now married0.0% Separated0.0% Widowed20.8% DivorcedFemales 49.2% Never married50.8% Now married0.0% Separated0.0% Widowed0.0% DivorcedWomen who did not give birth in the past 12 months Now married:
34.7% (36)Unmarried:
65.3% (68)
Marital status - Other race population 15 years and over
Males 57.4% Never married35.9% Now married0.0% Separated0.0% Widowed6.7% DivorcedFemales 45.6% Never married44.8% Now married1.7% Separated3.0% Widowed4.9% DivorcedWomen who did not give birth in the past 12 months Now married:
43.9% (419)Unmarried:
56.1% (535)
Marital status - Two or more races population 15 years and over
Males 37.2% Never married62.8% Now married0.0% Separated0.0% Widowed0.0% DivorcedFemales 19.5% Never married67.7% Now married0.0% Separated4.7% Widowed8.1% DivorcedWomen who gave birth in the past 12 months Now married:
100.0% (50)Unmarried:
0.0% (0)
Women who did not give birth in the past 12 months Now married:
53.9% (126)Unmarried:
46.1% (108)
Marital status - White alone, not Hispanic / Latino population 15 years and over
Males 34.6% Never married47.3% Now married0.0% Separated2.8% Widowed15.3% DivorcedFemales 26.5% Never married45.2% Now married1.9% Separated4.5% Widowed21.9% DivorcedWomen who gave birth in the past 12 months Now married:
52.5% (50)Unmarried:
47.5% (45)
Women who did not give birth in the past 12 months Now married:
44.3% (539)Unmarried:
55.7% (677)
Marital status - Hispanic or Latino population 15 years and over
Males 50.4% Never married45.6% Now married0.0% Separated1.0% Widowed3.1% DivorcedFemales 44.3% Never married46.1% Now married1.8% Separated4.8% Widowed3.1% DivorcedWomen who gave birth in the past 12 months Now married:
100.0% (8)Unmarried:
0.0% (0)
Women who did not give birth in the past 12 months Now married:
42.3% (767)Unmarried:
57.7% (1,048)
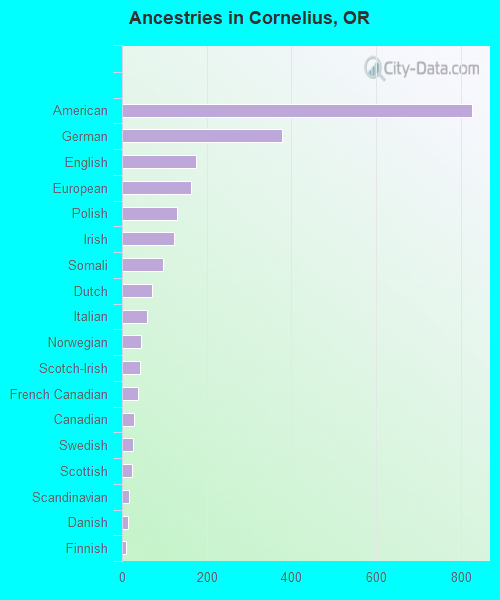
Ancestries in Cornelius
826 10.4% American377 4.7% German176 2.2% English164 2.1% European130 1.6% Polish124 1.6% Irish97 1.2% Somali70 0.9% Dutch58 0.7% Italian44 0.6% Norwegian43 0.5% Scotch-Irish38 0.5% French Canadian28 0.4% Canadian26 0.3% Swedish23 0.3% Scottish16 0.2% Scandinavian13 0.2% Danish9 0.1% Finnish7 0.09% Russian6 0.08% Belgian5 0.06% Romanian
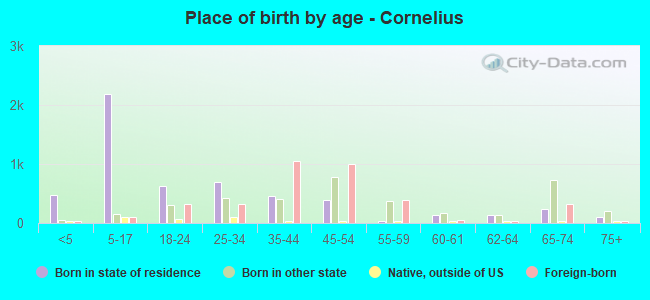
Children Nativity (place of birth) in Cornelius
Children under 6 years - Living with two parents Both parents native 202 100.0% NativeBoth parents foreign-born 107 100.0% NativeOne native, one foreign-born parent 51 100.0% NativeChildren under 6 years - Living with one parent Native parent 202 100.0% NativeForeign-born parent 44 100.0% NativeChildren 6 to 17 years - Living with two parents Both parents native 413 99.7% Native1 0.3% Foreign-bornBoth parents foreign-born 1,042 94.7% Native59 5.3% Foreign-bornOne native, one foreign-born parent 203 100.0% NativeChildren 6 to 17 years - Living with one parent Native parent 428 100.0% NativeForeign-born parent 316 54.6% Native263 45.4% Foreign-born
Grandparents responsible for own grandchildren in Cornelius
Grandparents (30 to 59 years) White / Caucasian 42 72.7% Responsible for grandchildren16 27.3% Not responsible for grandchildrenAmerican Indian / Alaska Native 6 100.0% Not responsible for grandchildrenAsian 16 100.0% Not responsible for grandchildrenOther race 29 100.0% Not responsible for grandchildrenWhite alone, not Hispanic / Latino 19 100.0% Not responsible for grandchildrenHispanic or Latino 46 69.3% Responsible for grandchildren21 30.7% Not responsible for grandchildrenGrandparents (60 years and over) White / Caucasian 37 21.1% Responsible for grandchildren139 78.9% Not responsible for grandchildrenOther race 29 43.2% Responsible for grandchildren38 56.8% Not responsible for grandchildrenWhite alone, not Hispanic / Latino 39 22.1% Responsible for grandchildren137 77.9% Not responsible for grandchildrenHispanic or Latino 17 22.1% Responsible for grandchildren61 77.9% Not responsible for grandchildren