Races in Cornwells Heights-Eddington, Pennsylvania (PA) Detailed Stats
Ancestries, Foreign-born residents, place of birth

Discuss Cornwells Heights-Eddington, Pennsylvania races on our local forum with over 2,400,000 registered users
4.2% of Cornwells Heights-Eddington, PA residents are foreign-born (3.6% born in Europe, 0.6% born in Asia), which is 65.6% less than the foreign-born rate of 7.0% across the entire state of Pennsylvania.
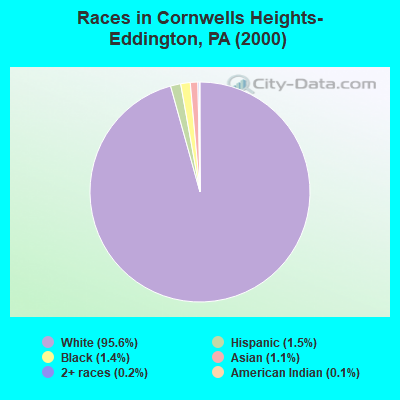
Race distribution in Cornwells Heights-Eddington

- 3,25695.6%White alone
- 521.5%Hispanic
- 471.4%Black alone
- 371.1%Asian alone
- 80.2%Two or more races
- 40.1%American Indian alone
- 10.03%Other race alone
- 10.03%Native Hawaiian and Other
Pacific Islander alone
2000
2022
-
- 10,322,45584.1%White alone
- 1,202,4379.8%Black alone
- 394,0883.2%Hispanic
- 218,2961.8%Asian alone
- 113,0970.9%Two or more races
- 13,0860.1%Other race alone
- 14,9040.1%American Indian alone
- 2,6910.02%Native Hawaiian and Other
Pacific Islander alone

-
- 9,487,22873.1%White alone
- 1,311,58110.1%Black alone
- 1,115,9978.6%Hispanic
- 493,9423.8%Two or more races
- 487,1243.8%Asian alone
- 63,5820.5%Other race alone
- 10,1300.08%American Indian alone
- 2,4240.02%Native Hawaiian and Other
Pacific Islander alone

Income and house value in Cornwells Heights-Eddington
- Median household income in 2022
- $88,892White non-Hispanic householders
- $99,721Asian householders
- $30,401Some other race householders
- $33,121Hispanic or Latino race householders
- Median 2022 house value
- $350,660White Non-Hispanic householders
- $363,071Hispanic or Latino householders
Household income for White non-Hispanic householders

Household income for Asian householders

Household income for Hispanic or Latino race householders

Foreign-born residents in Cornwells Heights-Eddington
144 residents are foreign born (3.6% Europe, 0.6% Asia).
| This city: | 4.2% |
| Pennsylvania: | 4.1% |
Ancestries in Cornwells Heights-Eddington

- 1,24828.2%Irish
- 88220.0%German
- 56112.7%Italian
- 48210.9%Polish
- 2966.7%English
- 2455.5%Other
- 1262.9%French
- 1152.6%Ukrainian
- 942.1%Scottish
- 922.1%United States
- 651.5%Scotch-Irish
- 491.1%Welsh
- 360.8%Dutch
- 310.7%Lithuanian
- 210.5%Greek
- 200.5%Hungarian
- 160.4%Danish
- 150.3%Swedish
- 70.2%Czech
- 70.2%French Canadian
- 70.2%Portuguese
- 50.1%Subsaharan African

Zip codes: 19020.