Races in Cortland, New York (NY) Detailed Stats
Data:
Races - White alone (%)
Races - White alone (% change since 2000)
Races - Black alone (%)
Races - Black alone (% change since 2000)
Races - American Indian alone (%)
Races - American Indian alone (% change since 2000)
Races - Asian alone (%)
Races - Asian alone (% change since 2000)
Races - Hispanic (%)
Races - Hispanic (% change since 2000)
Races - Native Hawaiian and Other Pacific Islander alone (%)
Races - Native Hawaiian and Other Pacific Islander alone (% change since 2000)
Races - Two or more races(%)
Races - Two or more races(% change since 2000)
Races - Other race alone (%)
Races - Other race alone (% change since 2000)
Racial diversity
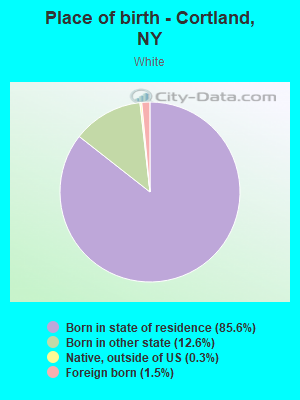
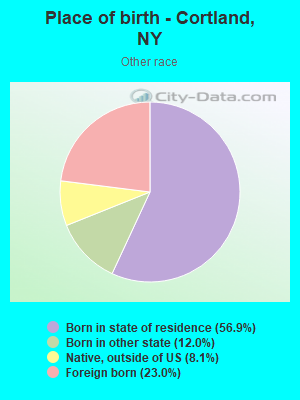
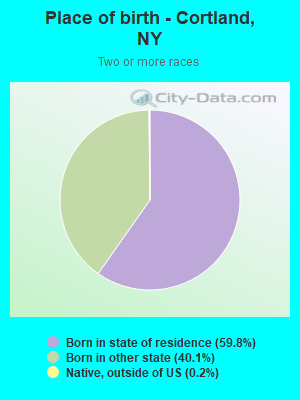
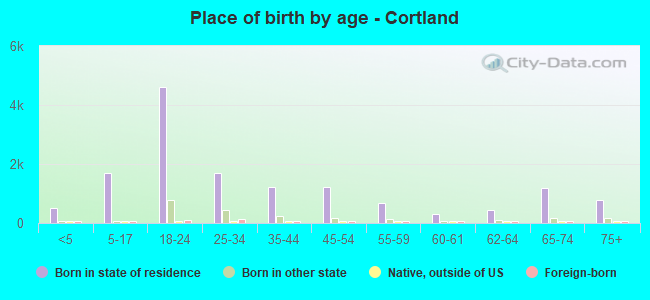
Place of birth - Born in state of residence (%)
Place of birth - Born in state of residence (%) - White
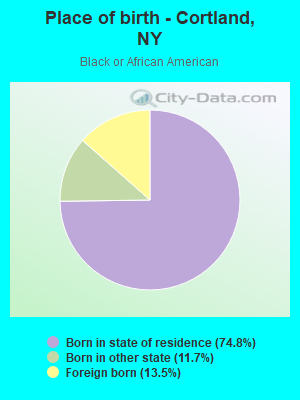
Place of birth - Born in state of residence (%) - Black or African American
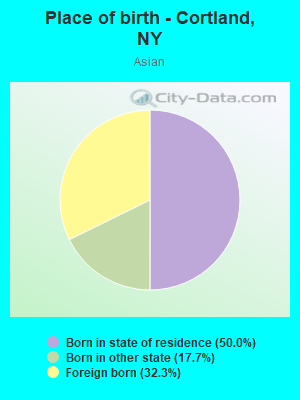
Place of birth - Born in state of residence (%) - Asian
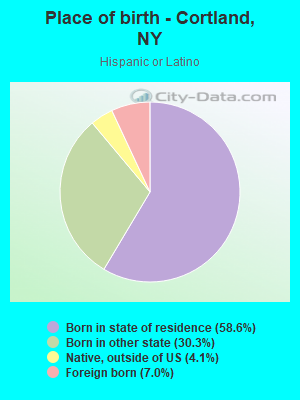
Place of birth - Born in state of residence (%) - Hispanic or Latino
Place of birth - Born in state of residence (%) - American Indian and Alaska Native
Place of birth - Born in state of residence (%) - Multirace
Place of birth - Born in state of residence (%) - Other Race
Place of birth - Born in other state (%)
Place of birth - Born in other state (%) - White
Place of birth - Born in other state (%) - Black or African American
Place of birth - Born in other state (%) - Asian
Place of birth - Born in other state (%) - Hispanic or Latino
Place of birth - Born in other state (%) - American Indian and Alaska Native
Place of birth - Born in other state (%) - Multirace
Place of birth - Born in other state (%) - Other Race
Place of birth - Native, outside of US (%)
Place of birth - Native, outside of US (%) - White
Place of birth - Native, outside of US (%) - Black or African American
Place of birth - Native, outside of US (%) - Asian
Place of birth - Native, outside of US (%) - Hispanic or Latino
Place of birth - Native, outside of US (%) - American Indian and Alaska Native
Place of birth - Native, outside of US (%) - Multirace
Place of birth - Native, outside of US (%) - Other Race
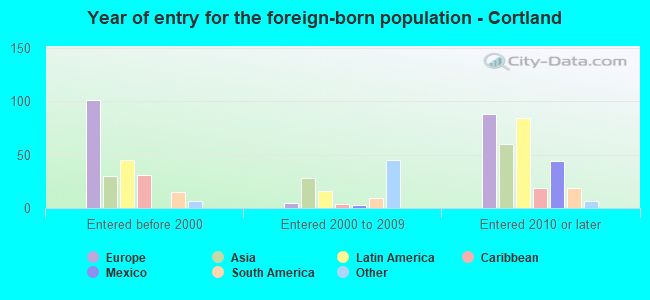
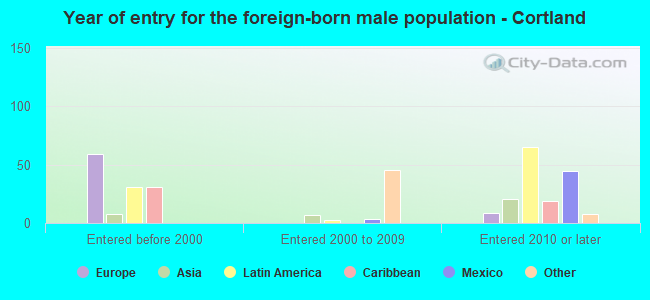
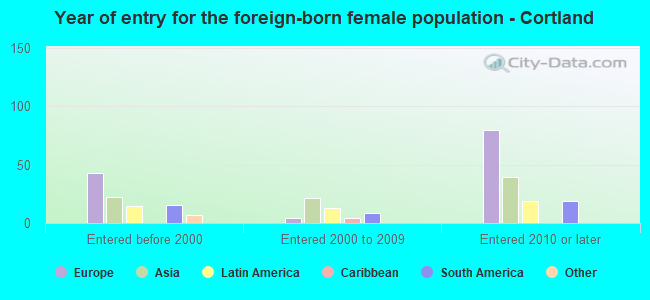
Place of birth - Foreign born (%)
Place of birth - Foreign born (%) - White
Place of birth - Foreign born (%) - Black or African American
Place of birth - Foreign born (%) - Asian
Place of birth - Foreign born (%) - Hispanic or Latino
Place of birth - Foreign born (%) - American Indian and Alaska Native
Place of birth - Foreign born (%) - Multirace
Place of birth - Foreign born (%) - Other Race
Residents speaking English at home (%)
Residents speaking English at home - Born in the United States (%)
Residents speaking English at home - Native, born elsewhere (%)
Residents speaking English at home - Foreign born (%)
Residents speaking Spanish at home (%)
Residents speaking Spanish at home - Born in the United States (%)
Residents speaking Spanish at home - Native, born elsewhere (%)
Residents speaking Spanish at home - Foreign born (%)
Residents speaking other language at home (%)
Residents speaking other language at home - Born in the United States (%)
Residents speaking other language at home - Native, born elsewhere (%)
Residents speaking other language at home - Foreign born (%)
Marital status - Never married (%)
Marital status - Now married (%)
Marital status - Separated (%)
Marital status - Widowed (%)
Marital status - Divorced (%)
Ancestries Reported - Arab (%)
Ancestries Reported - Czech (%)
Ancestries Reported - Danish (%)
Ancestries Reported - Dutch (%)
Ancestries Reported - English (%)
Ancestries Reported - French (%)
Ancestries Reported - French Canadian (%)
Ancestries Reported - German (%)
Ancestries Reported - Greek (%)
Ancestries Reported - Hungarian (%)
Ancestries Reported - Irish (%)
Ancestries Reported - Italian (%)
Ancestries Reported - Lithuanian (%)
Ancestries Reported - Norwegian (%)
Ancestries Reported - Polish (%)
Ancestries Reported - Portuguese (%)
Ancestries Reported - Russian (%)
Ancestries Reported - Scotch-Irish (%)
Ancestries Reported - Scottish (%)
Ancestries Reported - Slovak (%)
Ancestries Reported - Subsaharan African (%)
Ancestries Reported - Swedish (%)
Ancestries Reported - Swiss (%)
Ancestries Reported - Ukrainian (%)
Ancestries Reported - United States (%)
Ancestries Reported - Welsh (%)
Ancestries Reported - West Indian (%)
Ancestries Reported - Other (%)
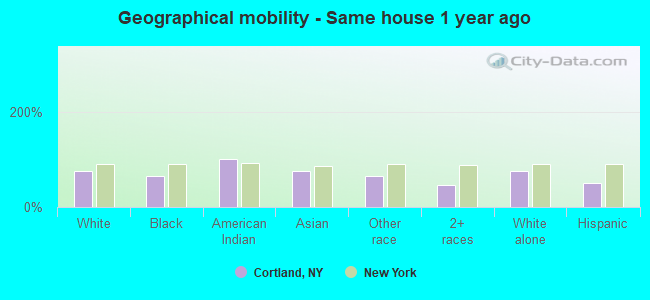
Geographical mobility - Same house 1 year ago (%)
Geographical mobility - Same house 1 year ago (%) - White
Geographical mobility - Same house 1 year ago (%) - Black or African American
Geographical mobility - Same house 1 year ago (%) - Asian
Geographical mobility - Same house 1 year ago (%) - Hispanic or Latino
Geographical mobility - Same house 1 year ago (%) - American Indian and Alaska Native
Geographical mobility - Same house 1 year ago (%) - Multirace
Geographical mobility - Same house 1 year ago (%) - Other Race
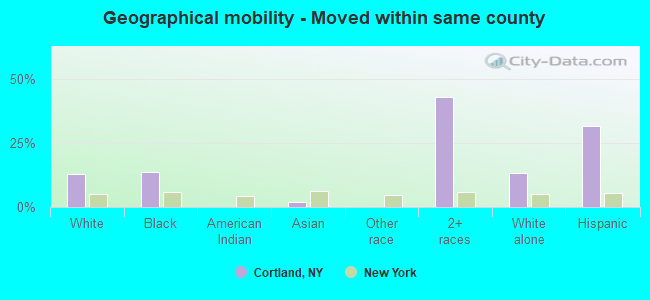
Geographical mobility - Moved within same county (%)
Geographical mobility - Moved within same county (%) - White
Geographical mobility - Moved within same county (%) - Black or African American
Geographical mobility - Moved within same county (%) - Asian
Geographical mobility - Moved within same county (%) - Hispanic or Latino
Geographical mobility - Moved within same county (%) - American Indian and Alaska Native
Geographical mobility - Moved within same county (%) - Multirace
Geographical mobility - Moved within same county (%) - Other Race
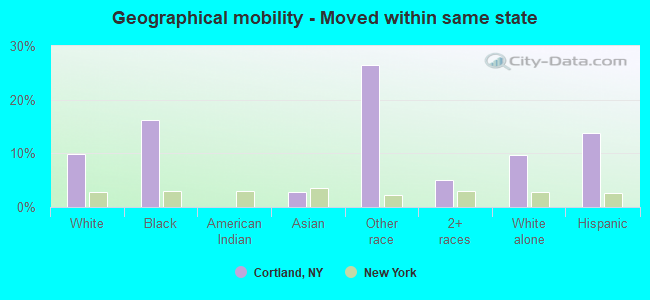
Geographical mobility - Moved from different county within same state (%)
Geographical mobility - Moved from different county within same state (%) - White
Geographical mobility - Moved from different county within same state (%) - Black or African American
Geographical mobility - Moved from different county within same state (%) - Asian
Geographical mobility - Moved from different county within same state (%) - Hispanic or Latino
Geographical mobility - Moved from different county within same state (%) - American Indian and Alaska Native
Geographical mobility - Moved from different county within same state (%) - Multirace
Geographical mobility - Moved from different county within same state (%) - Other Race
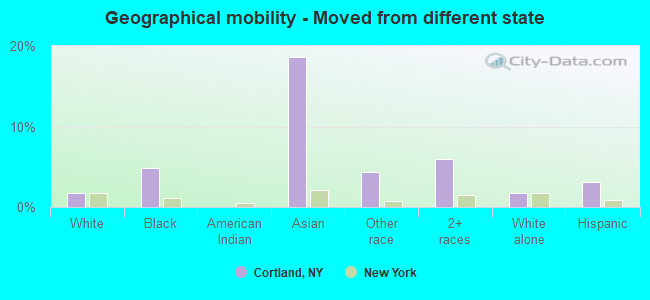
Geographical mobility - Moved from different state (%)
Geographical mobility - Moved from different state (%) - White
Geographical mobility - Moved from different state (%) - Black or African American
Geographical mobility - Moved from different state (%) - Asian
Geographical mobility - Moved from different state (%) - Hispanic or Latino
Geographical mobility - Moved from different state (%) - American Indian and Alaska Native
Geographical mobility - Moved from different state (%) - Multirace
Geographical mobility - Moved from different state (%) - Other Race
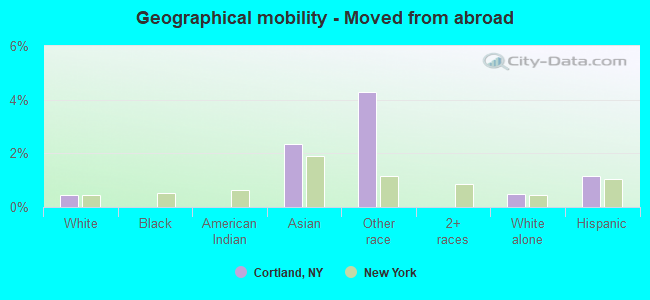
Geographical mobility - Moved from abroad (%)
Geographical mobility - Moved from abroad (%) - White
Geographical mobility - Moved from abroad (%) - Black or African American
Geographical mobility - Moved from abroad (%) - Asian
Geographical mobility - Moved from abroad (%) - Hispanic or Latino
Geographical mobility - Moved from abroad (%) - American Indian and Alaska Native
Geographical mobility - Moved from abroad (%) - Multirace
Geographical mobility - Moved from abroad (%) - Other Race
Place of birth for the foreign-born population - Ireland (%)
Place of birth for the foreign-born population - Denmark (%)
Place of birth for the foreign-born population - Norway (%)
Place of birth for the foreign-born population - Sweden (%)
Place of birth for the foreign-born population - United Kingdom (%)
Place of birth for the foreign-born population - England (%)
Place of birth for the foreign-born population - Scotland (%)
Place of birth for the foreign-born population - Other Northern Europe (%)
Place of birth for the foreign-born population - Austria (%)
Place of birth for the foreign-born population - Belgium (%)
Place of birth for the foreign-born population - France (%)
Place of birth for the foreign-born population - Germany (%)
Place of birth for the foreign-born population - Netherlands (%)
Place of birth for the foreign-born population - Switzerland (%)
Place of birth for the foreign-born population - Other Western Europe (%)
Place of birth for the foreign-born population - Greece (%)
Place of birth for the foreign-born population - Italy (%)
Place of birth for the foreign-born population - Portugal (%)
Place of birth for the foreign-born population - Spain (%)
Place of birth for the foreign-born population - Other Southern Europe (%)
Place of birth for the foreign-born population - Albania (%)
Place of birth for the foreign-born population - Belarus (%)
Place of birth for the foreign-born population - Bosnia and Herzegovina (%)
Place of birth for the foreign-born population - Bulgaria (%)
Place of birth for the foreign-born population - Croatia (%)
Place of birth for the foreign-born population - Czechoslovakia (%)
Place of birth for the foreign-born population - Hungary (%)
Place of birth for the foreign-born population - Latvia (%)
Place of birth for the foreign-born population - Lithuania (%)
Place of birth for the foreign-born population - North Macedonia (Macedonia) (%)
Place of birth for the foreign-born population - Moldova (%)
Place of birth for the foreign-born population - Poland (%)
Place of birth for the foreign-born population - Romania (%)
Place of birth for the foreign-born population - Russia (%)
Place of birth for the foreign-born population - Serbia (%)
Place of birth for the foreign-born population - Ukraine (%)
Place of birth for the foreign-born population - Other Eastern Europe (%)
Place of birth for the foreign-born population - China (%)
Place of birth for the foreign-born population - Hong Kong (%)
Place of birth for the foreign-born population - Taiwan (%)
Place of birth for the foreign-born population - Japan (%)
Place of birth for the foreign-born population - Korea (%)
Place of birth for the foreign-born population - Other Eastern Asia (%)
Place of birth for the foreign-born population - Afghanistan (%)
Place of birth for the foreign-born population - Bangladesh (%)
Place of birth for the foreign-born population - India (%)
Place of birth for the foreign-born population - Iran (%)
Place of birth for the foreign-born population - Kazakhstan (%)
Place of birth for the foreign-born population - Nepal (%)
Place of birth for the foreign-born population - Pakistan (%)
Place of birth for the foreign-born population - Sri Lanka (%)
Place of birth for the foreign-born population - Uzbekistan (%)
Place of birth for the foreign-born population - Other South Central Asia (%)
Place of birth for the foreign-born population - Burma (%)
Place of birth for the foreign-born population - Cambodia (%)
Place of birth for the foreign-born population - Indonesia (%)
Place of birth for the foreign-born population - Laos (%)
Place of birth for the foreign-born population - Malaysia (%)
Place of birth for the foreign-born population - Philippines (%)
Place of birth for the foreign-born population - Singapore (%)
Place of birth for the foreign-born population - Thailand (%)
Place of birth for the foreign-born population - Vietnam (%)
Place of birth for the foreign-born population - Other South Eastern Asia (%)
Place of birth for the foreign-born population - Armenia (%)
Place of birth for the foreign-born population - Iraq (%)
Place of birth for the foreign-born population - Israel (%)
Place of birth for the foreign-born population - Jordan (%)
Place of birth for the foreign-born population - Kuwait (%)
Place of birth for the foreign-born population - Lebanon (%)
Place of birth for the foreign-born population - Saudi Arabia (%)
Place of birth for the foreign-born population - Syria (%)
Place of birth for the foreign-born population - Turkey (%)
Place of birth for the foreign-born population - Yemen (%)
Place of birth for the foreign-born population - Other Western Asia (%)
Place of birth for the foreign-born population - Eritrea (%)
Place of birth for the foreign-born population - Ethiopia (%)
Place of birth for the foreign-born population - Kenya (%)
Place of birth for the foreign-born population - Somalia (%)
Place of birth for the foreign-born population - Uganda (%)
Place of birth for the foreign-born population - Zimbabwe (%)
Place of birth for the foreign-born population - Other Eastern Africa (%)
Place of birth for the foreign-born population - Cameroon (%)
Place of birth for the foreign-born population - Congo (%)
Place of birth for the foreign-born population - Democratic Republic of Congo (Zaire) (%)
Place of birth for the foreign-born population - Other Middle Africa (%)
Place of birth for the foreign-born population - Egypt (%)
Place of birth for the foreign-born population - Morocco (%)
Place of birth for the foreign-born population - Sudan (%)
Place of birth for the foreign-born population - Other Northern Africa (%)
Place of birth for the foreign-born population - South Africa (%)
Place of birth for the foreign-born population - Other Southern Africa (%)
Place of birth for the foreign-born population - Cabo Verde (%)
Place of birth for the foreign-born population - Ghana (%)
Place of birth for the foreign-born population - Liberia (%)
Place of birth for the foreign-born population - Nigeria (%)
Place of birth for the foreign-born population - Senegal (%)
Place of birth for the foreign-born population - Sierra Leone (%)
Place of birth for the foreign-born population - Other Western Africa (%)
Place of birth for the foreign-born population - Australia (%)
Place of birth for the foreign-born population - New Zealand (%)
Place of birth for the foreign-born population - Fiji (%)
Place of birth for the foreign-born population - Micronesia (%)
Place of birth for the foreign-born population - Bahamas (%)
Place of birth for the foreign-born population - Barbados (%)
Place of birth for the foreign-born population - Cuba (%)
Place of birth for the foreign-born population - Dominica (%)
Place of birth for the foreign-born population - Dominican Republic (%)
Place of birth for the foreign-born population - Grenada (%)
Place of birth for the foreign-born population - Haiti (%)
Place of birth for the foreign-born population - Jamaica (%)
Place of birth for the foreign-born population - St. Vincent and the Grenadines (%)
Place of birth for the foreign-born population - Trinidad and Tobago (%)
Place of birth for the foreign-born population - West Indies (%)
Place of birth for the foreign-born population - Other Caribbean (%)
Place of birth for the foreign-born population - Belize (%)
Place of birth for the foreign-born population - Costa Rica (%)
Place of birth for the foreign-born population - El Salvador (%)
Place of birth for the foreign-born population - Guatemala (%)
Place of birth for the foreign-born population - Honduras (%)
Place of birth for the foreign-born population - Mexico (%)
Place of birth for the foreign-born population - Nicaragua (%)
Place of birth for the foreign-born population - Panama (%)
Place of birth for the foreign-born population - Other Central America (%)
Place of birth for the foreign-born population - Argentina (%)
Place of birth for the foreign-born population - Bolivia (%)
Place of birth for the foreign-born population - Brazil (%)
Place of birth for the foreign-born population - Chile (%)
Place of birth for the foreign-born population - Colombia (%)
Place of birth for the foreign-born population - Ecuador (%)
Place of birth for the foreign-born population - Guyana (%)
Place of birth for the foreign-born population - Peru (%)
Place of birth for the foreign-born population - Uruguay (%)
Place of birth for the foreign-born population - Venezuela (%)
Place of birth for the foreign-born population - Other South America (%)
Place of birth for the foreign-born population - Canada (%)
Place of birth for the foreign-born population - Other Northern America (%)
Place of birth for the foreign-born population - Other (%)
Latest news about races in Cortland, NY collected exclusively by city-data.com from local newspapers, TV, and radio stations
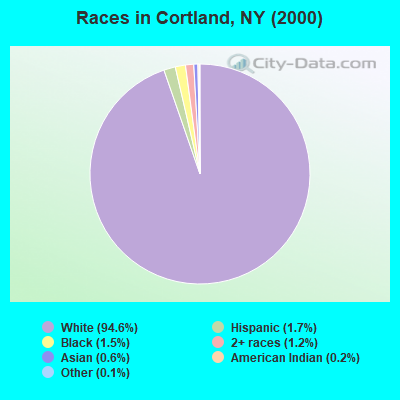
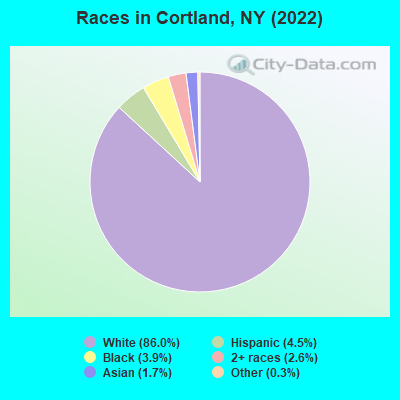
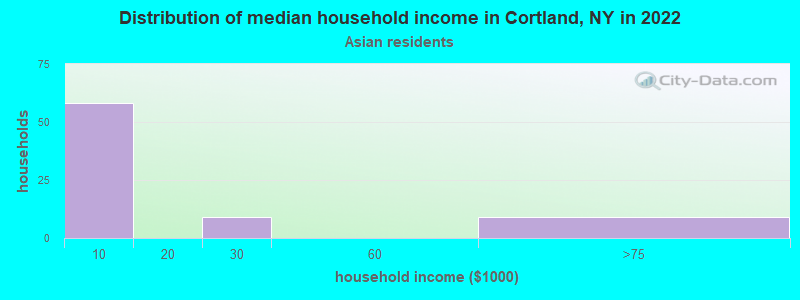
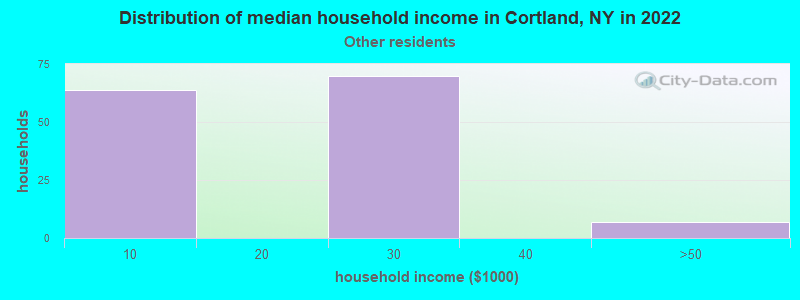
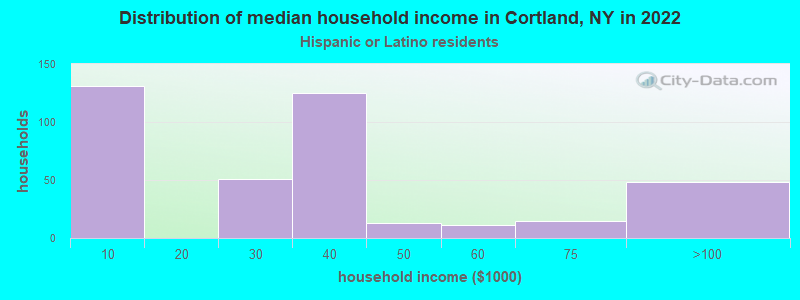
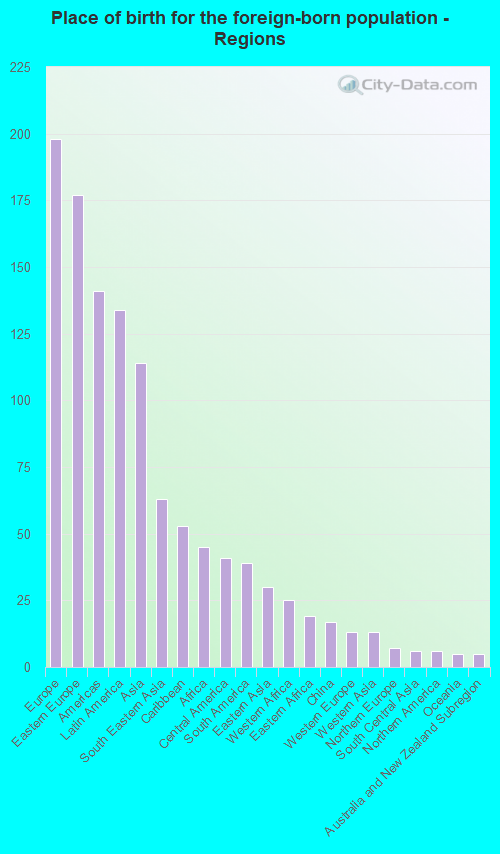
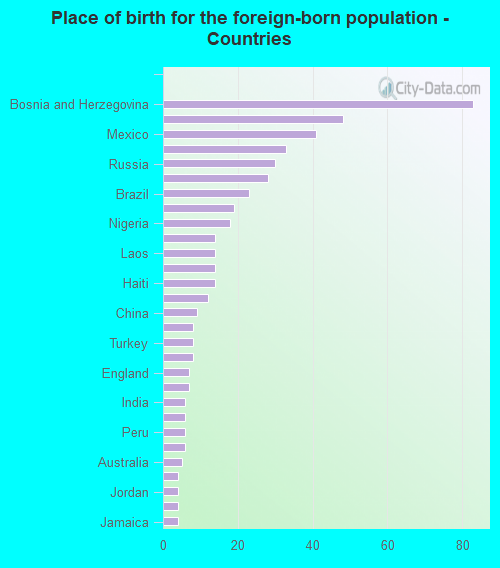
According to 2022 data, the most numerous races in Cortland, NY are White alone (14,881 residents), Hispanic (779 residents), and Black alone (666 residents). 94.4% of Cortland residents speak English at home. 2.9% of Cortland, NY residents are foreign-born (1.1% born in Europe, 0.8% born in Latin America, 0.7% born in Asia), which is 652.0% less than the foreign-born rate of 22.0% across the entire state of New York.
Race distribution in Cortland
2000 2022
11,760,981 62.0% White alone 2,867,583 15.1% Hispanic 2,812,623 14.8% Black alone 1,035,926 5.5% Asian alone 366,116 1.9% Two or more races 75,499 0.4% Other race alone 52,499 0.3% American Indian alone 5,230 0.03% Native Hawaiian and Other
10,408,933 52.9% White alone 3,867,299 19.7% Hispanic 2,633,840 13.4% Black alone 1,776,286 9.0% Asian alone 732,670 3.7% Two or more races 216,110 1.1% Other race alone 35,082 0.2% American Indian alone 6,931 0.04% Native Hawaiian and Other
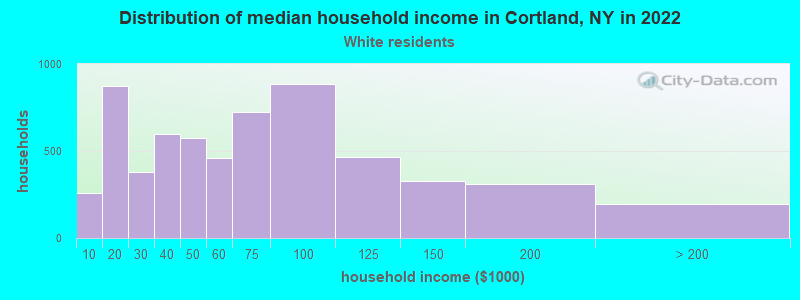
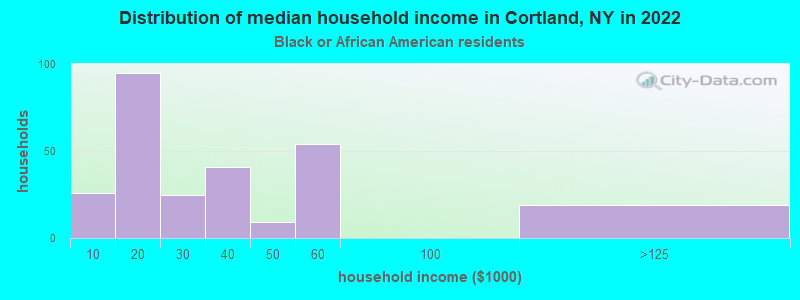
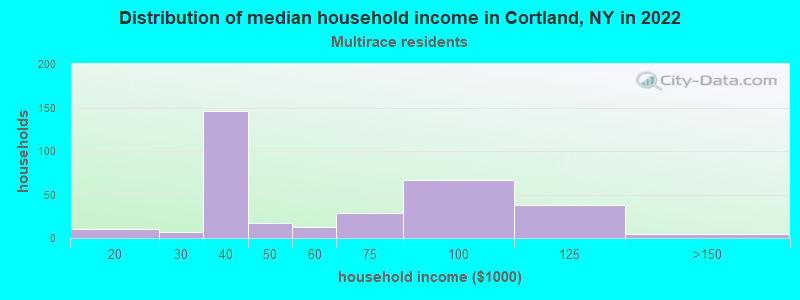
Income and house value in Cortland Median household income in 2022 $56,582 White non-Hispanic householders$28,257 Black householders$2,463 Asian householders$35,128 Hispanic or Latino race householdersMedian 2022 house value $136,367 White Non-Hispanic householders$163,256 Black or African American householders$124,843 American Indian or Alaska Native householders$112,550 Hispanic or Latino householders
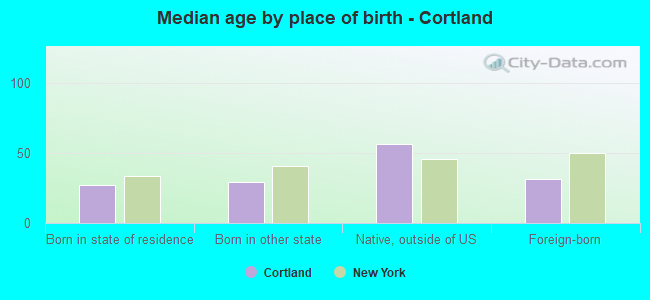
Median age by race in Cortland
29.1 Median age for White residents30.2 28.1 23.9 Median age for Black or African American residents34.9 21.2 -676,300,577.4 Median age for American Indian / Alaska Native residents-707,843,136.5 -642,115,202.4 20.7 Median age for Asian residents20.1 21.1 -487,992,314.6 Median age for Native Hawaiian / Pacific Islander residents-477,502,295.2 -497,387,669.3 21.8 Median age for Other race residents31.2 20.4 26.8 Median age for Two or more races residents23.1 28.2 29.4 Median age for White alone residents30.1 27.9 21.4 Median age for Hispanic or Latino residents22.4 20.9
Owner/renter occupied households by race in Cortland
House owners and renters - White residents 2,825 47.2% Owner occupied3,165 52.8% Renter occupiedHouse owners and renters - Black or African American residents 82 29.5% Owner occupied197 70.5% Renter occupiedHouse owners and renters - American Indian / Alaska Native residents 19 100.0% Renter occupiedHouse owners and renters - Asian residents 26 40.8% Owner occupied38 59.2% Renter occupiedHouse owners and renters - Other race residents 8 6.0% Owner occupied123 94.0% Renter occupiedHouse owners and renters - Two or more races residents 106 31.7% Owner occupied228 68.3% Renter occupiedHouse owners and renters - White alone residents 2,856 46.4% Owner occupied3,300 53.6% Renter occupiedHouse owners and renters - Hispanic or Latino residents 38 10.5% Owner occupied322 89.5% Renter occupied
Language usage in Cortland
English speakers - Total 94.4% of residents of Cortland speak English at home.
1.0% of residents speak Spanish at home 147 90.2% Speak English very well16 9.8% Speak English less than very well4.5% of residents speak other language at home 473 62.9% Speak English very well279 37.1% Speak English less than very well
English speakers - Born in the United States 93.0% of residents of Cortland speak English at home.
1.6% of residents speak Spanish at home 37 100.0% Speak English very well5.6% of residents speak other language at home 114 89.8% Speak English very well13 10.2% Speak English less than very well
English speakers - Native, born elsewhere 58.8% of residents of Cortland speak English at home.
20.6% of residents speak Spanish at home 14 70.0% Speak English very well6 30.0% Speak English less than very well23.7% of residents speak other language at home 23 100.0% Speak English very well
English speakers - Foreign-born 36.8% of residents of Cortland speak English at home.
3.2% of residents speak Spanish at home 13 81.2% Speak English very well3 18.8% Speak English less than very well59.3% of residents speak other language at home 180 60.0% Speak English very well120 40.0% Speak English less than very well
White (Caucasian) - Speak only English Native:
99.9% (14,019)Foreign-born:
24.4% (52)
White (Caucasian) - Speak another language Native:
1.6% (223)Foreign-born:
75.3% (161)
Black or African American - Speak only English Native:
95.9% (548)Foreign-born:
62.6% (56)
Black or African American - Speak another language Native:
4.4% (25)Foreign-born:
37.1% (33)
Asian - Speak only English Native:
51.0% (104)Foreign-born:
34.8% (33)
Asian - Speak another language Native:
49.1% (100)Foreign-born:
63.2% (61)
Other race - Speak only English Native:
92.5% (173)Foreign-born:
78.1% (44)
Other race - Speak another language Native:
15.9% (30)Foreign-born:
23.5% (13)
White alone - Speak only English Native:
98.5% (14,033)Foreign-born:
21.6% (54)
White alone - Speak another language Native:
1.6% (233)Foreign-born:
78.3% (196)
Hispanic or Latino - Speak only English Native:
71.8% (456)Foreign-born:
75.9% (41)
Hispanic or Latino - Speak another language Native:
30.6% (194)Foreign-born:
27.7% (15)
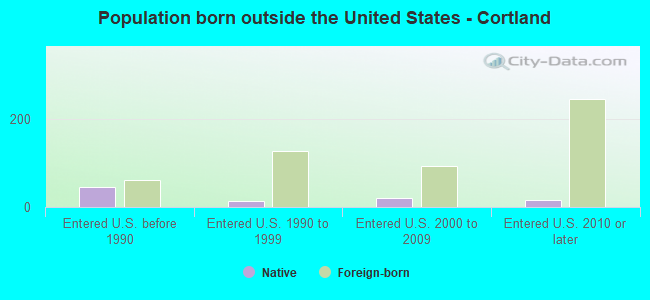
Foreign-born residents in Cortland 506 residents are foreign born (1.1% Europe , 0.8% Latin America , 0.7% Asia ).
This city:
2.9%New York:
22.6%
Marital status for residents in Cortland Marital status - White (Caucasian) population 15 years and over
Males 55.3% Never married30.4% Now married2.3% Separated2.7% Widowed9.3% DivorcedFemales 52.6% Never married26.3% Now married2.5% Separated6.4% Widowed12.2% DivorcedWomen who gave birth in the past 12 months Now married:
60.6% (78)Unmarried:
39.4% (51)
Women who did not give birth in the past 12 months Now married:
21.1% (927)Unmarried:
78.9% (3,466)
Marital status - Black or African American population 15 years and over
Males 67.7% Never married5.5% Now married16.1% Separated2.3% Widowed8.4% DivorcedFemales 98.6% Never married0.0% Now married0.0% Separated1.4% Widowed0.0% DivorcedWomen who did not give birth in the past 12 months Now married:
0.0% (0)Unmarried:
100.0% (240)
Marital status - Asian population 15 years and over
Males 91.1% Never married8.9% Now married0.0% Separated0.0% Widowed0.0% DivorcedFemales 88.4% Never married11.6% Now married0.0% Separated0.0% Widowed0.0% DivorcedWomen who did not give birth in the past 12 months Now married:
5.5% (8)Unmarried:
94.5% (137)
Marital status - Other race population 15 years and over
Males 90.0% Never married0.0% Now married0.0% Separated0.0% Widowed10.0% DivorcedFemales 80.2% Never married0.0% Now married0.0% Separated12.8% Widowed7.0% DivorcedWomen who did not give birth in the past 12 months Now married:
0.0% (0)Unmarried:
100.0% (76)
Marital status - Two or more races population 15 years and over
Males 50.2% Never married48.1% Now married0.0% Separated1.7% Widowed0.0% DivorcedFemales 56.2% Never married34.6% Now married1.9% Separated0.0% Widowed7.2% DivorcedWomen who gave birth in the past 12 months Now married:
100.0% (5)Unmarried:
0.0% (0)
Women who did not give birth in the past 12 months Now married:
24.5% (50)Unmarried:
75.5% (154)
Marital status - White alone, not Hispanic / Latino population 15 years and over
Males 55.0% Never married30.7% Now married2.4% Separated2.5% Widowed9.4% DivorcedFemales 52.2% Never married26.4% Now married2.5% Separated6.5% Widowed12.3% DivorcedWomen who gave birth in the past 12 months Now married:
60.6% (82)Unmarried:
39.4% (53)
Women who did not give birth in the past 12 months Now married:
21.3% (966)Unmarried:
78.7% (3,577)
Marital status - Hispanic or Latino population 15 years and over
Males 66.5% Never married27.1% Now married0.0% Separated3.2% Widowed3.2% DivorcedFemales 89.7% Never married4.5% Now married0.0% Separated0.0% Widowed5.8% DivorcedWomen who did not give birth in the past 12 months Now married:
4.8% (11)Unmarried:
95.2% (212)
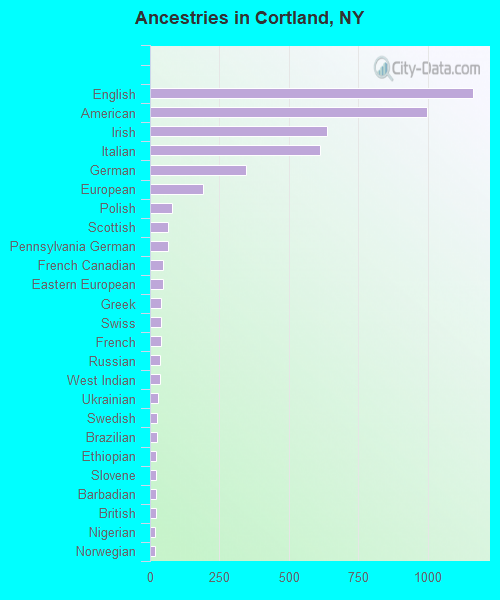
Ancestries in Cortland
1,162 21.5% English998 18.5% American638 11.8% Irish613 11.3% Italian347 6.4% German191 3.5% European78 1.4% Polish66 1.2% Scottish63 1.2% Pennsylvania German48 0.9% French Canadian46 0.9% Eastern European41 0.8% Greek41 0.8% Swiss38 0.7% French36 0.7% Russian35 0.6% West Indian28 0.5% Ukrainian24 0.4% Swedish24 0.4% Brazilian23 0.4% Ethiopian23 0.4% Slovene22 0.4% Barbadian20 0.4% British19 0.4% Nigerian19 0.4% Norwegian16 0.3% Scotch-Irish16 0.3% Dutch16 0.3% Hungarian14 0.3% Scandinavian12 0.2% Yugoslavian9 0.2% Turkish9 0.2% Iranian9 0.2% Finnish8 0.1% Slovak7 0.1% African7 0.1% Jamaican5 0.09% Northern European4 0.07% Czech3 0.06% Austrian3 0.06% Jordanian2 0.04% Canadian1 0.02% Haitian
Geographical mobility in Cortland Same house 1 year ago 10,781 74.8% White (Caucasian)438 66.5% Black or African American19 100.0% American Indian / Alaska Native221 75.7% Asian159 65.8% Other race424 46.5% Two or more races11,070 74.7% White alone, not Hispanic / Latino387 49.6% Hispanic or LatinoMoved within same county 1,874 13.0% White / Caucasian91 13.8% Black or African American6 2.1% Asian391 42.9% Two or more races1,943 13.1% White alone, not Hispanic / Latino248 31.8% Hispanic or LatinoMoved within same state 1,419 9.8% White / Caucasian107 16.3% Black or African American8 2.8% Asian64 26.5% Other race46 5.1% Two or more races1,445 9.7% White alone, not Hispanic / Latino107 13.7% Hispanic or LatinoMoved from different state 243 1.7% White / Caucasian32 4.9% Black or African American55 18.7% Asian11 4.3% Other race54 6.0% Two or more races254 1.7% White alone, not Hispanic / Latino24 3.1% Hispanic or LatinoMoved from abroad 63 0.4% White7 2.4% Asian10 4.3% Other race71 0.5% White alone, not Hispanic / Latino9 1.1% Hispanic or Latino
Children Nativity (place of birth) in Cortland
Children under 6 years - Living with two parents Both parents native 331 100.0% NativeBoth parents foreign-born 20 100.0% NativeOne native, one foreign-born parent 11 100.0% NativeChildren under 6 years - Living with one parent Native parent 293 100.0% NativeChildren 6 to 17 years - Living with two parents Both parents native 635 100.0% NativeOne native, one foreign-born parent 37 100.0% NativeChildren 6 to 17 years - Living with one parent Native parent 762 98.1% Native15 1.9% Foreign-bornForeign-born parent 51 63.0% Native30 37.0% Foreign-born
Grandparents responsible for own grandchildren in Cortland
Grandparents (30 to 59 years) White / Caucasian 66 51.8% Responsible for grandchildren61 48.2% Not responsible for grandchildrenWhite alone, not Hispanic / Latino 70 49.3% Responsible for grandchildren72 50.7% Not responsible for grandchildrenGrandparents (60 years and over) White / Caucasian 25 33.6% Responsible for grandchildren49 66.4% Not responsible for grandchildrenWhite alone, not Hispanic / Latino 27 33.8% Responsible for grandchildren52 66.2% Not responsible for grandchildren