Races in Cottage Lake, Washington (WA) Detailed Stats
Data:
Races - White alone (%)
Races - White alone (% change since 2000)
Races - Black alone (%)
Races - Black alone (% change since 2000)
Races - American Indian alone (%)
Races - American Indian alone (% change since 2000)
Races - Asian alone (%)
Races - Asian alone (% change since 2000)
Races - Hispanic (%)
Races - Hispanic (% change since 2000)
Races - Native Hawaiian and Other Pacific Islander alone (%)
Races - Native Hawaiian and Other Pacific Islander alone (% change since 2000)
Races - Two or more races(%)
Races - Two or more races(% change since 2000)
Races - Other race alone (%)
Races - Other race alone (% change since 2000)
Racial diversity
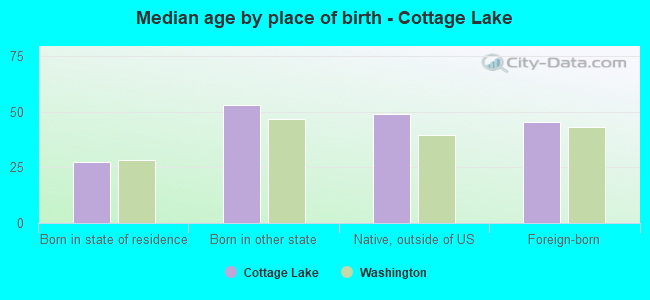
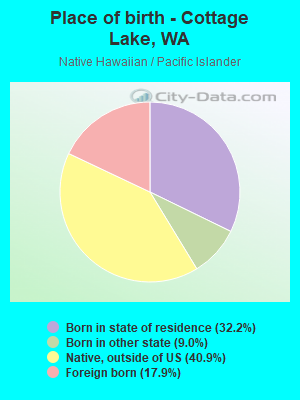
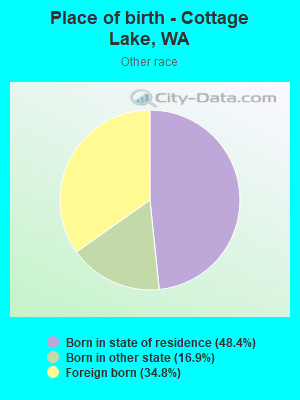
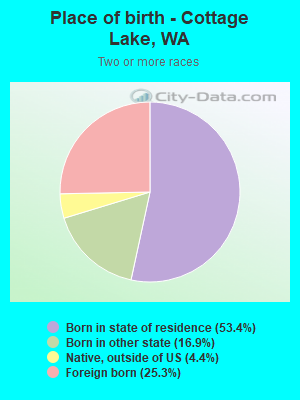
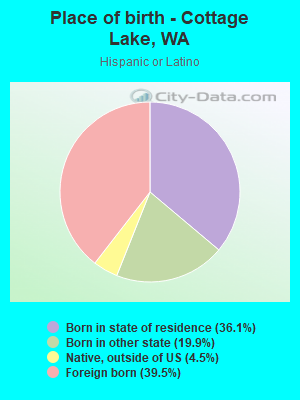
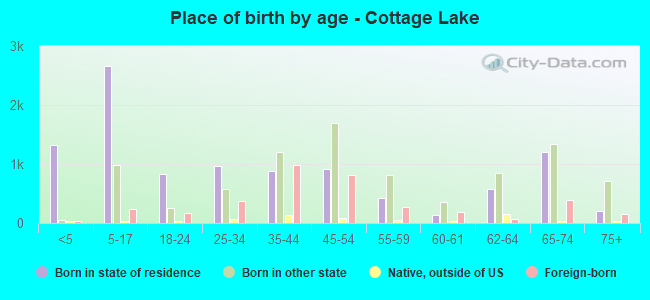
Place of birth - Born in state of residence (%)
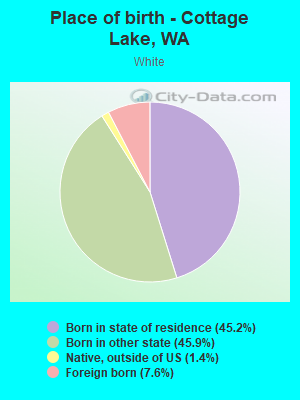
Place of birth - Born in state of residence (%) - White
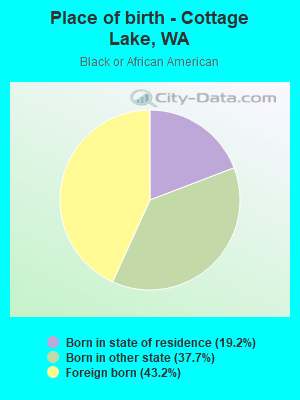
Place of birth - Born in state of residence (%) - Black or African American
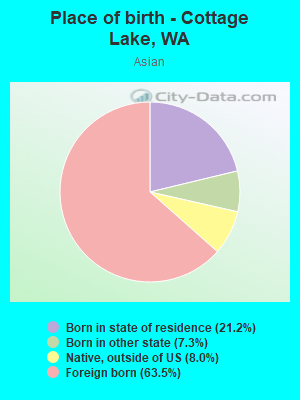
Place of birth - Born in state of residence (%) - Asian
Place of birth - Born in state of residence (%) - Hispanic or Latino
Place of birth - Born in state of residence (%) - American Indian and Alaska Native
Place of birth - Born in state of residence (%) - Multirace
Place of birth - Born in state of residence (%) - Other Race
Place of birth - Born in other state (%)
Place of birth - Born in other state (%) - White
Place of birth - Born in other state (%) - Black or African American
Place of birth - Born in other state (%) - Asian
Place of birth - Born in other state (%) - Hispanic or Latino
Place of birth - Born in other state (%) - American Indian and Alaska Native
Place of birth - Born in other state (%) - Multirace
Place of birth - Born in other state (%) - Other Race
Place of birth - Native, outside of US (%)
Place of birth - Native, outside of US (%) - White
Place of birth - Native, outside of US (%) - Black or African American
Place of birth - Native, outside of US (%) - Asian
Place of birth - Native, outside of US (%) - Hispanic or Latino
Place of birth - Native, outside of US (%) - American Indian and Alaska Native
Place of birth - Native, outside of US (%) - Multirace
Place of birth - Native, outside of US (%) - Other Race
Place of birth - Foreign born (%)
Place of birth - Foreign born (%) - White
Place of birth - Foreign born (%) - Black or African American
Place of birth - Foreign born (%) - Asian
Place of birth - Foreign born (%) - Hispanic or Latino
Place of birth - Foreign born (%) - American Indian and Alaska Native
Place of birth - Foreign born (%) - Multirace
Place of birth - Foreign born (%) - Other Race
Residents speaking English at home (%)
Residents speaking English at home - Born in the United States (%)
Residents speaking English at home - Native, born elsewhere (%)
Residents speaking English at home - Foreign born (%)
Residents speaking Spanish at home (%)
Residents speaking Spanish at home - Born in the United States (%)
Residents speaking Spanish at home - Native, born elsewhere (%)
Residents speaking Spanish at home - Foreign born (%)
Residents speaking other language at home (%)
Residents speaking other language at home - Born in the United States (%)
Residents speaking other language at home - Native, born elsewhere (%)
Residents speaking other language at home - Foreign born (%)
Marital status - Never married (%)
Marital status - Now married (%)
Marital status - Separated (%)
Marital status - Widowed (%)
Marital status - Divorced (%)
Ancestries Reported - Arab (%)
Ancestries Reported - Czech (%)
Ancestries Reported - Danish (%)
Ancestries Reported - Dutch (%)
Ancestries Reported - English (%)
Ancestries Reported - French (%)
Ancestries Reported - French Canadian (%)
Ancestries Reported - German (%)
Ancestries Reported - Greek (%)
Ancestries Reported - Hungarian (%)
Ancestries Reported - Irish (%)
Ancestries Reported - Italian (%)
Ancestries Reported - Lithuanian (%)
Ancestries Reported - Norwegian (%)
Ancestries Reported - Polish (%)
Ancestries Reported - Portuguese (%)
Ancestries Reported - Russian (%)
Ancestries Reported - Scotch-Irish (%)
Ancestries Reported - Scottish (%)
Ancestries Reported - Slovak (%)
Ancestries Reported - Subsaharan African (%)
Ancestries Reported - Swedish (%)
Ancestries Reported - Swiss (%)
Ancestries Reported - Ukrainian (%)
Ancestries Reported - United States (%)
Ancestries Reported - Welsh (%)
Ancestries Reported - West Indian (%)
Ancestries Reported - Other (%)
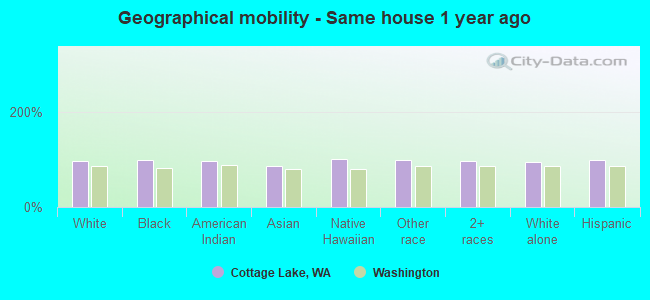
Geographical mobility - Same house 1 year ago (%)
Geographical mobility - Same house 1 year ago (%) - White
Geographical mobility - Same house 1 year ago (%) - Black or African American
Geographical mobility - Same house 1 year ago (%) - Asian
Geographical mobility - Same house 1 year ago (%) - Hispanic or Latino
Geographical mobility - Same house 1 year ago (%) - American Indian and Alaska Native
Geographical mobility - Same house 1 year ago (%) - Multirace
Geographical mobility - Same house 1 year ago (%) - Other Race
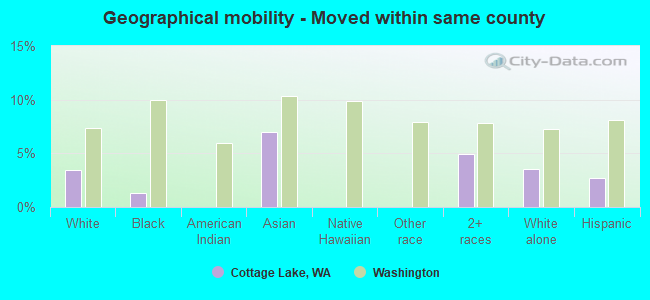
Geographical mobility - Moved within same county (%)
Geographical mobility - Moved within same county (%) - White
Geographical mobility - Moved within same county (%) - Black or African American
Geographical mobility - Moved within same county (%) - Asian
Geographical mobility - Moved within same county (%) - Hispanic or Latino
Geographical mobility - Moved within same county (%) - American Indian and Alaska Native
Geographical mobility - Moved within same county (%) - Multirace
Geographical mobility - Moved within same county (%) - Other Race
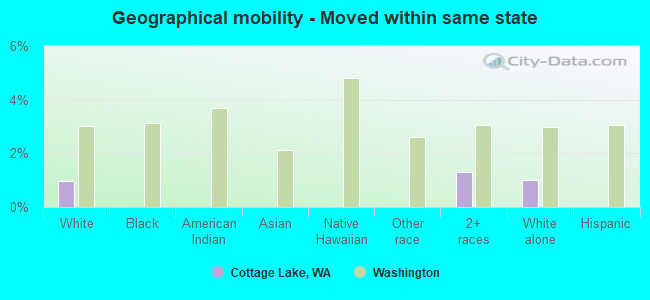
Geographical mobility - Moved from different county within same state (%)
Geographical mobility - Moved from different county within same state (%) - White
Geographical mobility - Moved from different county within same state (%) - Black or African American
Geographical mobility - Moved from different county within same state (%) - Asian
Geographical mobility - Moved from different county within same state (%) - Hispanic or Latino
Geographical mobility - Moved from different county within same state (%) - American Indian and Alaska Native
Geographical mobility - Moved from different county within same state (%) - Multirace
Geographical mobility - Moved from different county within same state (%) - Other Race
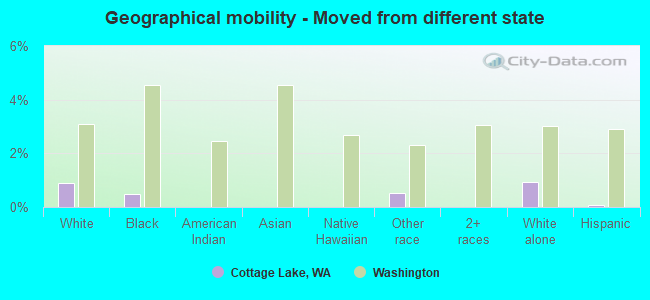
Geographical mobility - Moved from different state (%)
Geographical mobility - Moved from different state (%) - White
Geographical mobility - Moved from different state (%) - Black or African American
Geographical mobility - Moved from different state (%) - Asian
Geographical mobility - Moved from different state (%) - Hispanic or Latino
Geographical mobility - Moved from different state (%) - American Indian and Alaska Native
Geographical mobility - Moved from different state (%) - Multirace
Geographical mobility - Moved from different state (%) - Other Race
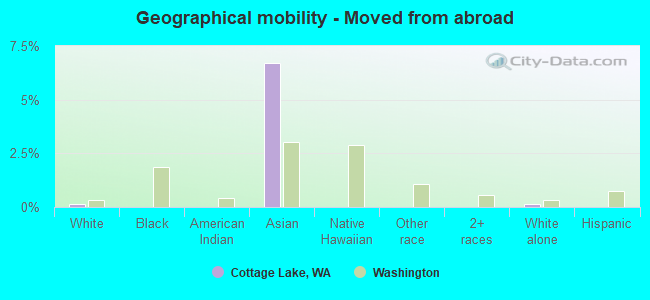
Geographical mobility - Moved from abroad (%)
Geographical mobility - Moved from abroad (%) - White
Geographical mobility - Moved from abroad (%) - Black or African American
Geographical mobility - Moved from abroad (%) - Asian
Geographical mobility - Moved from abroad (%) - Hispanic or Latino
Geographical mobility - Moved from abroad (%) - American Indian and Alaska Native
Geographical mobility - Moved from abroad (%) - Multirace
Geographical mobility - Moved from abroad (%) - Other Race
Place of birth for the foreign-born population - Ireland (%)
Place of birth for the foreign-born population - Denmark (%)
Place of birth for the foreign-born population - Norway (%)
Place of birth for the foreign-born population - Sweden (%)
Place of birth for the foreign-born population - United Kingdom (%)
Place of birth for the foreign-born population - England (%)
Place of birth for the foreign-born population - Scotland (%)
Place of birth for the foreign-born population - Other Northern Europe (%)
Place of birth for the foreign-born population - Austria (%)
Place of birth for the foreign-born population - Belgium (%)
Place of birth for the foreign-born population - France (%)
Place of birth for the foreign-born population - Germany (%)
Place of birth for the foreign-born population - Netherlands (%)
Place of birth for the foreign-born population - Switzerland (%)
Place of birth for the foreign-born population - Other Western Europe (%)
Place of birth for the foreign-born population - Greece (%)
Place of birth for the foreign-born population - Italy (%)
Place of birth for the foreign-born population - Portugal (%)
Place of birth for the foreign-born population - Spain (%)
Place of birth for the foreign-born population - Other Southern Europe (%)
Place of birth for the foreign-born population - Albania (%)
Place of birth for the foreign-born population - Belarus (%)
Place of birth for the foreign-born population - Bosnia and Herzegovina (%)
Place of birth for the foreign-born population - Bulgaria (%)
Place of birth for the foreign-born population - Croatia (%)
Place of birth for the foreign-born population - Czechoslovakia (%)
Place of birth for the foreign-born population - Hungary (%)
Place of birth for the foreign-born population - Latvia (%)
Place of birth for the foreign-born population - Lithuania (%)
Place of birth for the foreign-born population - North Macedonia (Macedonia) (%)
Place of birth for the foreign-born population - Moldova (%)
Place of birth for the foreign-born population - Poland (%)
Place of birth for the foreign-born population - Romania (%)
Place of birth for the foreign-born population - Russia (%)
Place of birth for the foreign-born population - Serbia (%)
Place of birth for the foreign-born population - Ukraine (%)
Place of birth for the foreign-born population - Other Eastern Europe (%)
Place of birth for the foreign-born population - China (%)
Place of birth for the foreign-born population - Hong Kong (%)
Place of birth for the foreign-born population - Taiwan (%)
Place of birth for the foreign-born population - Japan (%)
Place of birth for the foreign-born population - Korea (%)
Place of birth for the foreign-born population - Other Eastern Asia (%)
Place of birth for the foreign-born population - Afghanistan (%)
Place of birth for the foreign-born population - Bangladesh (%)
Place of birth for the foreign-born population - India (%)
Place of birth for the foreign-born population - Iran (%)
Place of birth for the foreign-born population - Kazakhstan (%)
Place of birth for the foreign-born population - Nepal (%)
Place of birth for the foreign-born population - Pakistan (%)
Place of birth for the foreign-born population - Sri Lanka (%)
Place of birth for the foreign-born population - Uzbekistan (%)
Place of birth for the foreign-born population - Other South Central Asia (%)
Place of birth for the foreign-born population - Burma (%)
Place of birth for the foreign-born population - Cambodia (%)
Place of birth for the foreign-born population - Indonesia (%)
Place of birth for the foreign-born population - Laos (%)
Place of birth for the foreign-born population - Malaysia (%)
Place of birth for the foreign-born population - Philippines (%)
Place of birth for the foreign-born population - Singapore (%)
Place of birth for the foreign-born population - Thailand (%)
Place of birth for the foreign-born population - Vietnam (%)
Place of birth for the foreign-born population - Other South Eastern Asia (%)
Place of birth for the foreign-born population - Armenia (%)
Place of birth for the foreign-born population - Iraq (%)
Place of birth for the foreign-born population - Israel (%)
Place of birth for the foreign-born population - Jordan (%)
Place of birth for the foreign-born population - Kuwait (%)
Place of birth for the foreign-born population - Lebanon (%)
Place of birth for the foreign-born population - Saudi Arabia (%)
Place of birth for the foreign-born population - Syria (%)
Place of birth for the foreign-born population - Turkey (%)
Place of birth for the foreign-born population - Yemen (%)
Place of birth for the foreign-born population - Other Western Asia (%)
Place of birth for the foreign-born population - Eritrea (%)
Place of birth for the foreign-born population - Ethiopia (%)
Place of birth for the foreign-born population - Kenya (%)
Place of birth for the foreign-born population - Somalia (%)
Place of birth for the foreign-born population - Uganda (%)
Place of birth for the foreign-born population - Zimbabwe (%)
Place of birth for the foreign-born population - Other Eastern Africa (%)
Place of birth for the foreign-born population - Cameroon (%)
Place of birth for the foreign-born population - Congo (%)
Place of birth for the foreign-born population - Democratic Republic of Congo (Zaire) (%)
Place of birth for the foreign-born population - Other Middle Africa (%)
Place of birth for the foreign-born population - Egypt (%)
Place of birth for the foreign-born population - Morocco (%)
Place of birth for the foreign-born population - Sudan (%)
Place of birth for the foreign-born population - Other Northern Africa (%)
Place of birth for the foreign-born population - South Africa (%)
Place of birth for the foreign-born population - Other Southern Africa (%)
Place of birth for the foreign-born population - Cabo Verde (%)
Place of birth for the foreign-born population - Ghana (%)
Place of birth for the foreign-born population - Liberia (%)
Place of birth for the foreign-born population - Nigeria (%)
Place of birth for the foreign-born population - Senegal (%)
Place of birth for the foreign-born population - Sierra Leone (%)
Place of birth for the foreign-born population - Other Western Africa (%)
Place of birth for the foreign-born population - Australia (%)
Place of birth for the foreign-born population - New Zealand (%)
Place of birth for the foreign-born population - Fiji (%)
Place of birth for the foreign-born population - Micronesia (%)
Place of birth for the foreign-born population - Bahamas (%)
Place of birth for the foreign-born population - Barbados (%)
Place of birth for the foreign-born population - Cuba (%)
Place of birth for the foreign-born population - Dominica (%)
Place of birth for the foreign-born population - Dominican Republic (%)
Place of birth for the foreign-born population - Grenada (%)
Place of birth for the foreign-born population - Haiti (%)
Place of birth for the foreign-born population - Jamaica (%)
Place of birth for the foreign-born population - St. Vincent and the Grenadines (%)
Place of birth for the foreign-born population - Trinidad and Tobago (%)
Place of birth for the foreign-born population - West Indies (%)
Place of birth for the foreign-born population - Other Caribbean (%)
Place of birth for the foreign-born population - Belize (%)
Place of birth for the foreign-born population - Costa Rica (%)
Place of birth for the foreign-born population - El Salvador (%)
Place of birth for the foreign-born population - Guatemala (%)
Place of birth for the foreign-born population - Honduras (%)
Place of birth for the foreign-born population - Mexico (%)
Place of birth for the foreign-born population - Nicaragua (%)
Place of birth for the foreign-born population - Panama (%)
Place of birth for the foreign-born population - Other Central America (%)
Place of birth for the foreign-born population - Argentina (%)
Place of birth for the foreign-born population - Bolivia (%)
Place of birth for the foreign-born population - Brazil (%)
Place of birth for the foreign-born population - Chile (%)
Place of birth for the foreign-born population - Colombia (%)
Place of birth for the foreign-born population - Ecuador (%)
Place of birth for the foreign-born population - Guyana (%)
Place of birth for the foreign-born population - Peru (%)
Place of birth for the foreign-born population - Uruguay (%)
Place of birth for the foreign-born population - Venezuela (%)
Place of birth for the foreign-born population - Other South America (%)
Place of birth for the foreign-born population - Canada (%)
Place of birth for the foreign-born population - Other Northern America (%)
Place of birth for the foreign-born population - Other (%)
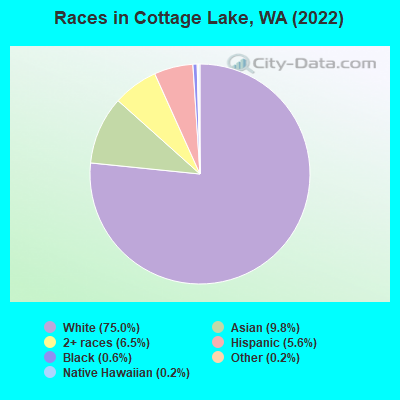
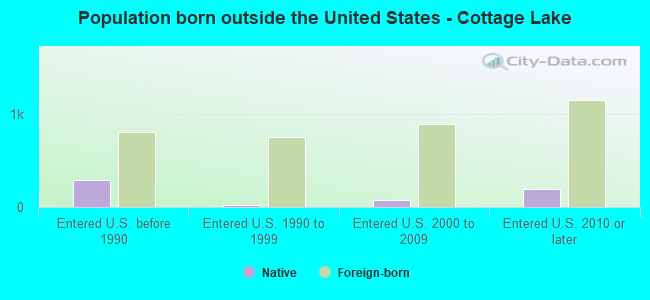
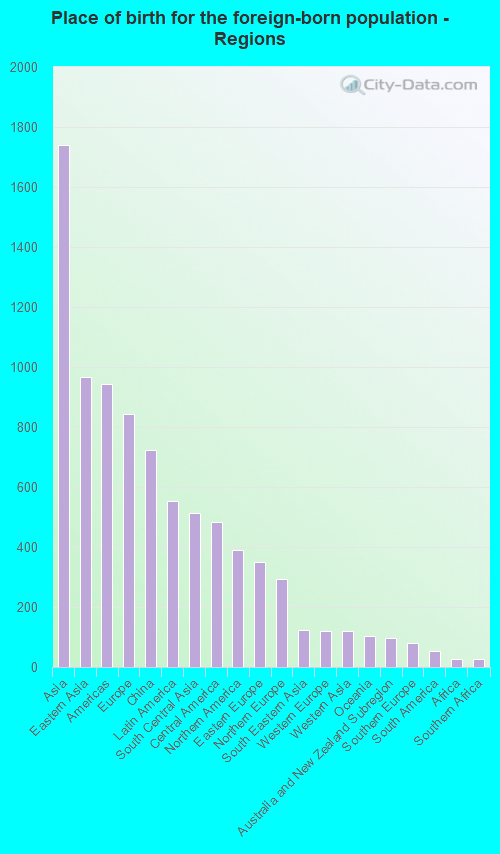
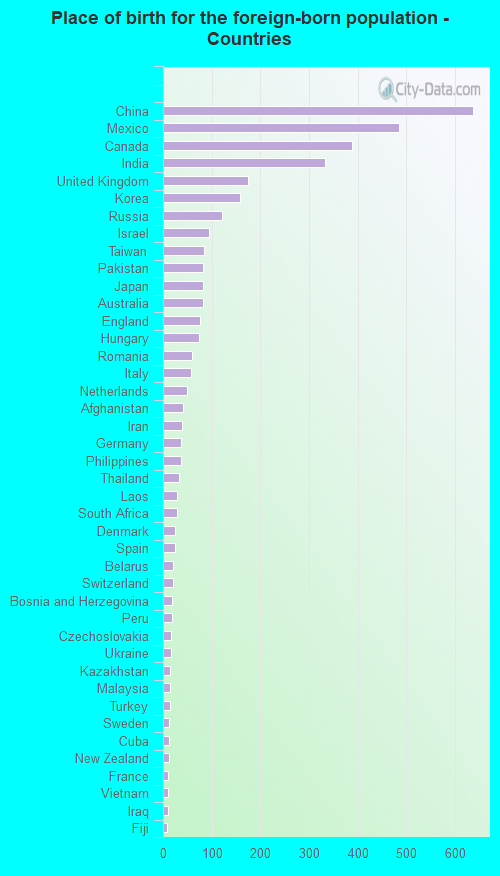
According to 2022 data, the most numerous races in Cottage Lake, WA are White alone (17,511 residents), Hispanic (1,298 residents), and Asian alone (2,295 residents). 83.0% of Cottage Lake residents speak English at home. 15.7% of Cottage Lake, WA residents are foreign-born (7.1% born in Asia, 3.5% born in Europe, 2.3% born in Latin America, 1.6% born in North America), which is 4.3% greater than the foreign-born rate of 15.0% across the entire state of Washington.
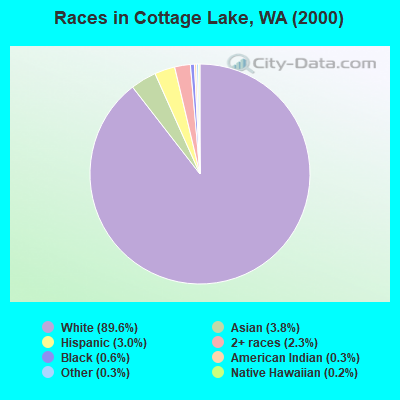
Race distribution in Cottage Lake
2000 2022
4,652,490 78.9% White alone 441,509 7.5% Hispanic 319,401 5.4% Asian alone 184,631 3.1% Black alone 175,926 3.0% Two or more races 85,396 1.4% American Indian alone 22,779 0.4% Native Hawaiian and Other 11,989 0.2% Other race alone
4,941,456 63.5% White alone 1,093,313 14.0% Hispanic 755,832 9.7% Asian alone 523,448 6.7% Two or more races 299,537 3.8% Black alone 69,024 0.9% American Indian alone 52,231 0.7% Native Hawaiian and Other 50,945 0.7% Other race alone
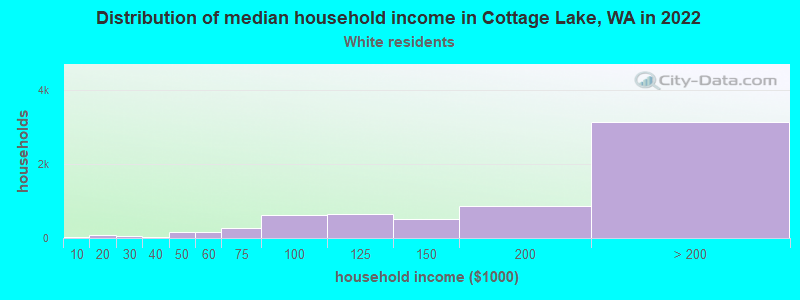
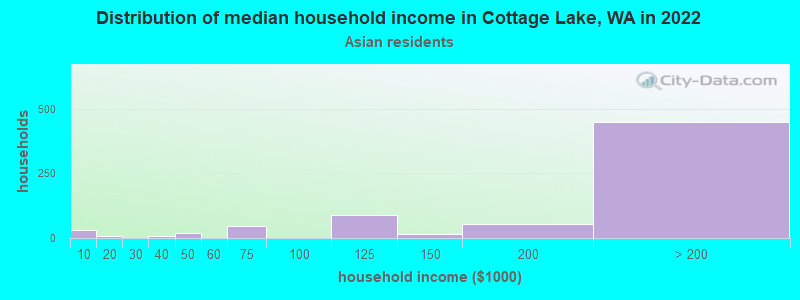
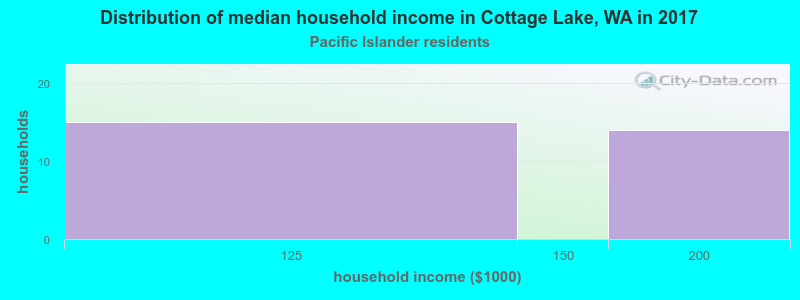
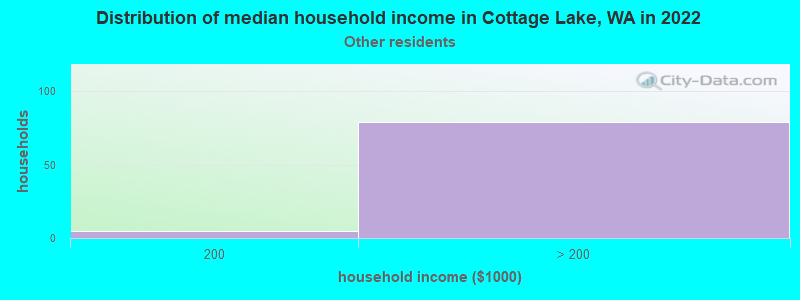
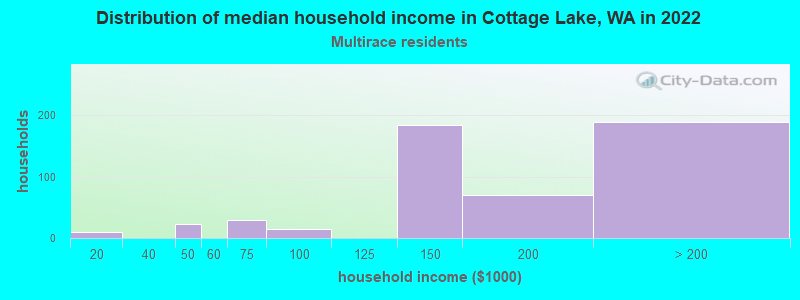
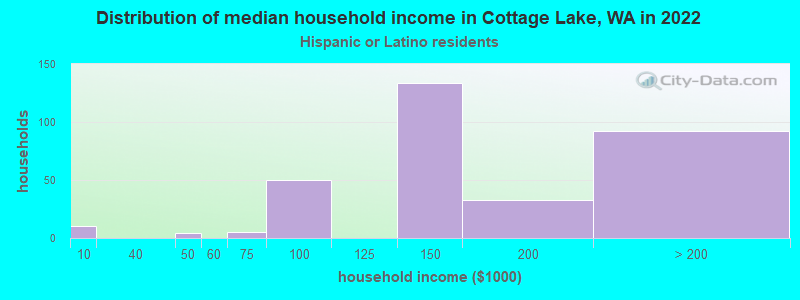
Income and house value in Cottage Lake Median household income in 2022 $183,867 White non-Hispanic householdersover $200,000 Asian householdersover $200,000 Some other race householders$144,291 Two or more races householders$141,349 Hispanic or Latino race householdersMedian 2022 house value over $1,000,000 White Non-Hispanic householders$777,659 Black or African American householders$925,384 American Indian or Alaska Native householders over $1,000,000 Asian householders$558,259 Some other race householders$978,888 Two or more races householders$880,966 Hispanic or Latino householders
Median age by race in Cottage Lake
47.8 Median age for White residents48.2 47.3 26.7 Median age for Black or African American residents26.2 13.3 -639,412,997.3 Median age for American Indian / Alaska Native residents-658,092,175.1 -631,249,999.4 43.7 Median age for Asian residents42.8 43.5 37.5 Median age for Native Hawaiian / Pacific Islander residents-664,509,168.7 37.6 43.9 Median age for Other race residents41.4 52.0 25.7 Median age for Two or more races residents23.2 27.9 47.5 Median age for White alone residents48.2 46.6 35.7 Median age for Hispanic or Latino residents21.8 44.7
Owner/renter occupied households by race in Cottage Lake
House owners and renters - White residents 6,028 92.5% Owner occupied488 7.5% Renter occupiedHouse owners and renters - Black or African American residents 8 100.0% Owner occupiedHouse owners and renters - Asian residents 667 93.7% Owner occupied45 6.3% Renter occupiedHouse owners and renters - Native Hawaiian / Pacific Islander residents 34 100.0% Owner occupiedHouse owners and renters - Other race residents 45 67.6% Owner occupied22 32.4% Renter occupiedHouse owners and renters - Two or more races residents 438 80.3% Owner occupied108 19.7% Renter occupiedHouse owners and renters - White alone residents 6,013 92.6% Owner occupied480 7.4% Renter occupiedHouse owners and renters - Hispanic or Latino residents 229 70.7% Owner occupied95 29.3% Renter occupied
Language usage in Cottage Lake
English speakers - Total 83.0% of residents of Cottage Lake speak English at home.
3.2% of residents speak Spanish at home 315 45.1% Speak English very well384 54.9% Speak English less than very well12.4% of residents speak other language at home 2,098 76.9% Speak English very well629 23.1% Speak English less than very well
English speakers - Born in the United States 97.2% of residents of Cottage Lake speak English at home.
0.8% of residents speak Spanish at home 57 79.2% Speak English very well15 20.8% Speak English less than very well1.4% of residents speak other language at home 100 82.6% Speak English very well21 17.4% Speak English less than very well
English speakers - Native, born elsewhere 70.2% of residents of Cottage Lake speak English at home.
27.0% of residents speak other language at home 143 100.0% Speak English very well
English speakers - Foreign-born 27.7% of residents of Cottage Lake speak English at home.
13.8% of residents speak Spanish at home 173 34.5% Speak English very well329 65.5% Speak English less than very well58.1% of residents speak other language at home 1,562 73.9% Speak English very well551 26.1% Speak English less than very well
White (Caucasian) - Speak only English Native:
97.9% (14,760)Foreign-born:
55.5% (730)
White (Caucasian) - Speak another language Native:
2.1% (322)Foreign-born:
43.7% (574)
Asian - Speak only English Native:
63.6% (435)Foreign-born:
10.8% (157)
Asian - Speak another language Native:
35.2% (241)Foreign-born:
89.2% (1,301)
Native Hawaiian / Pacific Islander - Speak only English Native:
43.2% (18)Foreign-born:
100.0% (10)
Other race - Speak another language Native:
27.5% (68)Foreign-born:
100.0% (124)
Two or more races - Speak only English Native:
91.8% (1,461)Foreign-born:
3.9% (24)
Two or more races - Speak another language Native:
6.6% (105)Foreign-born:
96.4% (596)
White alone - Speak only English Native:
97.6% (14,733)Foreign-born:
51.2% (731)
White alone - Speak another language Native:
2.3% (341)Foreign-born:
45.6% (652)
Hispanic or Latino - Speak only English Native:
78.0% (525)Foreign-born:
2.3% (12)
Hispanic or Latino - Speak another language Native:
20.4% (138)Foreign-born:
98.1% (500)
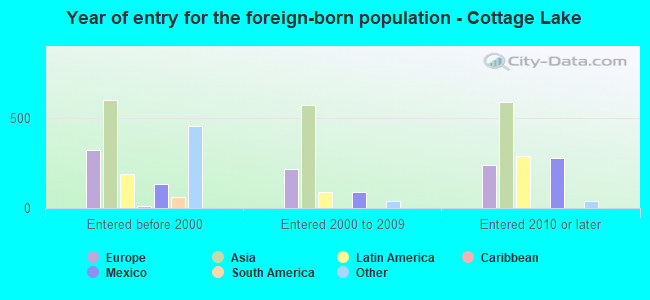
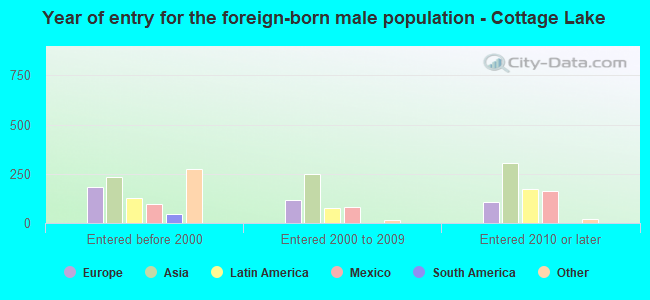
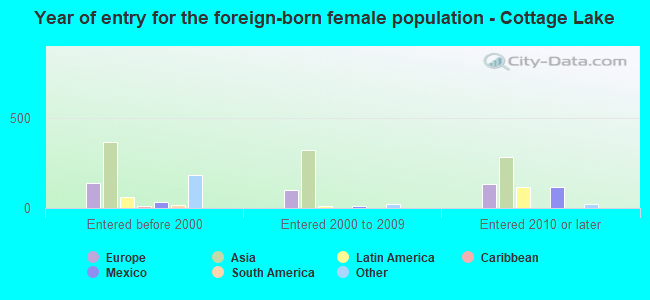
Foreign-born residents in Cottage Lake 3,661 residents are foreign born (7.1% Asia , 3.5% Europe , 2.3% Latin America , 1.6% North America ).
This city:
15.7%Washington:
14.9%
Marital status for residents in Cottage Lake Marital status - White (Caucasian) population 15 years and over
Males 22.0% Never married70.6% Now married0.2% Separated1.0% Widowed6.3% DivorcedFemales 19.5% Never married68.7% Now married0.2% Separated3.5% Widowed8.2% DivorcedWomen who gave birth in the past 12 months Now married:
91.5% (219)Unmarried:
8.5% (20)
Women who did not give birth in the past 12 months Now married:
52.4% (1,578)Unmarried:
47.6% (1,436)
Marital status - Black or African American population 15 years and over
Males 7.1% Never married92.9% Now married0.0% Separated0.0% Widowed0.0% DivorcedFemales 61.9% Never married38.1% Now married0.0% Separated0.0% Widowed0.0% DivorcedWomen who gave birth in the past 12 months Now married:
0.0% (0)Unmarried:
100.0% (2)
Women who did not give birth in the past 12 months Now married:
0.0% (0)Unmarried:
100.0% (11)
Marital status - Asian population 15 years and over
Males 14.9% Never married78.8% Now married0.0% Separated0.0% Widowed6.3% DivorcedFemales 12.7% Never married78.5% Now married1.7% Separated2.6% Widowed4.5% DivorcedWomen who gave birth in the past 12 months Now married:
100.0% (90)Unmarried:
0.0% (0)
Women who did not give birth in the past 12 months Now married:
76.5% (454)Unmarried:
23.5% (139)
Marital status - Native Hawaiian / Pacific Islander population 15 years and over
Males 0.0% Never married100.0% Now married0.0% Separated0.0% Widowed0.0% DivorcedFemales 0.0% Never married100.0% Now married0.0% Separated0.0% Widowed0.0% DivorcedWomen who did not give birth in the past 12 months Now married:
100.0% (24)Unmarried:
0.0% (0)
Marital status - Other race population 15 years and over
Males 29.7% Never married63.4% Now married0.0% Separated0.0% Widowed7.0% DivorcedFemales 8.8% Never married78.4% Now married0.0% Separated0.0% Widowed12.7% DivorcedWomen who did not give birth in the past 12 months Now married:
54.8% (28)Unmarried:
45.2% (23)
Marital status - Two or more races population 15 years and over
Males 45.9% Never married50.4% Now married0.0% Separated0.0% Widowed3.8% DivorcedFemales 31.9% Never married63.7% Now married0.0% Separated0.0% Widowed4.4% DivorcedWomen who gave birth in the past 12 months Now married:
100.0% (23)Unmarried:
0.0% (0)
Women who did not give birth in the past 12 months Now married:
49.2% (271)Unmarried:
50.8% (280)
Marital status - White alone, not Hispanic / Latino population 15 years and over
Males 21.7% Never married70.7% Now married0.2% Separated1.0% Widowed6.3% DivorcedFemales 19.3% Never married69.2% Now married0.2% Separated3.5% Widowed7.9% DivorcedWomen who gave birth in the past 12 months Now married:
91.5% (225)Unmarried:
8.5% (21)
Women who did not give birth in the past 12 months Now married:
52.3% (1,605)Unmarried:
47.7% (1,461)
Marital status - Hispanic or Latino population 15 years and over
Males 42.5% Never married55.3% Now married0.0% Separated0.0% Widowed2.2% DivorcedFemales 16.7% Never married71.2% Now married0.0% Separated0.0% Widowed12.1% DivorcedWomen who gave birth in the past 12 months Now married:
100.0% (8)Unmarried:
0.0% (0)
Women who did not give birth in the past 12 months Now married:
69.7% (129)Unmarried:
30.3% (56)
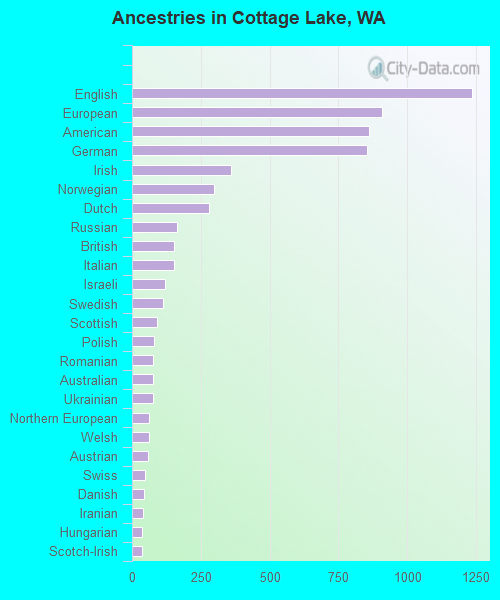
Ancestries in Cottage Lake
1,235 12.1% English909 8.9% European862 8.4% American852 8.3% German359 3.5% Irish297 2.9% Norwegian279 2.7% Dutch162 1.6% Russian153 1.5% British153 1.5% Italian120 1.2% Israeli114 1.1% Swedish91 0.9% Scottish80 0.8% Polish77 0.8% Romanian75 0.7% Australian75 0.7% Ukrainian60 0.6% Northern European60 0.6% Welsh58 0.6% Austrian49 0.5% Swiss43 0.4% Danish39 0.4% Iranian38 0.4% Hungarian38 0.4% Scotch-Irish28 0.3% Canadian28 0.3% Portuguese24 0.2% French22 0.2% Scandinavian21 0.2% Serbian19 0.2% French Canadian19 0.2% Afghan18 0.2% Turkish18 0.2% Yugoslavian14 0.1% Lebanese13 0.1% Slovak13 0.1% Czech6 0.06% Finnish5 0.05% Eastern European
Geographical mobility in Cottage Lake Same house 1 year ago 16,433 95.7% White (Caucasian)137 99.1% Black or African American4 96.7% American Indian / Alaska Native1,916 86.1% Asian53 100.0% Native Hawaiian / Pacific Islander359 98.3% Other race2,311 95.7% Two or more races16,527 95.5% White alone, not Hispanic / Latino1,248 97.7% Hispanic or LatinoMoved within same county 594 3.5% White / Caucasian2 1.3% Black or African American156 7.0% Asian119 4.9% Two or more races606 3.5% White alone, not Hispanic / Latino34 2.7% Hispanic or LatinoMoved within same state 166 1.0% White / Caucasian31 1.3% Two or more races171 1.0% White alone, not Hispanic / LatinoMoved from different state 154 0.9% White / Caucasian1 0.5% Black or African American2 0.5% Other race158 0.9% White alone, not Hispanic / Latino1 0.1% Hispanic or LatinoMoved from abroad 22 0.1% White150 6.7% Asian24 0.1% White alone, not Hispanic / Latino
Children Nativity (place of birth) in Cottage Lake
Children under 6 years - Living with two parents Both parents native 778 100.0% NativeBoth parents foreign-born 218 88.2% Native29 11.8% Foreign-bornOne native, one foreign-born parent 396 100.0% NativeChildren under 6 years - Living with one parent Native parent 96 100.0% NativeForeign-born parent 92 100.0% NativeChildren 6 to 17 years - Living with two parents Both parents native 2,152 100.0% NativeBoth parents foreign-born 326 61.5% Native204 38.5% Foreign-bornOne native, one foreign-born parent 534 98.5% Native8 1.5% Foreign-bornChildren 6 to 17 years - Living with one parent Native parent 294 100.0% NativeForeign-born parent 69 50.9% Native66 49.1% Foreign-born