Races in Country Club Hills, Illinois (IL) Detailed Stats
Data:
Races - White alone (%)
Races - White alone (% change since 2000)
Races - Black alone (%)
Races - Black alone (% change since 2000)
Races - American Indian alone (%)
Races - American Indian alone (% change since 2000)
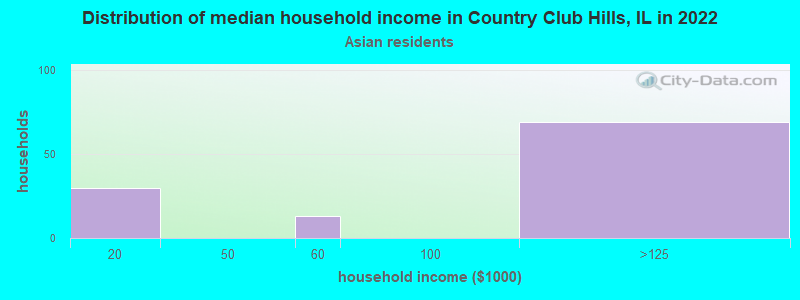
Races - Asian alone (%)
Races - Asian alone (% change since 2000)
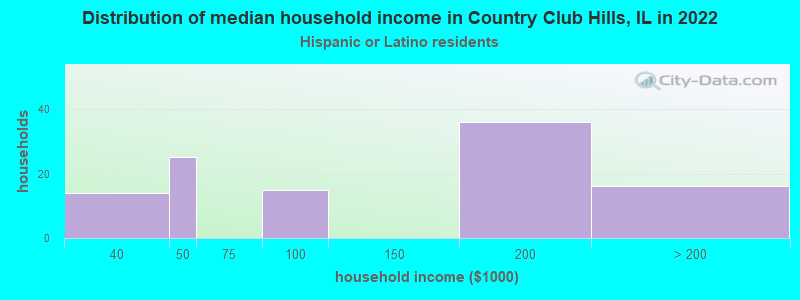
Races - Hispanic (%)
Races - Hispanic (% change since 2000)
Races - Native Hawaiian and Other Pacific Islander alone (%)
Races - Native Hawaiian and Other Pacific Islander alone (% change since 2000)
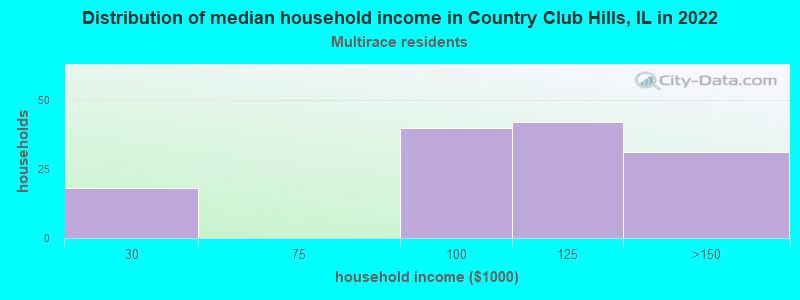
Races - Two or more races(%)
Races - Two or more races(% change since 2000)
Races - Other race alone (%)
Races - Other race alone (% change since 2000)
Racial diversity
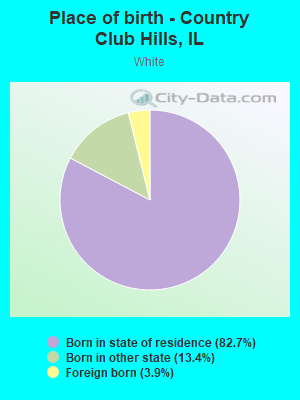
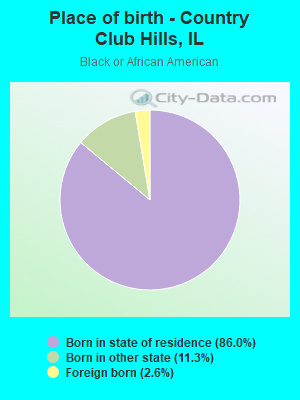
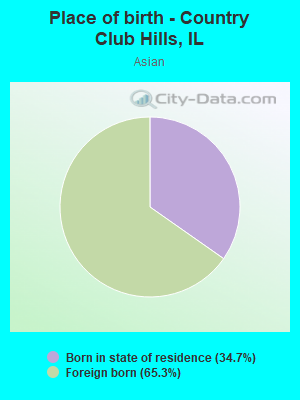
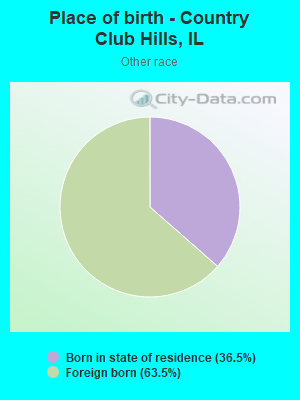
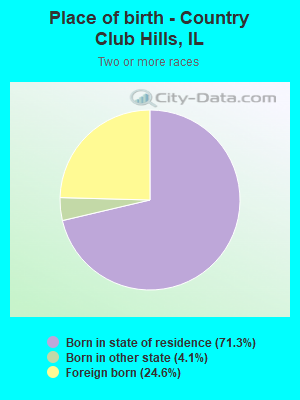
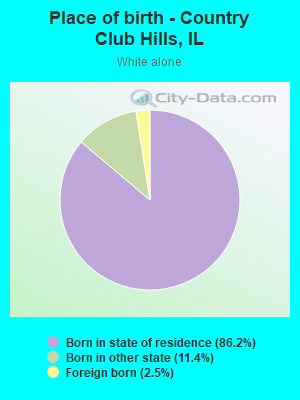
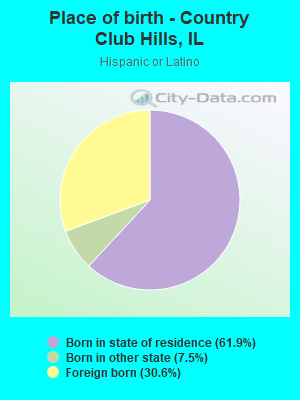
Place of birth - Born in state of residence (%)
Place of birth - Born in state of residence (%) - White
Place of birth - Born in state of residence (%) - Black or African American
Place of birth - Born in state of residence (%) - Asian
Place of birth - Born in state of residence (%) - Hispanic or Latino
Place of birth - Born in state of residence (%) - American Indian and Alaska Native
Place of birth - Born in state of residence (%) - Multirace
Place of birth - Born in state of residence (%) - Other Race
Place of birth - Born in other state (%)
Place of birth - Born in other state (%) - White
Place of birth - Born in other state (%) - Black or African American
Place of birth - Born in other state (%) - Asian
Place of birth - Born in other state (%) - Hispanic or Latino
Place of birth - Born in other state (%) - American Indian and Alaska Native
Place of birth - Born in other state (%) - Multirace
Place of birth - Born in other state (%) - Other Race
Place of birth - Native, outside of US (%)
Place of birth - Native, outside of US (%) - White
Place of birth - Native, outside of US (%) - Black or African American
Place of birth - Native, outside of US (%) - Asian
Place of birth - Native, outside of US (%) - Hispanic or Latino
Place of birth - Native, outside of US (%) - American Indian and Alaska Native
Place of birth - Native, outside of US (%) - Multirace
Place of birth - Native, outside of US (%) - Other Race
Place of birth - Foreign born (%)
Place of birth - Foreign born (%) - White
Place of birth - Foreign born (%) - Black or African American
Place of birth - Foreign born (%) - Asian
Place of birth - Foreign born (%) - Hispanic or Latino
Place of birth - Foreign born (%) - American Indian and Alaska Native
Place of birth - Foreign born (%) - Multirace
Place of birth - Foreign born (%) - Other Race
Residents speaking English at home (%)
Residents speaking English at home - Born in the United States (%)
Residents speaking English at home - Native, born elsewhere (%)
Residents speaking English at home - Foreign born (%)
Residents speaking Spanish at home (%)
Residents speaking Spanish at home - Born in the United States (%)
Residents speaking Spanish at home - Native, born elsewhere (%)
Residents speaking Spanish at home - Foreign born (%)
Residents speaking other language at home (%)
Residents speaking other language at home - Born in the United States (%)
Residents speaking other language at home - Native, born elsewhere (%)
Residents speaking other language at home - Foreign born (%)
Marital status - Never married (%)
Marital status - Now married (%)
Marital status - Separated (%)
Marital status - Widowed (%)
Marital status - Divorced (%)
Ancestries Reported - Arab (%)
Ancestries Reported - Czech (%)
Ancestries Reported - Danish (%)
Ancestries Reported - Dutch (%)
Ancestries Reported - English (%)
Ancestries Reported - French (%)
Ancestries Reported - French Canadian (%)
Ancestries Reported - German (%)
Ancestries Reported - Greek (%)
Ancestries Reported - Hungarian (%)
Ancestries Reported - Irish (%)
Ancestries Reported - Italian (%)
Ancestries Reported - Lithuanian (%)
Ancestries Reported - Norwegian (%)
Ancestries Reported - Polish (%)
Ancestries Reported - Portuguese (%)
Ancestries Reported - Russian (%)
Ancestries Reported - Scotch-Irish (%)
Ancestries Reported - Scottish (%)
Ancestries Reported - Slovak (%)
Ancestries Reported - Subsaharan African (%)
Ancestries Reported - Swedish (%)
Ancestries Reported - Swiss (%)
Ancestries Reported - Ukrainian (%)
Ancestries Reported - United States (%)
Ancestries Reported - Welsh (%)
Ancestries Reported - West Indian (%)
Ancestries Reported - Other (%)
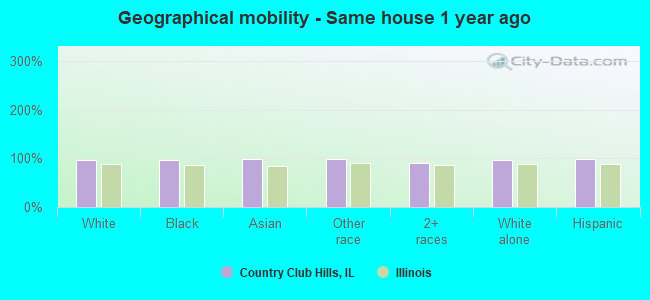
Geographical mobility - Same house 1 year ago (%)
Geographical mobility - Same house 1 year ago (%) - White
Geographical mobility - Same house 1 year ago (%) - Black or African American
Geographical mobility - Same house 1 year ago (%) - Asian
Geographical mobility - Same house 1 year ago (%) - Hispanic or Latino
Geographical mobility - Same house 1 year ago (%) - American Indian and Alaska Native
Geographical mobility - Same house 1 year ago (%) - Multirace
Geographical mobility - Same house 1 year ago (%) - Other Race
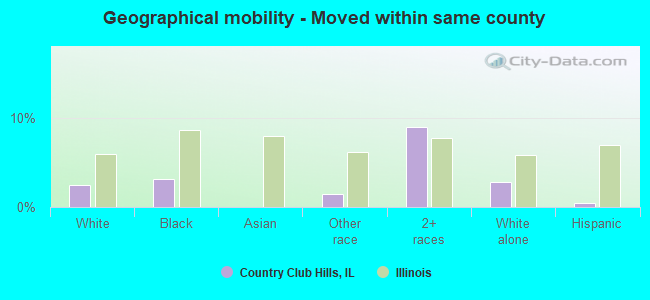
Geographical mobility - Moved within same county (%)
Geographical mobility - Moved within same county (%) - White
Geographical mobility - Moved within same county (%) - Black or African American
Geographical mobility - Moved within same county (%) - Asian
Geographical mobility - Moved within same county (%) - Hispanic or Latino
Geographical mobility - Moved within same county (%) - American Indian and Alaska Native
Geographical mobility - Moved within same county (%) - Multirace
Geographical mobility - Moved within same county (%) - Other Race
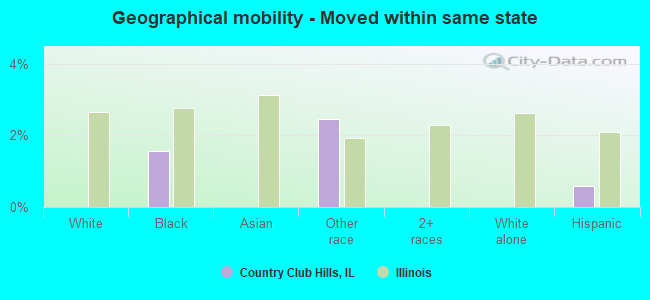
Geographical mobility - Moved from different county within same state (%)
Geographical mobility - Moved from different county within same state (%) - White
Geographical mobility - Moved from different county within same state (%) - Black or African American
Geographical mobility - Moved from different county within same state (%) - Asian
Geographical mobility - Moved from different county within same state (%) - Hispanic or Latino
Geographical mobility - Moved from different county within same state (%) - American Indian and Alaska Native
Geographical mobility - Moved from different county within same state (%) - Multirace
Geographical mobility - Moved from different county within same state (%) - Other Race
Geographical mobility - Moved from different state (%)
Geographical mobility - Moved from different state (%) - White
Geographical mobility - Moved from different state (%) - Black or African American
Geographical mobility - Moved from different state (%) - Asian
Geographical mobility - Moved from different state (%) - Hispanic or Latino
Geographical mobility - Moved from different state (%) - American Indian and Alaska Native
Geographical mobility - Moved from different state (%) - Multirace
Geographical mobility - Moved from different state (%) - Other Race
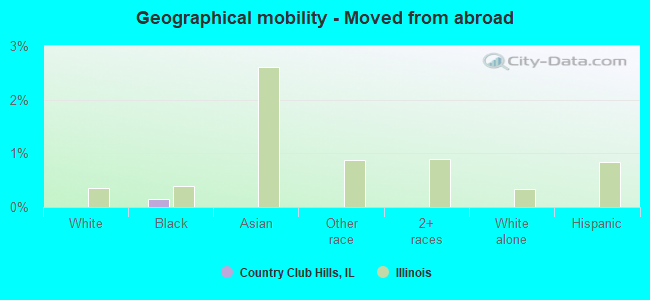
Geographical mobility - Moved from abroad (%)
Geographical mobility - Moved from abroad (%) - White
Geographical mobility - Moved from abroad (%) - Black or African American
Geographical mobility - Moved from abroad (%) - Asian
Geographical mobility - Moved from abroad (%) - Hispanic or Latino
Geographical mobility - Moved from abroad (%) - American Indian and Alaska Native
Geographical mobility - Moved from abroad (%) - Multirace
Geographical mobility - Moved from abroad (%) - Other Race
Place of birth for the foreign-born population - Ireland (%)
Place of birth for the foreign-born population - Denmark (%)
Place of birth for the foreign-born population - Norway (%)
Place of birth for the foreign-born population - Sweden (%)
Place of birth for the foreign-born population - United Kingdom (%)
Place of birth for the foreign-born population - England (%)
Place of birth for the foreign-born population - Scotland (%)
Place of birth for the foreign-born population - Other Northern Europe (%)
Place of birth for the foreign-born population - Austria (%)
Place of birth for the foreign-born population - Belgium (%)
Place of birth for the foreign-born population - France (%)
Place of birth for the foreign-born population - Germany (%)
Place of birth for the foreign-born population - Netherlands (%)
Place of birth for the foreign-born population - Switzerland (%)
Place of birth for the foreign-born population - Other Western Europe (%)
Place of birth for the foreign-born population - Greece (%)
Place of birth for the foreign-born population - Italy (%)
Place of birth for the foreign-born population - Portugal (%)
Place of birth for the foreign-born population - Spain (%)
Place of birth for the foreign-born population - Other Southern Europe (%)
Place of birth for the foreign-born population - Albania (%)
Place of birth for the foreign-born population - Belarus (%)
Place of birth for the foreign-born population - Bosnia and Herzegovina (%)
Place of birth for the foreign-born population - Bulgaria (%)
Place of birth for the foreign-born population - Croatia (%)
Place of birth for the foreign-born population - Czechoslovakia (%)
Place of birth for the foreign-born population - Hungary (%)
Place of birth for the foreign-born population - Latvia (%)
Place of birth for the foreign-born population - Lithuania (%)
Place of birth for the foreign-born population - North Macedonia (Macedonia) (%)
Place of birth for the foreign-born population - Moldova (%)
Place of birth for the foreign-born population - Poland (%)
Place of birth for the foreign-born population - Romania (%)
Place of birth for the foreign-born population - Russia (%)
Place of birth for the foreign-born population - Serbia (%)
Place of birth for the foreign-born population - Ukraine (%)
Place of birth for the foreign-born population - Other Eastern Europe (%)
Place of birth for the foreign-born population - China (%)
Place of birth for the foreign-born population - Hong Kong (%)
Place of birth for the foreign-born population - Taiwan (%)
Place of birth for the foreign-born population - Japan (%)
Place of birth for the foreign-born population - Korea (%)
Place of birth for the foreign-born population - Other Eastern Asia (%)
Place of birth for the foreign-born population - Afghanistan (%)
Place of birth for the foreign-born population - Bangladesh (%)
Place of birth for the foreign-born population - India (%)
Place of birth for the foreign-born population - Iran (%)
Place of birth for the foreign-born population - Kazakhstan (%)
Place of birth for the foreign-born population - Nepal (%)
Place of birth for the foreign-born population - Pakistan (%)
Place of birth for the foreign-born population - Sri Lanka (%)
Place of birth for the foreign-born population - Uzbekistan (%)
Place of birth for the foreign-born population - Other South Central Asia (%)
Place of birth for the foreign-born population - Burma (%)
Place of birth for the foreign-born population - Cambodia (%)
Place of birth for the foreign-born population - Indonesia (%)
Place of birth for the foreign-born population - Laos (%)
Place of birth for the foreign-born population - Malaysia (%)
Place of birth for the foreign-born population - Philippines (%)
Place of birth for the foreign-born population - Singapore (%)
Place of birth for the foreign-born population - Thailand (%)
Place of birth for the foreign-born population - Vietnam (%)
Place of birth for the foreign-born population - Other South Eastern Asia (%)
Place of birth for the foreign-born population - Armenia (%)
Place of birth for the foreign-born population - Iraq (%)
Place of birth for the foreign-born population - Israel (%)
Place of birth for the foreign-born population - Jordan (%)
Place of birth for the foreign-born population - Kuwait (%)
Place of birth for the foreign-born population - Lebanon (%)
Place of birth for the foreign-born population - Saudi Arabia (%)
Place of birth for the foreign-born population - Syria (%)
Place of birth for the foreign-born population - Turkey (%)
Place of birth for the foreign-born population - Yemen (%)
Place of birth for the foreign-born population - Other Western Asia (%)
Place of birth for the foreign-born population - Eritrea (%)
Place of birth for the foreign-born population - Ethiopia (%)
Place of birth for the foreign-born population - Kenya (%)
Place of birth for the foreign-born population - Somalia (%)
Place of birth for the foreign-born population - Uganda (%)
Place of birth for the foreign-born population - Zimbabwe (%)
Place of birth for the foreign-born population - Other Eastern Africa (%)
Place of birth for the foreign-born population - Cameroon (%)
Place of birth for the foreign-born population - Congo (%)
Place of birth for the foreign-born population - Democratic Republic of Congo (Zaire) (%)
Place of birth for the foreign-born population - Other Middle Africa (%)
Place of birth for the foreign-born population - Egypt (%)
Place of birth for the foreign-born population - Morocco (%)
Place of birth for the foreign-born population - Sudan (%)
Place of birth for the foreign-born population - Other Northern Africa (%)
Place of birth for the foreign-born population - South Africa (%)
Place of birth for the foreign-born population - Other Southern Africa (%)
Place of birth for the foreign-born population - Cabo Verde (%)
Place of birth for the foreign-born population - Ghana (%)
Place of birth for the foreign-born population - Liberia (%)
Place of birth for the foreign-born population - Nigeria (%)
Place of birth for the foreign-born population - Senegal (%)
Place of birth for the foreign-born population - Sierra Leone (%)
Place of birth for the foreign-born population - Other Western Africa (%)
Place of birth for the foreign-born population - Australia (%)
Place of birth for the foreign-born population - New Zealand (%)
Place of birth for the foreign-born population - Fiji (%)
Place of birth for the foreign-born population - Micronesia (%)
Place of birth for the foreign-born population - Bahamas (%)
Place of birth for the foreign-born population - Barbados (%)
Place of birth for the foreign-born population - Cuba (%)
Place of birth for the foreign-born population - Dominica (%)
Place of birth for the foreign-born population - Dominican Republic (%)
Place of birth for the foreign-born population - Grenada (%)
Place of birth for the foreign-born population - Haiti (%)
Place of birth for the foreign-born population - Jamaica (%)
Place of birth for the foreign-born population - St. Vincent and the Grenadines (%)
Place of birth for the foreign-born population - Trinidad and Tobago (%)
Place of birth for the foreign-born population - West Indies (%)
Place of birth for the foreign-born population - Other Caribbean (%)
Place of birth for the foreign-born population - Belize (%)
Place of birth for the foreign-born population - Costa Rica (%)
Place of birth for the foreign-born population - El Salvador (%)
Place of birth for the foreign-born population - Guatemala (%)
Place of birth for the foreign-born population - Honduras (%)
Place of birth for the foreign-born population - Mexico (%)
Place of birth for the foreign-born population - Nicaragua (%)
Place of birth for the foreign-born population - Panama (%)
Place of birth for the foreign-born population - Other Central America (%)
Place of birth for the foreign-born population - Argentina (%)
Place of birth for the foreign-born population - Bolivia (%)
Place of birth for the foreign-born population - Brazil (%)
Place of birth for the foreign-born population - Chile (%)
Place of birth for the foreign-born population - Colombia (%)
Place of birth for the foreign-born population - Ecuador (%)
Place of birth for the foreign-born population - Guyana (%)
Place of birth for the foreign-born population - Peru (%)
Place of birth for the foreign-born population - Uruguay (%)
Place of birth for the foreign-born population - Venezuela (%)
Place of birth for the foreign-born population - Other South America (%)
Place of birth for the foreign-born population - Canada (%)
Place of birth for the foreign-born population - Other Northern America (%)
Place of birth for the foreign-born population - Other (%)
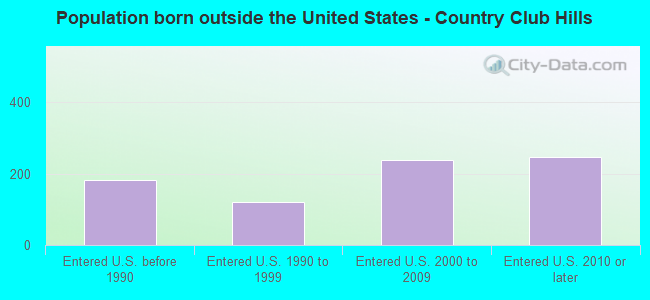
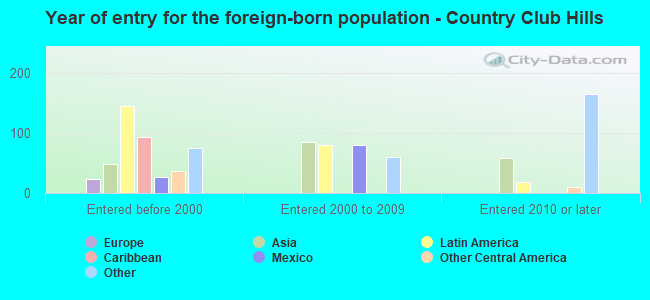
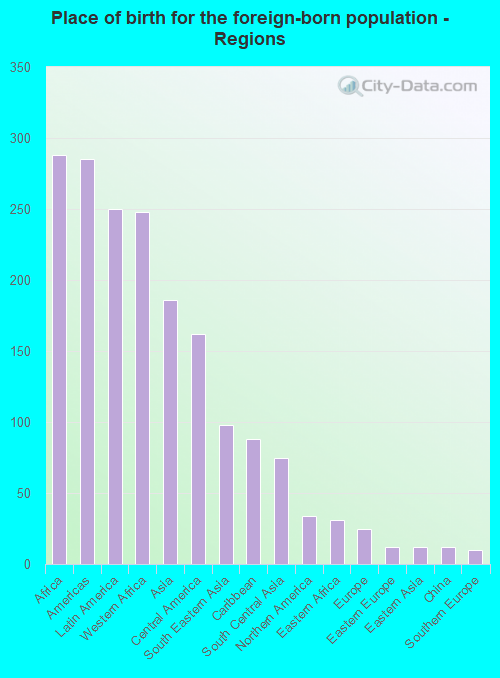
According to 2022 data, the most numerous races in Country Club Hills, IL are White alone (947 residents), Hispanic (385 residents), and Black alone (13,984 residents). 94.8% of Country Club Hills residents speak English at home. 4.8% of Country Club Hills, IL residents are foreign-born (1.7% born in Africa, 1.5% born in Latin America, 1.1% born in Asia), which is 188.7% less than the foreign-born rate of 14.0% across the entire state of Illinois.
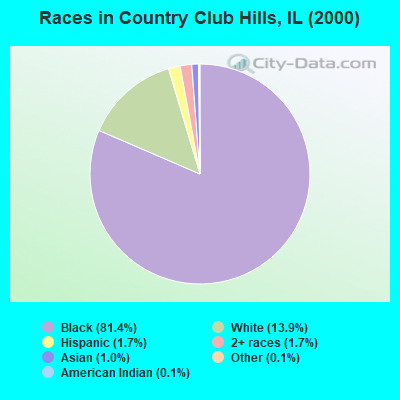
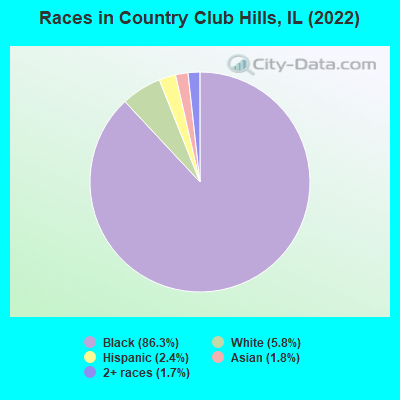
Race distribution in Country Club Hills
2000 2022
8,424,140 67.8% White alone 1,856,152 14.9% Black alone 1,530,262 12.3% Hispanic 419,916 3.4% Asian alone 153,996 1.2% Two or more races 13,479 0.1% Other race alone 18,232 0.1% American Indian alone 3,116 0.03% Native Hawaiian and Other
7,356,301 58.5% White alone 2,299,726 18.3% Hispanic 1,660,423 13.2% Black alone 747,296 5.9% Asian alone 458,599 3.6% Two or more races 45,386 0.4% Other race alone 10,405 0.08% American Indian alone 3,896 0.03% Native Hawaiian and Other
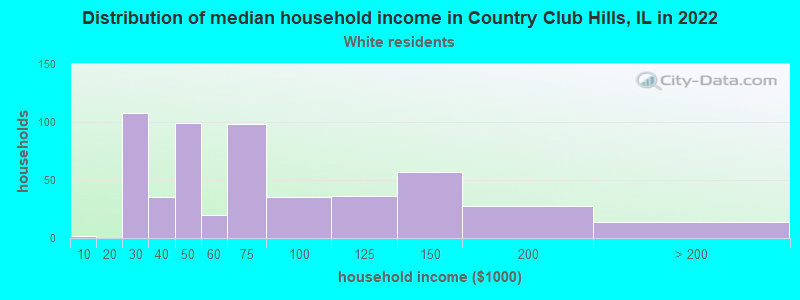
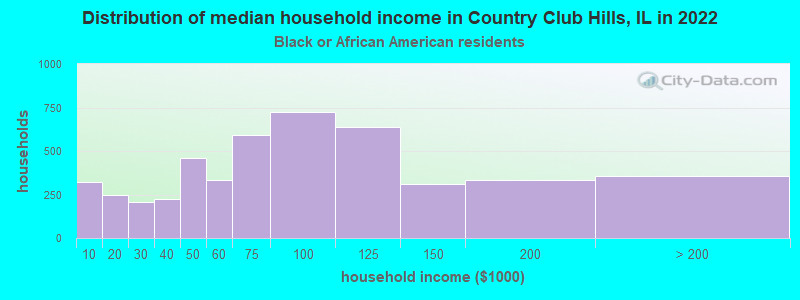
Income and house value in Country Club Hills Median household income in 2022 $58,366 White non-Hispanic householders$72,455 Black householders$95,767 Asian householders$116,106 Two or more races householdersMedian 2022 house value $152,865 White Non-Hispanic householders$176,263 Black or African American householders $139,606 Asian householders$116,988 Native Hawaiian and other Pacific Islander householders$110,749 Some other race householders$158,948 Two or more races householders$122,448 Hispanic or Latino householders
Median age by race in Country Club Hills
64.8 Median age for White residents64.9 61.6 37.5 Median age for Black or African American residents33.5 41.7 -680,473,372.1 Median age for American Indian / Alaska Native residents-736,736,736.0 -641,399,416.3 44.4 Median age for Asian residents35.0 44.4 -687,999,999.3 Median age for Native Hawaiian / Pacific Islander residents-918,721,460.3 -610,229,276.3 39.7 Median age for Other race residents40.0 -687,898,088.5 34.6 Median age for Two or more races residents50.2 32.8 63.9 Median age for White alone residents68.8 63.6 34.5 Median age for Hispanic or Latino residents39.8 31.1
Owner/renter occupied households by race in Country Club Hills
House owners and renters - White residents 482 89.6% Owner occupied56 10.4% Renter occupiedHouse owners and renters - Black or African American residents 3,680 77.4% Owner occupied1,077 22.6% Renter occupiedHouse owners and renters - Asian residents 86 69.0% Owner occupied39 31.0% Renter occupiedHouse owners and renters - Other race residents 42 100.0% Owner occupiedHouse owners and renters - Two or more races residents 120 86.3% Owner occupied19 13.7% Renter occupiedHouse owners and renters - White alone residents 456 88.1% Owner occupied62 11.9% Renter occupiedHouse owners and renters - Hispanic or Latino residents 111 100.0% Owner occupied
Language usage in Country Club Hills
English speakers - Total 94.8% of residents of Country Club Hills speak English at home.
2.0% of residents speak Spanish at home 193 60.9% Speak English very well124 39.1% Speak English less than very well2.3% of residents speak other language at home 237 66.2% Speak English very well121 33.8% Speak English less than very well
English speakers - Born in the United States 98.0% of residents of Country Club Hills speak English at home.
1.5% of residents speak Spanish at home 26 100.0% Speak English very well
English speakers - Foreign-born 46.8% of residents of Country Club Hills speak English at home.
15.0% of residents speak Spanish at home 118 100.0% Speak English less than very well35.0% of residents speak other language at home 154 56.0% Speak English very well121 44.0% Speak English less than very well
White (Caucasian) - Speak only English Native:
95.7% (922)Foreign-born:
21.0% (8)
White (Caucasian) - Speak another language Native:
6.3% (60)Foreign-born:
79.5% (30)
Black or African American - Speak only English Native:
99.2% (12,905)Foreign-born:
86.2% (322)
Black or African American - Speak another language Native:
0.8% (104)Foreign-born:
25.3% (94)
Asian - Speak only English Native:
100.0% (105)Foreign-born:
17.0% (32)
Other race - Speak another language Native:
93.4% (47)Foreign-born:
100.0% (88)
Two or more races - Speak only English Native:
79.5% (263)Foreign-born:
79.5% (84)
Two or more races - Speak another language Native:
18.0% (59)Foreign-born:
20.5% (22)
White alone - Speak only English Native:
97.0% (899)Foreign-born:
38.1% (9)
White alone - Speak another language Native:
2.4% (22)Foreign-born:
59.3% (14)
Hispanic or Latino - Speak another language Native:
55.5% (149)Foreign-born:
100.0% (118)
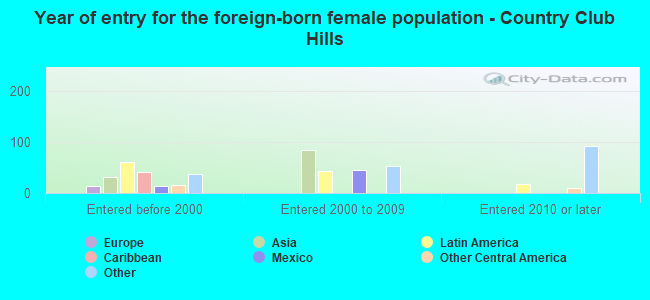
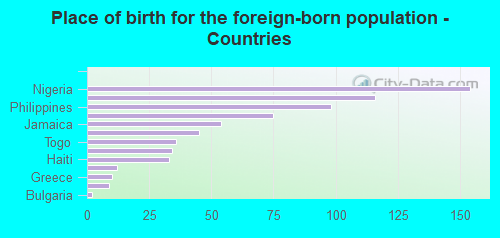
Foreign-born residents in Country Club Hills 786 residents are foreign born (1.7% Africa , 1.5% Latin America , 1.1% Asia ).
This city:
4.8%Illinois:
14.1%
Marital status for residents in Country Club Hills Marital status - White (Caucasian) population 15 years and over
Males 41.4% Never married43.0% Now married0.0% Separated9.9% Widowed5.8% DivorcedFemales 42.7% Never married38.8% Now married0.0% Separated10.2% Widowed8.2% DivorcedWomen who did not give birth in the past 12 months Now married:
28.6% (51)Unmarried:
71.4% (127)
Marital status - Black or African American population 15 years and over
Males 50.3% Never married32.2% Now married3.4% Separated2.9% Widowed11.2% DivorcedFemales 54.3% Never married23.4% Now married2.6% Separated7.8% Widowed11.8% DivorcedWomen who gave birth in the past 12 months Now married:
39.0% (87)Unmarried:
61.0% (136)
Women who did not give birth in the past 12 months Now married:
14.8% (498)Unmarried:
85.2% (2,873)
Marital status - Asian population 15 years and over
Males 82.4% Never married17.6% Now married0.0% Separated0.0% Widowed0.0% DivorcedFemales 35.5% Never married5.9% Now married0.0% Separated39.2% Widowed19.4% DivorcedWomen who did not give birth in the past 12 months Now married:
0.0% (0)Unmarried:
100.0% (103)
Marital status - Other race population 15 years and over
Males 13.7% Never married82.4% Now married0.0% Separated3.9% Widowed0.0% DivorcedFemales 0.0% Never married51.5% Now married0.0% Separated48.5% Widowed0.0% DivorcedWomen who did not give birth in the past 12 months Now married:
100.0% (40)Unmarried:
0.0% (0)
Marital status - Two or more races population 15 years and over
Males 31.7% Never married68.3% Now married0.0% Separated0.0% Widowed0.0% DivorcedFemales 48.2% Never married44.0% Now married0.0% Separated7.8% Widowed0.0% DivorcedWomen who did not give birth in the past 12 months Now married:
15.8% (21)Unmarried:
84.2% (111)
Marital status - White alone, not Hispanic / Latino population 15 years and over
Males 37.7% Never married47.4% Now married0.0% Separated11.7% Widowed3.2% DivorcedFemales 38.1% Never married41.2% Now married0.0% Separated11.5% Widowed9.2% DivorcedWomen who did not give birth in the past 12 months Now married:
39.0% (57)Unmarried:
61.0% (89)
Marital status - Hispanic or Latino population 15 years and over
Males 27.6% Never married63.5% Now married0.0% Separated1.0% Widowed7.8% DivorcedFemales 36.8% Never married41.4% Now married0.0% Separated21.7% Widowed0.0% DivorcedWomen who did not give birth in the past 12 months Now married:
47.2% (50)Unmarried:
52.8% (56)
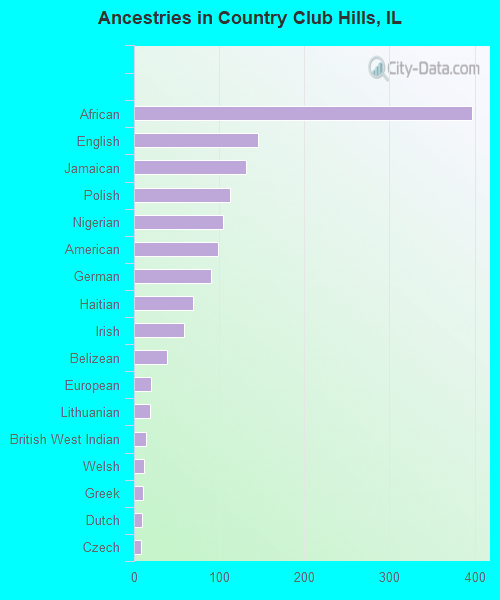
Ancestries in Country Club Hills
397 3.3% African146 1.2% English132 1.1% Jamaican113 0.9% Polish104 0.9% Nigerian99 0.8% American91 0.8% German69 0.6% Haitian59 0.5% Irish39 0.3% Belizean20 0.2% European19 0.2% Lithuanian14 0.1% British West Indian12 0.1% Welsh10 0.08% Greek9 0.08% Dutch8 0.07% Czech3 0.03% Bulgarian
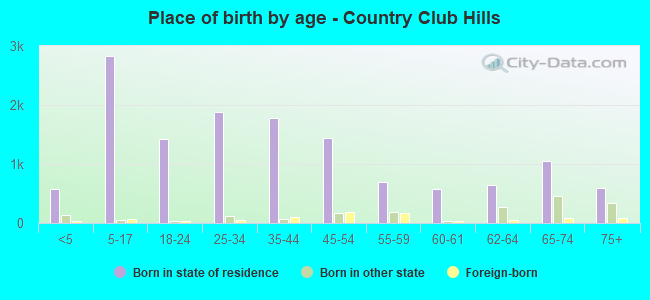
Children Nativity (place of birth) in Country Club Hills
Children under 6 years - Living with two parents Both parents native 307 100.0% NativeChildren under 6 years - Living with one parent Native parent 590 100.0% NativeChildren 6 to 17 years - Living with two parents Both parents native 520 100.0% NativeBoth parents foreign-born 150 100.0% NativeOne native, one foreign-born parent 44 100.0% NativeChildren 6 to 17 years - Living with one parent Native parent 1,809 100.0% NativeForeign-born parent 181 63.8% Native102 36.2% Foreign-born
Grandparents responsible for own grandchildren in Country Club Hills
Grandparents (30 to 59 years) Black or African American 78 35.5% Responsible for grandchildren142 64.5% Not responsible for grandchildrenGrandparents (60 years and over) Black or African American 86 15.5% Responsible for grandchildren473 84.5% Not responsible for grandchildren