Races in Crestview, Florida (FL) Detailed Stats
Data:
Races - White alone (%)
Races - White alone (% change since 2000)
Races - Black alone (%)
Races - Black alone (% change since 2000)
Races - American Indian alone (%)
Races - American Indian alone (% change since 2000)
Races - Asian alone (%)
Races - Asian alone (% change since 2000)
Races - Hispanic (%)
Races - Hispanic (% change since 2000)
Races - Native Hawaiian and Other Pacific Islander alone (%)
Races - Native Hawaiian and Other Pacific Islander alone (% change since 2000)
Races - Two or more races(%)
Races - Two or more races(% change since 2000)
Races - Other race alone (%)
Races - Other race alone (% change since 2000)
Racial diversity
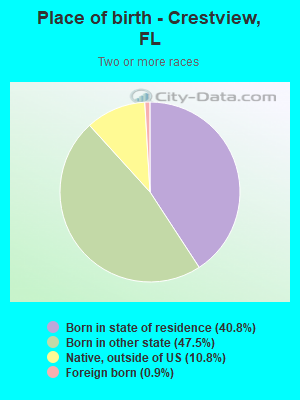
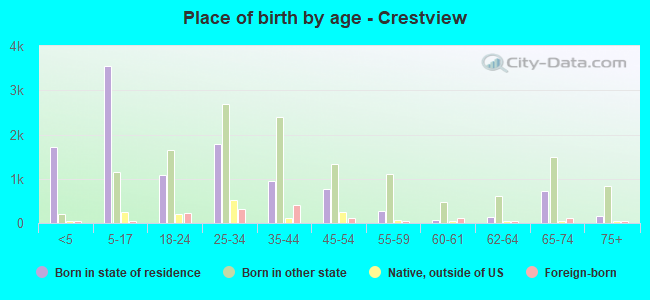
Place of birth - Born in state of residence (%)
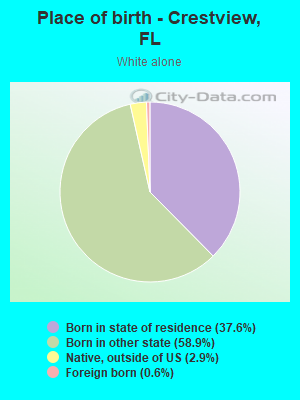
Place of birth - Born in state of residence (%) - White
Place of birth - Born in state of residence (%) - Black or African American
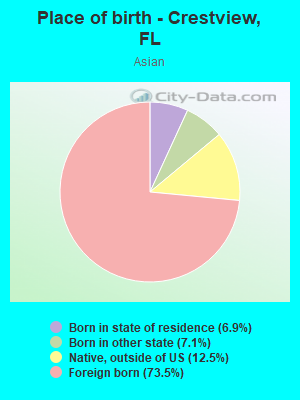
Place of birth - Born in state of residence (%) - Asian
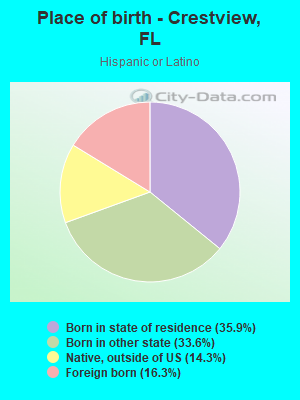
Place of birth - Born in state of residence (%) - Hispanic or Latino
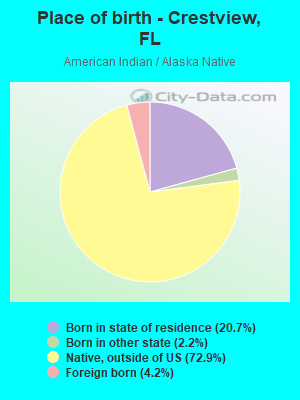
Place of birth - Born in state of residence (%) - American Indian and Alaska Native
Place of birth - Born in state of residence (%) - Multirace
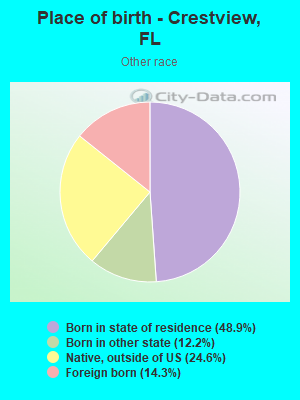
Place of birth - Born in state of residence (%) - Other Race
Place of birth - Born in other state (%)
Place of birth - Born in other state (%) - White
Place of birth - Born in other state (%) - Black or African American
Place of birth - Born in other state (%) - Asian
Place of birth - Born in other state (%) - Hispanic or Latino
Place of birth - Born in other state (%) - American Indian and Alaska Native
Place of birth - Born in other state (%) - Multirace
Place of birth - Born in other state (%) - Other Race
Place of birth - Native, outside of US (%)
Place of birth - Native, outside of US (%) - White
Place of birth - Native, outside of US (%) - Black or African American
Place of birth - Native, outside of US (%) - Asian
Place of birth - Native, outside of US (%) - Hispanic or Latino
Place of birth - Native, outside of US (%) - American Indian and Alaska Native
Place of birth - Native, outside of US (%) - Multirace
Place of birth - Native, outside of US (%) - Other Race
Place of birth - Foreign born (%)
Place of birth - Foreign born (%) - White
Place of birth - Foreign born (%) - Black or African American
Place of birth - Foreign born (%) - Asian
Place of birth - Foreign born (%) - Hispanic or Latino
Place of birth - Foreign born (%) - American Indian and Alaska Native
Place of birth - Foreign born (%) - Multirace
Place of birth - Foreign born (%) - Other Race
Residents speaking English at home (%)
Residents speaking English at home - Born in the United States (%)
Residents speaking English at home - Native, born elsewhere (%)
Residents speaking English at home - Foreign born (%)
Residents speaking Spanish at home (%)
Residents speaking Spanish at home - Born in the United States (%)
Residents speaking Spanish at home - Native, born elsewhere (%)
Residents speaking Spanish at home - Foreign born (%)
Residents speaking other language at home (%)
Residents speaking other language at home - Born in the United States (%)
Residents speaking other language at home - Native, born elsewhere (%)
Residents speaking other language at home - Foreign born (%)
Marital status - Never married (%)
Marital status - Now married (%)
Marital status - Separated (%)
Marital status - Widowed (%)
Marital status - Divorced (%)
Ancestries Reported - Arab (%)
Ancestries Reported - Czech (%)
Ancestries Reported - Danish (%)
Ancestries Reported - Dutch (%)
Ancestries Reported - English (%)
Ancestries Reported - French (%)
Ancestries Reported - French Canadian (%)
Ancestries Reported - German (%)
Ancestries Reported - Greek (%)
Ancestries Reported - Hungarian (%)
Ancestries Reported - Irish (%)
Ancestries Reported - Italian (%)
Ancestries Reported - Lithuanian (%)
Ancestries Reported - Norwegian (%)
Ancestries Reported - Polish (%)
Ancestries Reported - Portuguese (%)
Ancestries Reported - Russian (%)
Ancestries Reported - Scotch-Irish (%)
Ancestries Reported - Scottish (%)
Ancestries Reported - Slovak (%)
Ancestries Reported - Subsaharan African (%)
Ancestries Reported - Swedish (%)
Ancestries Reported - Swiss (%)
Ancestries Reported - Ukrainian (%)
Ancestries Reported - United States (%)
Ancestries Reported - Welsh (%)
Ancestries Reported - West Indian (%)
Ancestries Reported - Other (%)
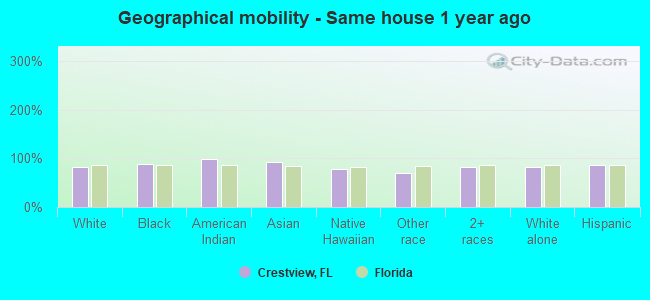
Geographical mobility - Same house 1 year ago (%)
Geographical mobility - Same house 1 year ago (%) - White
Geographical mobility - Same house 1 year ago (%) - Black or African American
Geographical mobility - Same house 1 year ago (%) - Asian
Geographical mobility - Same house 1 year ago (%) - Hispanic or Latino
Geographical mobility - Same house 1 year ago (%) - American Indian and Alaska Native
Geographical mobility - Same house 1 year ago (%) - Multirace
Geographical mobility - Same house 1 year ago (%) - Other Race
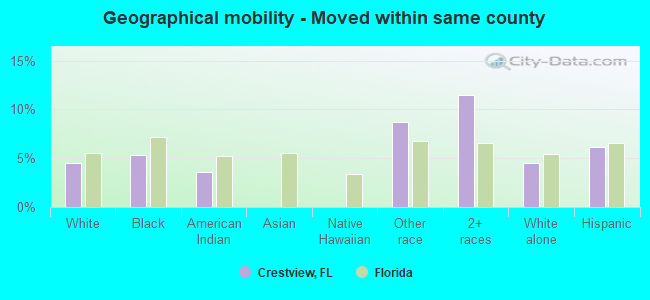
Geographical mobility - Moved within same county (%)
Geographical mobility - Moved within same county (%) - White
Geographical mobility - Moved within same county (%) - Black or African American
Geographical mobility - Moved within same county (%) - Asian
Geographical mobility - Moved within same county (%) - Hispanic or Latino
Geographical mobility - Moved within same county (%) - American Indian and Alaska Native
Geographical mobility - Moved within same county (%) - Multirace
Geographical mobility - Moved within same county (%) - Other Race
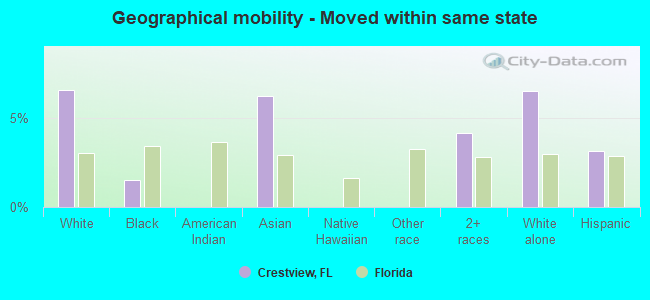
Geographical mobility - Moved from different county within same state (%)
Geographical mobility - Moved from different county within same state (%) - White
Geographical mobility - Moved from different county within same state (%) - Black or African American
Geographical mobility - Moved from different county within same state (%) - Asian
Geographical mobility - Moved from different county within same state (%) - Hispanic or Latino
Geographical mobility - Moved from different county within same state (%) - American Indian and Alaska Native
Geographical mobility - Moved from different county within same state (%) - Multirace
Geographical mobility - Moved from different county within same state (%) - Other Race
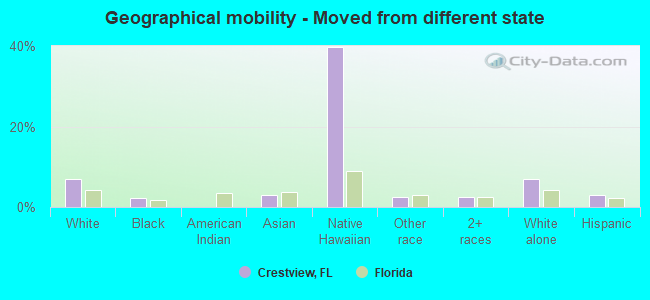
Geographical mobility - Moved from different state (%)
Geographical mobility - Moved from different state (%) - White
Geographical mobility - Moved from different state (%) - Black or African American
Geographical mobility - Moved from different state (%) - Asian
Geographical mobility - Moved from different state (%) - Hispanic or Latino
Geographical mobility - Moved from different state (%) - American Indian and Alaska Native
Geographical mobility - Moved from different state (%) - Multirace
Geographical mobility - Moved from different state (%) - Other Race
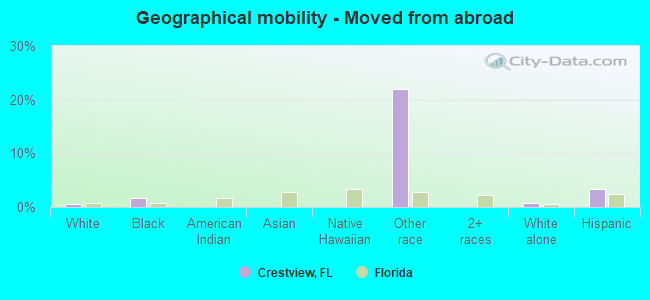
Geographical mobility - Moved from abroad (%)
Geographical mobility - Moved from abroad (%) - White
Geographical mobility - Moved from abroad (%) - Black or African American
Geographical mobility - Moved from abroad (%) - Asian
Geographical mobility - Moved from abroad (%) - Hispanic or Latino
Geographical mobility - Moved from abroad (%) - American Indian and Alaska Native
Geographical mobility - Moved from abroad (%) - Multirace
Geographical mobility - Moved from abroad (%) - Other Race
Place of birth for the foreign-born population - Ireland (%)
Place of birth for the foreign-born population - Denmark (%)
Place of birth for the foreign-born population - Norway (%)
Place of birth for the foreign-born population - Sweden (%)
Place of birth for the foreign-born population - United Kingdom (%)
Place of birth for the foreign-born population - England (%)
Place of birth for the foreign-born population - Scotland (%)
Place of birth for the foreign-born population - Other Northern Europe (%)
Place of birth for the foreign-born population - Austria (%)
Place of birth for the foreign-born population - Belgium (%)
Place of birth for the foreign-born population - France (%)
Place of birth for the foreign-born population - Germany (%)
Place of birth for the foreign-born population - Netherlands (%)
Place of birth for the foreign-born population - Switzerland (%)
Place of birth for the foreign-born population - Other Western Europe (%)
Place of birth for the foreign-born population - Greece (%)
Place of birth for the foreign-born population - Italy (%)
Place of birth for the foreign-born population - Portugal (%)
Place of birth for the foreign-born population - Spain (%)
Place of birth for the foreign-born population - Other Southern Europe (%)
Place of birth for the foreign-born population - Albania (%)
Place of birth for the foreign-born population - Belarus (%)
Place of birth for the foreign-born population - Bosnia and Herzegovina (%)
Place of birth for the foreign-born population - Bulgaria (%)
Place of birth for the foreign-born population - Croatia (%)
Place of birth for the foreign-born population - Czechoslovakia (%)
Place of birth for the foreign-born population - Hungary (%)
Place of birth for the foreign-born population - Latvia (%)
Place of birth for the foreign-born population - Lithuania (%)
Place of birth for the foreign-born population - North Macedonia (Macedonia) (%)
Place of birth for the foreign-born population - Moldova (%)
Place of birth for the foreign-born population - Poland (%)
Place of birth for the foreign-born population - Romania (%)
Place of birth for the foreign-born population - Russia (%)
Place of birth for the foreign-born population - Serbia (%)
Place of birth for the foreign-born population - Ukraine (%)
Place of birth for the foreign-born population - Other Eastern Europe (%)
Place of birth for the foreign-born population - China (%)
Place of birth for the foreign-born population - Hong Kong (%)
Place of birth for the foreign-born population - Taiwan (%)
Place of birth for the foreign-born population - Japan (%)
Place of birth for the foreign-born population - Korea (%)
Place of birth for the foreign-born population - Other Eastern Asia (%)
Place of birth for the foreign-born population - Afghanistan (%)
Place of birth for the foreign-born population - Bangladesh (%)
Place of birth for the foreign-born population - India (%)
Place of birth for the foreign-born population - Iran (%)
Place of birth for the foreign-born population - Kazakhstan (%)
Place of birth for the foreign-born population - Nepal (%)
Place of birth for the foreign-born population - Pakistan (%)
Place of birth for the foreign-born population - Sri Lanka (%)
Place of birth for the foreign-born population - Uzbekistan (%)
Place of birth for the foreign-born population - Other South Central Asia (%)
Place of birth for the foreign-born population - Burma (%)
Place of birth for the foreign-born population - Cambodia (%)
Place of birth for the foreign-born population - Indonesia (%)
Place of birth for the foreign-born population - Laos (%)
Place of birth for the foreign-born population - Malaysia (%)
Place of birth for the foreign-born population - Philippines (%)
Place of birth for the foreign-born population - Singapore (%)
Place of birth for the foreign-born population - Thailand (%)
Place of birth for the foreign-born population - Vietnam (%)
Place of birth for the foreign-born population - Other South Eastern Asia (%)
Place of birth for the foreign-born population - Armenia (%)
Place of birth for the foreign-born population - Iraq (%)
Place of birth for the foreign-born population - Israel (%)
Place of birth for the foreign-born population - Jordan (%)
Place of birth for the foreign-born population - Kuwait (%)
Place of birth for the foreign-born population - Lebanon (%)
Place of birth for the foreign-born population - Saudi Arabia (%)
Place of birth for the foreign-born population - Syria (%)
Place of birth for the foreign-born population - Turkey (%)
Place of birth for the foreign-born population - Yemen (%)
Place of birth for the foreign-born population - Other Western Asia (%)
Place of birth for the foreign-born population - Eritrea (%)
Place of birth for the foreign-born population - Ethiopia (%)
Place of birth for the foreign-born population - Kenya (%)
Place of birth for the foreign-born population - Somalia (%)
Place of birth for the foreign-born population - Uganda (%)
Place of birth for the foreign-born population - Zimbabwe (%)
Place of birth for the foreign-born population - Other Eastern Africa (%)
Place of birth for the foreign-born population - Cameroon (%)
Place of birth for the foreign-born population - Congo (%)
Place of birth for the foreign-born population - Democratic Republic of Congo (Zaire) (%)
Place of birth for the foreign-born population - Other Middle Africa (%)
Place of birth for the foreign-born population - Egypt (%)
Place of birth for the foreign-born population - Morocco (%)
Place of birth for the foreign-born population - Sudan (%)
Place of birth for the foreign-born population - Other Northern Africa (%)
Place of birth for the foreign-born population - South Africa (%)
Place of birth for the foreign-born population - Other Southern Africa (%)
Place of birth for the foreign-born population - Cabo Verde (%)
Place of birth for the foreign-born population - Ghana (%)
Place of birth for the foreign-born population - Liberia (%)
Place of birth for the foreign-born population - Nigeria (%)
Place of birth for the foreign-born population - Senegal (%)
Place of birth for the foreign-born population - Sierra Leone (%)
Place of birth for the foreign-born population - Other Western Africa (%)
Place of birth for the foreign-born population - Australia (%)
Place of birth for the foreign-born population - New Zealand (%)
Place of birth for the foreign-born population - Fiji (%)
Place of birth for the foreign-born population - Micronesia (%)
Place of birth for the foreign-born population - Bahamas (%)
Place of birth for the foreign-born population - Barbados (%)
Place of birth for the foreign-born population - Cuba (%)
Place of birth for the foreign-born population - Dominica (%)
Place of birth for the foreign-born population - Dominican Republic (%)
Place of birth for the foreign-born population - Grenada (%)
Place of birth for the foreign-born population - Haiti (%)
Place of birth for the foreign-born population - Jamaica (%)
Place of birth for the foreign-born population - St. Vincent and the Grenadines (%)
Place of birth for the foreign-born population - Trinidad and Tobago (%)
Place of birth for the foreign-born population - West Indies (%)
Place of birth for the foreign-born population - Other Caribbean (%)
Place of birth for the foreign-born population - Belize (%)
Place of birth for the foreign-born population - Costa Rica (%)
Place of birth for the foreign-born population - El Salvador (%)
Place of birth for the foreign-born population - Guatemala (%)
Place of birth for the foreign-born population - Honduras (%)
Place of birth for the foreign-born population - Mexico (%)
Place of birth for the foreign-born population - Nicaragua (%)
Place of birth for the foreign-born population - Panama (%)
Place of birth for the foreign-born population - Other Central America (%)
Place of birth for the foreign-born population - Argentina (%)
Place of birth for the foreign-born population - Bolivia (%)
Place of birth for the foreign-born population - Brazil (%)
Place of birth for the foreign-born population - Chile (%)
Place of birth for the foreign-born population - Colombia (%)
Place of birth for the foreign-born population - Ecuador (%)
Place of birth for the foreign-born population - Guyana (%)
Place of birth for the foreign-born population - Peru (%)
Place of birth for the foreign-born population - Uruguay (%)
Place of birth for the foreign-born population - Venezuela (%)
Place of birth for the foreign-born population - Other South America (%)
Place of birth for the foreign-born population - Canada (%)
Place of birth for the foreign-born population - Other Northern America (%)
Place of birth for the foreign-born population - Other (%)
Latest news about races in Crestview, FL collected exclusively by city-data.com from local newspapers, TV, and radio stations
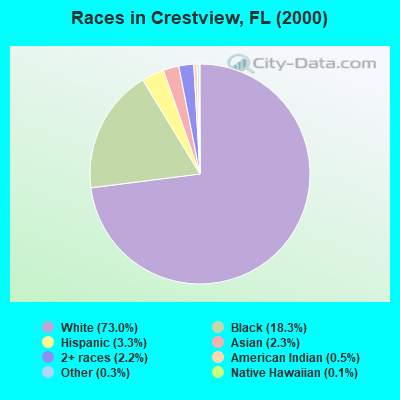
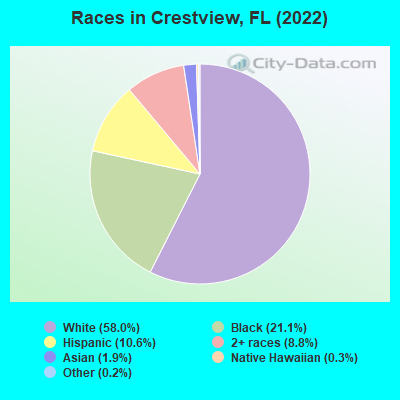
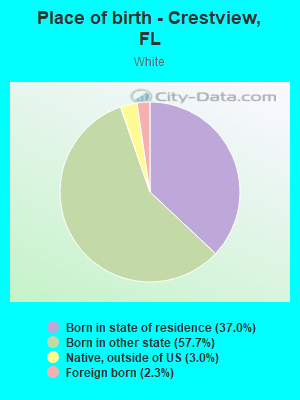
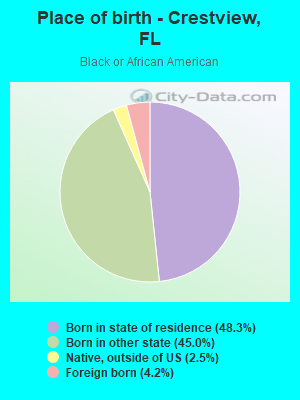
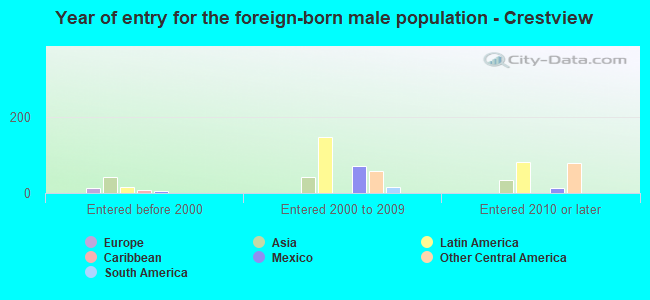
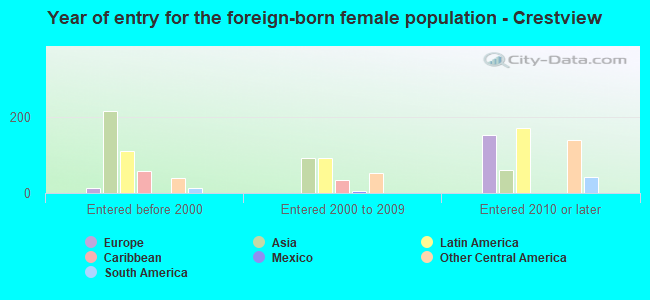
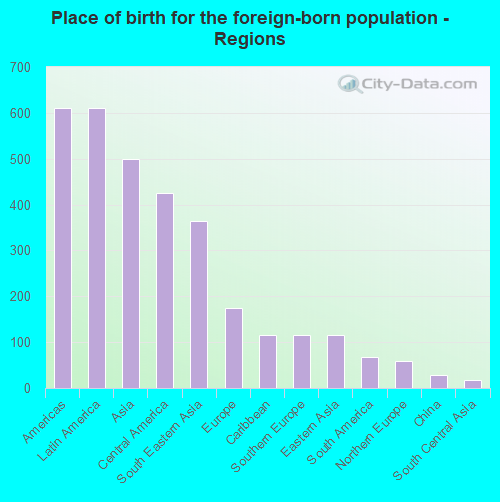
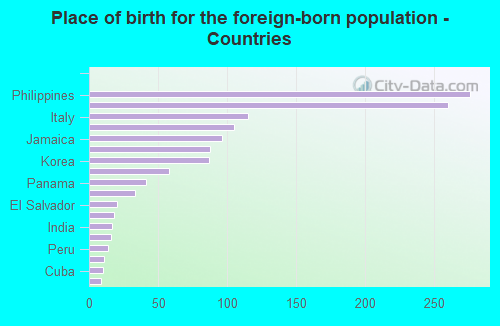
According to 2022 data, the most numerous races in Crestview, FL are White alone (16,245 residents), Hispanic (2,955 residents), and Black alone (5,899 residents). 93.4% of Crestview residents speak English at home. 4.6% of Crestview, FL residents are foreign-born (2.1% born in Latin America, 1.7% born in Asia, 0.6% born in Europe), which is 358.0% less than the foreign-born rate of 21.0% across the entire state of Florida.
Race distribution in Crestview
2000 2022
10,458,509 65.4% White alone 2,682,715 16.8% Hispanic 2,264,268 14.2% Black alone 261,693 1.6% Asian alone 236,954 1.5% Two or more races 42,358 0.3% American Indian alone 28,994 0.2% Other race alone 6,887 0.04% Native Hawaiian and Other
11,309,403 50.8% White alone 6,025,039 27.1% Hispanic 3,241,015 14.6% Black alone 861,630 3.9% Two or more races 623,692 2.8% Asian alone 152,054 0.7% Other race alone 22,504 0.1% American Indian alone 9,486 0.04% Native Hawaiian and Other
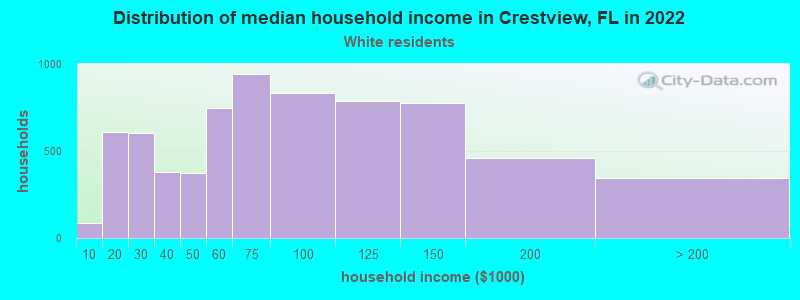
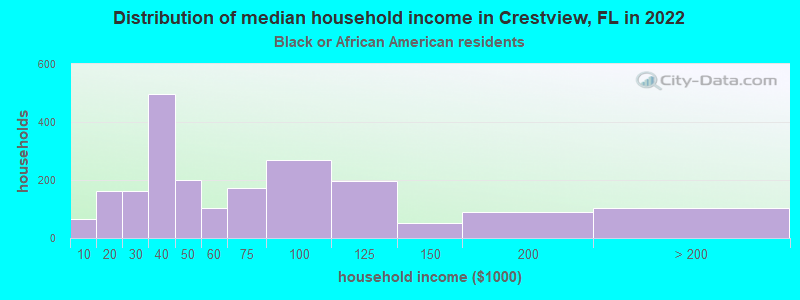
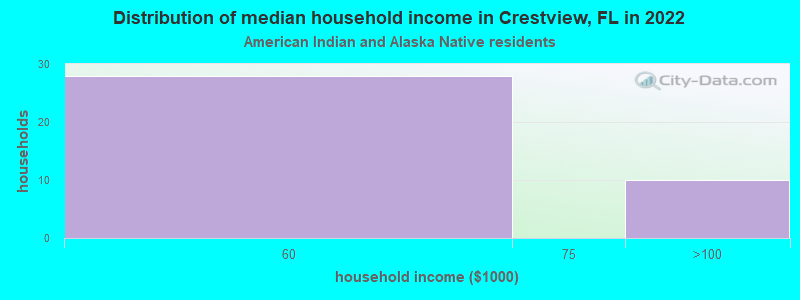
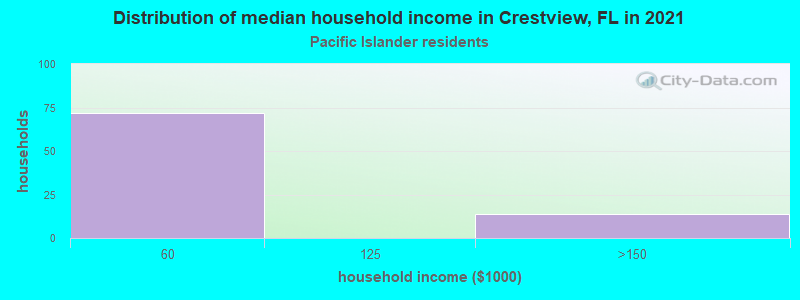
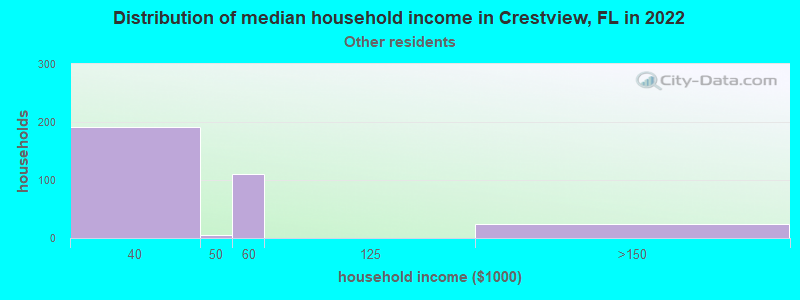
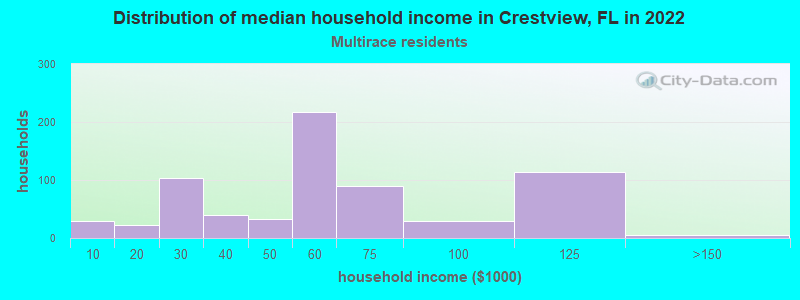
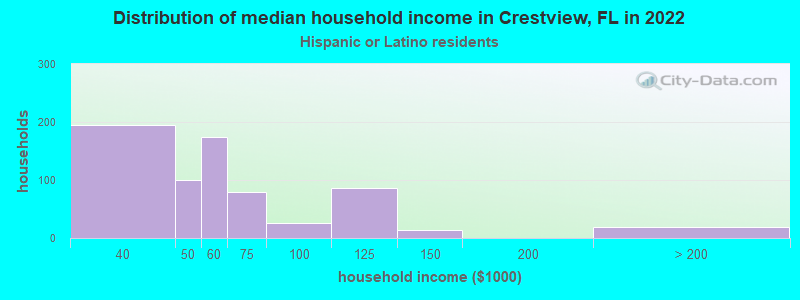
Income and house value in Crestview Median household income in 2022 $69,904 White non-Hispanic householders$58,380 Black householders$96,201 Asian householders$57,954 Native Hawaiian and other Pacific Islander householders$39,798 Some other race householders$51,895 Two or more races householders$54,181 Hispanic or Latino race householdersMedian 2022 house value $263,565 White Non-Hispanic householders$235,891 Black or African American householders$337,034 American Indian or Alaska Native householders $343,294 Asian householders$296,511 Some other race householders$266,201 Two or more races householders$302,111 Hispanic or Latino householders
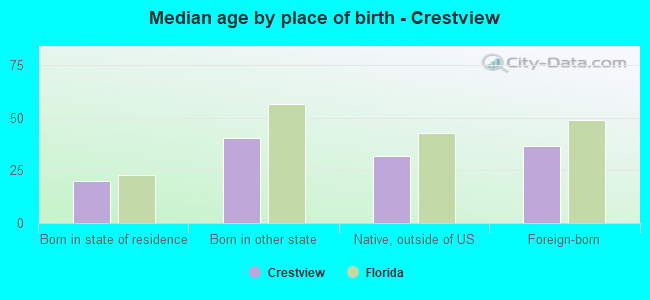
Median age by race in Crestview
34.8 Median age for White residents35.0 35.1 31.5 Median age for Black or African American residents26.6 31.9 14.2 Median age for American Indian / Alaska Native residents14.4 31.2 45.7 Median age for Asian residents45.1 54.2 22.8 Median age for Native Hawaiian / Pacific Islander residents23.1 -402,088,772.4 15.1 Median age for Other race residents20.7 6.6 21.0 Median age for Two or more races residents19.2 23.9 35.4 Median age for White alone residents35.1 35.8 23.5 Median age for Hispanic or Latino residents27.5 16.7
Owner/renter occupied households by race in Crestview
House owners and renters - White residents 4,965 70.4% Owner occupied2,085 29.6% Renter occupiedHouse owners and renters - Black or African American residents 1,100 48.6% Owner occupied1,162 51.4% Renter occupiedHouse owners and renters - American Indian / Alaska Native residents 40 100.0% Owner occupiedHouse owners and renters - Asian residents 165 73.3% Owner occupied60 26.7% Renter occupiedHouse owners and renters - Native Hawaiian / Pacific Islander residents 20 33.7% Owner occupied40 66.3% Renter occupiedHouse owners and renters - Other race residents 88 30.6% Owner occupied198 69.4% Renter occupiedHouse owners and renters - Two or more races residents 321 40.3% Owner occupied476 59.7% Renter occupiedHouse owners and renters - White alone residents 4,849 70.5% Owner occupied2,026 29.5% Renter occupiedHouse owners and renters - Hispanic or Latino residents 297 42.0% Owner occupied410 58.0% Renter occupied
Language usage in Crestview
English speakers - Total 93.4% of residents of Crestview speak English at home.
5.9% of residents speak Spanish at home 958 62.2% Speak English very well582 37.8% Speak English less than very well1.6% of residents speak other language at home 265 64.8% Speak English very well144 35.2% Speak English less than very well
English speakers - Born in the United States 98.0% of residents of Crestview speak English at home.
2.5% of residents speak Spanish at home 302 89.1% Speak English very well37 10.9% Speak English less than very well0.2% of residents speak other language at home 28 100.0% Speak English very well
English speakers - Native, born elsewhere 78.7% of residents of Crestview speak English at home.
22.0% of residents speak Spanish at home 287 90.5% Speak English very well30 9.5% Speak English less than very well
English speakers - Foreign-born 36.9% of residents of Crestview speak English at home.
42.3% of residents speak Spanish at home 25 5.0% Speak English very well473 95.0% Speak English less than very well27.1% of residents speak other language at home 189 59.2% Speak English very well130 40.8% Speak English less than very well
White (Caucasian) - Speak only English Native:
100.0% (15,770)Foreign-born:
10.7% (42)
White (Caucasian) - Speak another language Native:
0.9% (140)Foreign-born:
92.6% (362)
Black or African American - Speak only English Native:
95.6% (4,945)Foreign-born:
92.0% (92)
Black or African American - Speak another language Native:
4.3% (221)Foreign-born:
5.3% (5)
American Indian / Alaska Native - Speak another language Native:
100.0% (181)Foreign-born:
100.0% (13)
Asian - Speak only English Native:
100.0% (134)Foreign-born:
49.2% (228)
Asian - Speak another language Native:
13.7% (18)Foreign-born:
54.1% (250)
Other race - Speak only English Native:
12.5% (95)Foreign-born:
19.4% (30)
Other race - Speak another language Native:
100.0% (763)Foreign-born:
86.8% (134)
Two or more races - Speak another language Native:
5.3% (158)Foreign-born:
85.7% (29)
White alone - Speak only English Native:
99.8% (15,355)Foreign-born:
23.3% (24)
White alone - Speak another language Native:
0.7% (115)Foreign-born:
66.4% (69)
Hispanic or Latino - Speak only English Native:
58.8% (1,189)Foreign-born:
11.9% (59)
Hispanic or Latino - Speak another language Native:
41.1% (831)Foreign-born:
87.6% (433)
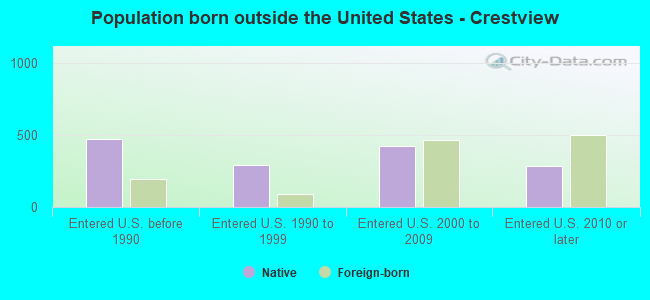
Foreign-born residents in Crestview 1,284 residents are foreign born (2.1% Latin America , 1.7% Asia , 0.6% Europe ).
This city:
4.6%Florida:
21.1%
Marital status for residents in Crestview Marital status - White (Caucasian) population 15 years and over
Males 31.2% Never married52.8% Now married2.4% Separated3.5% Widowed10.1% DivorcedFemales 23.5% Never married51.9% Now married2.1% Separated9.6% Widowed12.9% DivorcedWomen who gave birth in the past 12 months Now married:
59.9% (213)Unmarried:
40.1% (142)
Women who did not give birth in the past 12 months Now married:
56.1% (2,275)Unmarried:
43.9% (1,781)
Marital status - Black or African American population 15 years and over
Males 39.8% Never married35.0% Now married11.6% Separated0.0% Widowed13.7% DivorcedFemales 45.2% Never married38.8% Now married2.0% Separated3.2% Widowed10.8% DivorcedWomen who gave birth in the past 12 months Now married:
44.6% (38)Unmarried:
55.4% (47)
Women who did not give birth in the past 12 months Now married:
31.6% (574)Unmarried:
68.4% (1,241)
Marital status - American Indian / Alaska Native population 15 years and over
Males 43.5% Never married50.0% Now married0.0% Separated0.0% Widowed6.5% DivorcedFemales 0.0% Never married100.0% Now married0.0% Separated0.0% Widowed0.0% DivorcedWomen who did not give birth in the past 12 months Now married:
100.0% (57)Unmarried:
0.0% (0)
Marital status - Asian population 15 years and over
Males 42.7% Never married48.9% Now married8.4% Separated0.0% Widowed0.0% DivorcedFemales 9.3% Never married74.0% Now married0.0% Separated9.5% Widowed7.1% DivorcedWomen who gave birth in the past 12 months Now married:
100.0% (27)Unmarried:
0.0% (0)
Women who did not give birth in the past 12 months Now married:
57.1% (79)Unmarried:
42.9% (59)
Marital status - Native Hawaiian / Pacific Islander population 15 years and over
Males 27.0% Never married73.0% Now married0.0% Separated0.0% Widowed0.0% DivorcedFemales 0.0% Never married100.0% Now married0.0% Separated0.0% Widowed0.0% DivorcedWomen who did not give birth in the past 12 months Now married:
100.0% (37)Unmarried:
0.0% (0)
Marital status - Other race population 15 years and over
Males 45.2% Never married33.0% Now married20.6% Separated0.0% Widowed1.3% DivorcedFemales 0.0% Never married90.1% Now married0.0% Separated5.5% Widowed4.4% DivorcedWomen who did not give birth in the past 12 months Now married:
100.0% (105)Unmarried:
0.0% (0)
Marital status - Two or more races population 15 years and over
Males 66.3% Never married25.7% Now married0.6% Separated0.0% Widowed7.5% DivorcedFemales 49.0% Never married32.7% Now married5.4% Separated0.7% Widowed12.2% DivorcedWomen who gave birth in the past 12 months Now married:
0.0% (0)Unmarried:
100.0% (4)
Women who did not give birth in the past 12 months Now married:
31.2% (232)Unmarried:
68.8% (512)
Marital status - White alone, not Hispanic / Latino population 15 years and over
Males 31.8% Never married53.3% Now married2.5% Separated3.7% Widowed8.6% DivorcedFemales 23.1% Never married51.2% Now married2.2% Separated10.0% Widowed13.4% DivorcedWomen who gave birth in the past 12 months Now married:
60.8% (152)Unmarried:
39.2% (98)
Women who did not give birth in the past 12 months Now married:
55.6% (2,178)Unmarried:
44.4% (1,737)
Marital status - Hispanic or Latino population 15 years and over
Males 40.3% Never married35.8% Now married7.6% Separated0.0% Widowed16.3% DivorcedFemales 34.0% Never married64.7% Now married0.0% Separated0.7% Widowed0.6% DivorcedWomen who gave birth in the past 12 months Now married:
57.9% (65)Unmarried:
42.1% (47)
Women who did not give birth in the past 12 months Now married:
62.6% (324)Unmarried:
37.4% (194)
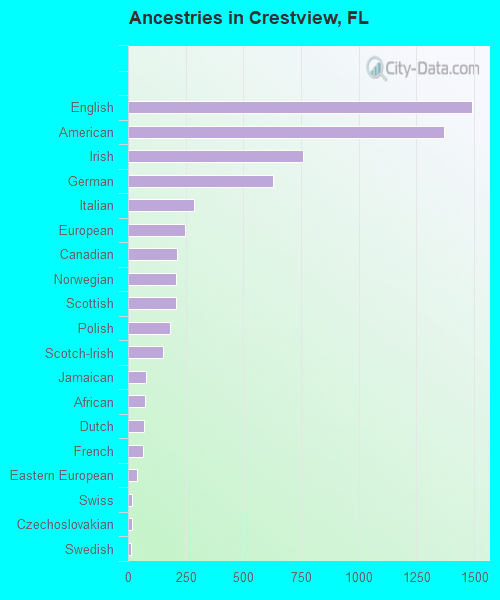
Ancestries in Crestview
1,490 11.5% English1,368 10.6% American759 5.9% Irish628 4.9% German287 2.2% Italian249 1.9% European213 1.6% Canadian209 1.6% Norwegian208 1.6% Scottish180 1.4% Polish152 1.2% Scotch-Irish79 0.6% Jamaican74 0.6% African69 0.5% Dutch65 0.5% French38 0.3% Eastern European18 0.1% Swiss16 0.1% Czechoslovakian15 0.1% Swedish10 0.08% French Canadian5 0.04% Haitian4 0.03% Greek
Geographical mobility in Crestview Same house 1 year ago 13,853 81.6% White (Caucasian)5,216 88.7% Black or African American225 98.4% American Indian / Alaska Native604 91.7% Asian110 79.0% Native Hawaiian / Pacific Islander911 70.7% Other race2,502 81.6% Two or more races13,178 81.7% White alone, not Hispanic / Latino2,401 85.4% Hispanic or LatinoMoved within same county 770 4.5% White / Caucasian312 5.3% Black or African American8 3.6% American Indian / Alaska Native113 8.7% Other race351 11.4% Two or more races736 4.6% White alone, not Hispanic / Latino172 6.1% Hispanic or LatinoMoved within same state 1,110 6.5% White / Caucasian88 1.5% Black or African American41 6.2% Asian127 4.1% Two or more races1,048 6.5% White alone, not Hispanic / Latino87 3.1% Hispanic or LatinoMoved from different state 1,191 7.0% White / Caucasian139 2.4% Black or African American19 2.9% Asian55 39.8% Native Hawaiian / Pacific Islander30 2.4% Other race77 2.5% Two or more races1,109 6.9% White alone, not Hispanic / Latino86 3.1% Hispanic or LatinoMoved from abroad 109 0.6% White104 1.8% Black or African American283 22.0% Other race123 0.8% White alone, not Hispanic / Latino95 3.4% Hispanic or Latino
Children Nativity (place of birth) in Crestview
Children under 6 years - Living with two parents Both parents native 947 100.0% NativeBoth parents foreign-born 10 100.0% NativeOne native, one foreign-born parent 347 100.0% NativeChildren under 6 years - Living with one parent Native parent 640 100.0% NativeForeign-born parent 258 100.0% NativeChildren 6 to 17 years - Living with two parents Both parents native 2,678 100.0% NativeBoth parents foreign-born 18 100.0% NativeOne native, one foreign-born parent 466 100.0% NativeChildren 6 to 17 years - Living with one parent Native parent 632 100.0% NativeForeign-born parent 695 52.5% Native630 47.5% Foreign-born
Grandparents responsible for own grandchildren in Crestview
Grandparents (30 to 59 years) White / Caucasian 117 25.2% Responsible for grandchildren347 74.8% Not responsible for grandchildrenBlack or African American 35 46.9% Responsible for grandchildren40 53.1% Not responsible for grandchildrenWhite alone, not Hispanic / Latino 117 59.3% Responsible for grandchildren80 40.7% Not responsible for grandchildrenHispanic or Latino 108 100.0% Not responsible for grandchildrenGrandparents (60 years and over) White / Caucasian 42 37.0% Responsible for grandchildren71 63.0% Not responsible for grandchildrenBlack or African American 36 100.0% Not responsible for grandchildrenWhite alone, not Hispanic / Latino 42 37.0% Responsible for grandchildren71 63.0% Not responsible for grandchildren