Races in Crestwood, Missouri (MO) Detailed Stats
Data:
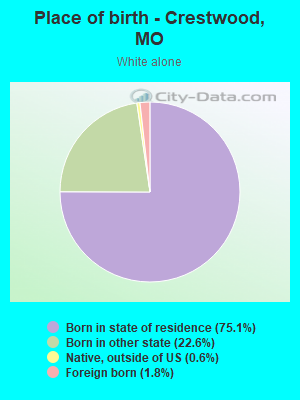
Races - White alone (%)
Races - White alone (% change since 2000)
Races - Black alone (%)
Races - Black alone (% change since 2000)
Races - American Indian alone (%)
Races - American Indian alone (% change since 2000)
Races - Asian alone (%)
Races - Asian alone (% change since 2000)
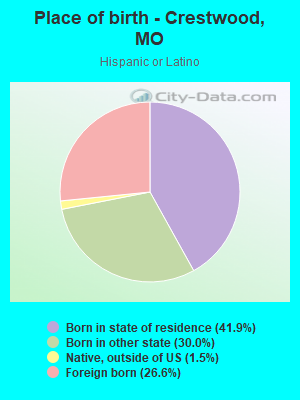
Races - Hispanic (%)
Races - Hispanic (% change since 2000)
Races - Native Hawaiian and Other Pacific Islander alone (%)
Races - Native Hawaiian and Other Pacific Islander alone (% change since 2000)
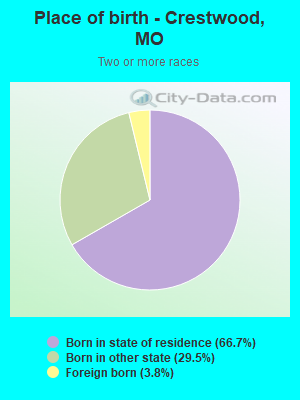
Races - Two or more races(%)
Races - Two or more races(% change since 2000)
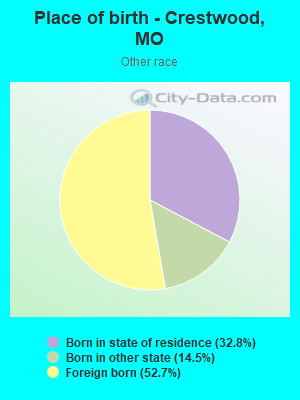
Races - Other race alone (%)
Races - Other race alone (% change since 2000)
Racial diversity
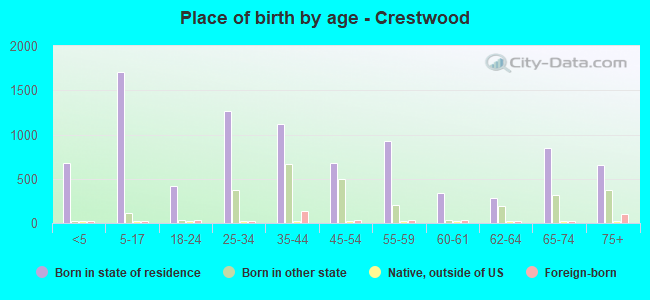
Place of birth - Born in state of residence (%)
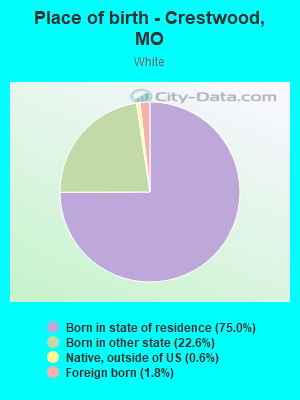
Place of birth - Born in state of residence (%) - White
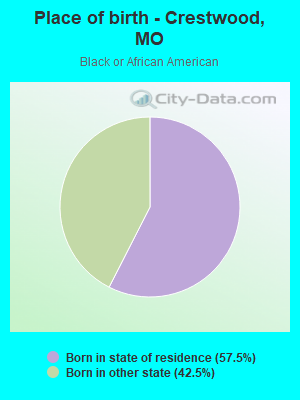
Place of birth - Born in state of residence (%) - Black or African American
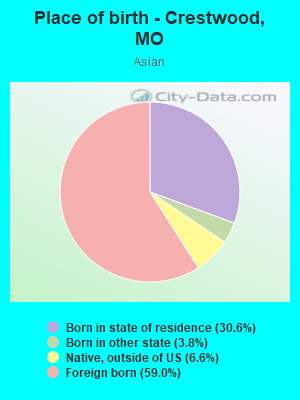
Place of birth - Born in state of residence (%) - Asian
Place of birth - Born in state of residence (%) - Hispanic or Latino
Place of birth - Born in state of residence (%) - American Indian and Alaska Native
Place of birth - Born in state of residence (%) - Multirace
Place of birth - Born in state of residence (%) - Other Race
Place of birth - Born in other state (%)
Place of birth - Born in other state (%) - White
Place of birth - Born in other state (%) - Black or African American
Place of birth - Born in other state (%) - Asian
Place of birth - Born in other state (%) - Hispanic or Latino
Place of birth - Born in other state (%) - American Indian and Alaska Native
Place of birth - Born in other state (%) - Multirace
Place of birth - Born in other state (%) - Other Race
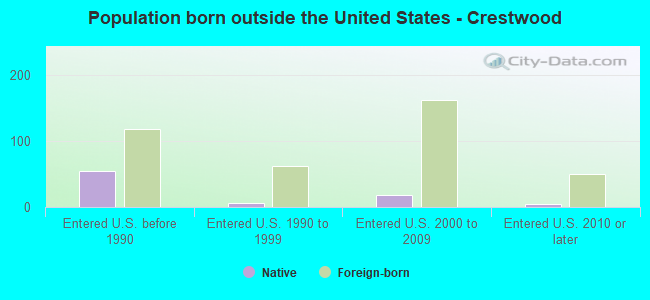
Place of birth - Native, outside of US (%)
Place of birth - Native, outside of US (%) - White
Place of birth - Native, outside of US (%) - Black or African American
Place of birth - Native, outside of US (%) - Asian
Place of birth - Native, outside of US (%) - Hispanic or Latino
Place of birth - Native, outside of US (%) - American Indian and Alaska Native
Place of birth - Native, outside of US (%) - Multirace
Place of birth - Native, outside of US (%) - Other Race
Place of birth - Foreign born (%)
Place of birth - Foreign born (%) - White
Place of birth - Foreign born (%) - Black or African American
Place of birth - Foreign born (%) - Asian
Place of birth - Foreign born (%) - Hispanic or Latino
Place of birth - Foreign born (%) - American Indian and Alaska Native
Place of birth - Foreign born (%) - Multirace
Place of birth - Foreign born (%) - Other Race
Residents speaking English at home (%)
Residents speaking English at home - Born in the United States (%)
Residents speaking English at home - Native, born elsewhere (%)
Residents speaking English at home - Foreign born (%)
Residents speaking Spanish at home (%)
Residents speaking Spanish at home - Born in the United States (%)
Residents speaking Spanish at home - Native, born elsewhere (%)
Residents speaking Spanish at home - Foreign born (%)
Residents speaking other language at home (%)
Residents speaking other language at home - Born in the United States (%)
Residents speaking other language at home - Native, born elsewhere (%)
Residents speaking other language at home - Foreign born (%)
Marital status - Never married (%)
Marital status - Now married (%)
Marital status - Separated (%)
Marital status - Widowed (%)
Marital status - Divorced (%)
Ancestries Reported - Arab (%)
Ancestries Reported - Czech (%)
Ancestries Reported - Danish (%)
Ancestries Reported - Dutch (%)
Ancestries Reported - English (%)
Ancestries Reported - French (%)
Ancestries Reported - French Canadian (%)
Ancestries Reported - German (%)
Ancestries Reported - Greek (%)
Ancestries Reported - Hungarian (%)
Ancestries Reported - Irish (%)
Ancestries Reported - Italian (%)
Ancestries Reported - Lithuanian (%)
Ancestries Reported - Norwegian (%)
Ancestries Reported - Polish (%)
Ancestries Reported - Portuguese (%)
Ancestries Reported - Russian (%)
Ancestries Reported - Scotch-Irish (%)
Ancestries Reported - Scottish (%)
Ancestries Reported - Slovak (%)
Ancestries Reported - Subsaharan African (%)
Ancestries Reported - Swedish (%)
Ancestries Reported - Swiss (%)
Ancestries Reported - Ukrainian (%)
Ancestries Reported - United States (%)
Ancestries Reported - Welsh (%)
Ancestries Reported - West Indian (%)
Ancestries Reported - Other (%)
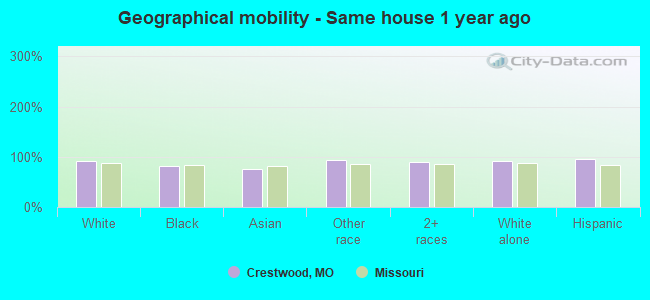
Geographical mobility - Same house 1 year ago (%)
Geographical mobility - Same house 1 year ago (%) - White
Geographical mobility - Same house 1 year ago (%) - Black or African American
Geographical mobility - Same house 1 year ago (%) - Asian
Geographical mobility - Same house 1 year ago (%) - Hispanic or Latino
Geographical mobility - Same house 1 year ago (%) - American Indian and Alaska Native
Geographical mobility - Same house 1 year ago (%) - Multirace
Geographical mobility - Same house 1 year ago (%) - Other Race
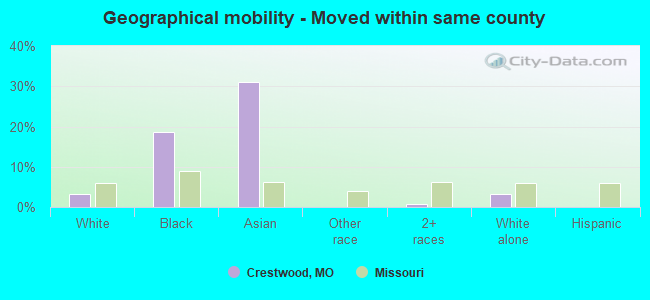
Geographical mobility - Moved within same county (%)
Geographical mobility - Moved within same county (%) - White
Geographical mobility - Moved within same county (%) - Black or African American
Geographical mobility - Moved within same county (%) - Asian
Geographical mobility - Moved within same county (%) - Hispanic or Latino
Geographical mobility - Moved within same county (%) - American Indian and Alaska Native
Geographical mobility - Moved within same county (%) - Multirace
Geographical mobility - Moved within same county (%) - Other Race
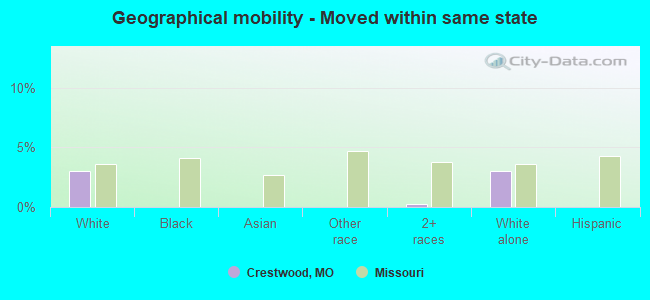
Geographical mobility - Moved from different county within same state (%)
Geographical mobility - Moved from different county within same state (%) - White
Geographical mobility - Moved from different county within same state (%) - Black or African American
Geographical mobility - Moved from different county within same state (%) - Asian
Geographical mobility - Moved from different county within same state (%) - Hispanic or Latino
Geographical mobility - Moved from different county within same state (%) - American Indian and Alaska Native
Geographical mobility - Moved from different county within same state (%) - Multirace
Geographical mobility - Moved from different county within same state (%) - Other Race
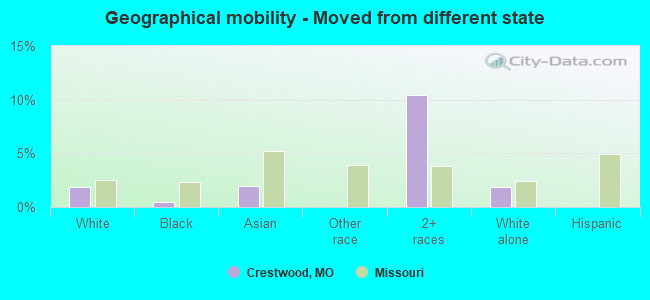
Geographical mobility - Moved from different state (%)
Geographical mobility - Moved from different state (%) - White
Geographical mobility - Moved from different state (%) - Black or African American
Geographical mobility - Moved from different state (%) - Asian
Geographical mobility - Moved from different state (%) - Hispanic or Latino
Geographical mobility - Moved from different state (%) - American Indian and Alaska Native
Geographical mobility - Moved from different state (%) - Multirace
Geographical mobility - Moved from different state (%) - Other Race
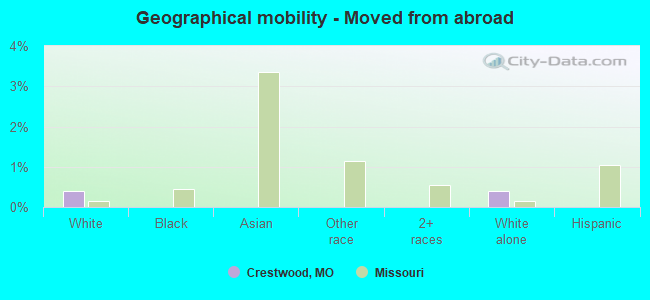
Geographical mobility - Moved from abroad (%)
Geographical mobility - Moved from abroad (%) - White
Geographical mobility - Moved from abroad (%) - Black or African American
Geographical mobility - Moved from abroad (%) - Asian
Geographical mobility - Moved from abroad (%) - Hispanic or Latino
Geographical mobility - Moved from abroad (%) - American Indian and Alaska Native
Geographical mobility - Moved from abroad (%) - Multirace
Geographical mobility - Moved from abroad (%) - Other Race
Place of birth for the foreign-born population - Ireland (%)
Place of birth for the foreign-born population - Denmark (%)
Place of birth for the foreign-born population - Norway (%)
Place of birth for the foreign-born population - Sweden (%)
Place of birth for the foreign-born population - United Kingdom (%)
Place of birth for the foreign-born population - England (%)
Place of birth for the foreign-born population - Scotland (%)
Place of birth for the foreign-born population - Other Northern Europe (%)
Place of birth for the foreign-born population - Austria (%)
Place of birth for the foreign-born population - Belgium (%)
Place of birth for the foreign-born population - France (%)
Place of birth for the foreign-born population - Germany (%)
Place of birth for the foreign-born population - Netherlands (%)
Place of birth for the foreign-born population - Switzerland (%)
Place of birth for the foreign-born population - Other Western Europe (%)
Place of birth for the foreign-born population - Greece (%)
Place of birth for the foreign-born population - Italy (%)
Place of birth for the foreign-born population - Portugal (%)
Place of birth for the foreign-born population - Spain (%)
Place of birth for the foreign-born population - Other Southern Europe (%)
Place of birth for the foreign-born population - Albania (%)
Place of birth for the foreign-born population - Belarus (%)
Place of birth for the foreign-born population - Bosnia and Herzegovina (%)
Place of birth for the foreign-born population - Bulgaria (%)
Place of birth for the foreign-born population - Croatia (%)
Place of birth for the foreign-born population - Czechoslovakia (%)
Place of birth for the foreign-born population - Hungary (%)
Place of birth for the foreign-born population - Latvia (%)
Place of birth for the foreign-born population - Lithuania (%)
Place of birth for the foreign-born population - North Macedonia (Macedonia) (%)
Place of birth for the foreign-born population - Moldova (%)
Place of birth for the foreign-born population - Poland (%)
Place of birth for the foreign-born population - Romania (%)
Place of birth for the foreign-born population - Russia (%)
Place of birth for the foreign-born population - Serbia (%)
Place of birth for the foreign-born population - Ukraine (%)
Place of birth for the foreign-born population - Other Eastern Europe (%)
Place of birth for the foreign-born population - China (%)
Place of birth for the foreign-born population - Hong Kong (%)
Place of birth for the foreign-born population - Taiwan (%)
Place of birth for the foreign-born population - Japan (%)
Place of birth for the foreign-born population - Korea (%)
Place of birth for the foreign-born population - Other Eastern Asia (%)
Place of birth for the foreign-born population - Afghanistan (%)
Place of birth for the foreign-born population - Bangladesh (%)
Place of birth for the foreign-born population - India (%)
Place of birth for the foreign-born population - Iran (%)
Place of birth for the foreign-born population - Kazakhstan (%)
Place of birth for the foreign-born population - Nepal (%)
Place of birth for the foreign-born population - Pakistan (%)
Place of birth for the foreign-born population - Sri Lanka (%)
Place of birth for the foreign-born population - Uzbekistan (%)
Place of birth for the foreign-born population - Other South Central Asia (%)
Place of birth for the foreign-born population - Burma (%)
Place of birth for the foreign-born population - Cambodia (%)
Place of birth for the foreign-born population - Indonesia (%)
Place of birth for the foreign-born population - Laos (%)
Place of birth for the foreign-born population - Malaysia (%)
Place of birth for the foreign-born population - Philippines (%)
Place of birth for the foreign-born population - Singapore (%)
Place of birth for the foreign-born population - Thailand (%)
Place of birth for the foreign-born population - Vietnam (%)
Place of birth for the foreign-born population - Other South Eastern Asia (%)
Place of birth for the foreign-born population - Armenia (%)
Place of birth for the foreign-born population - Iraq (%)
Place of birth for the foreign-born population - Israel (%)
Place of birth for the foreign-born population - Jordan (%)
Place of birth for the foreign-born population - Kuwait (%)
Place of birth for the foreign-born population - Lebanon (%)
Place of birth for the foreign-born population - Saudi Arabia (%)
Place of birth for the foreign-born population - Syria (%)
Place of birth for the foreign-born population - Turkey (%)
Place of birth for the foreign-born population - Yemen (%)
Place of birth for the foreign-born population - Other Western Asia (%)
Place of birth for the foreign-born population - Eritrea (%)
Place of birth for the foreign-born population - Ethiopia (%)
Place of birth for the foreign-born population - Kenya (%)
Place of birth for the foreign-born population - Somalia (%)
Place of birth for the foreign-born population - Uganda (%)
Place of birth for the foreign-born population - Zimbabwe (%)
Place of birth for the foreign-born population - Other Eastern Africa (%)
Place of birth for the foreign-born population - Cameroon (%)
Place of birth for the foreign-born population - Congo (%)
Place of birth for the foreign-born population - Democratic Republic of Congo (Zaire) (%)
Place of birth for the foreign-born population - Other Middle Africa (%)
Place of birth for the foreign-born population - Egypt (%)
Place of birth for the foreign-born population - Morocco (%)
Place of birth for the foreign-born population - Sudan (%)
Place of birth for the foreign-born population - Other Northern Africa (%)
Place of birth for the foreign-born population - South Africa (%)
Place of birth for the foreign-born population - Other Southern Africa (%)
Place of birth for the foreign-born population - Cabo Verde (%)
Place of birth for the foreign-born population - Ghana (%)
Place of birth for the foreign-born population - Liberia (%)
Place of birth for the foreign-born population - Nigeria (%)
Place of birth for the foreign-born population - Senegal (%)
Place of birth for the foreign-born population - Sierra Leone (%)
Place of birth for the foreign-born population - Other Western Africa (%)
Place of birth for the foreign-born population - Australia (%)
Place of birth for the foreign-born population - New Zealand (%)
Place of birth for the foreign-born population - Fiji (%)
Place of birth for the foreign-born population - Micronesia (%)
Place of birth for the foreign-born population - Bahamas (%)
Place of birth for the foreign-born population - Barbados (%)
Place of birth for the foreign-born population - Cuba (%)
Place of birth for the foreign-born population - Dominica (%)
Place of birth for the foreign-born population - Dominican Republic (%)
Place of birth for the foreign-born population - Grenada (%)
Place of birth for the foreign-born population - Haiti (%)
Place of birth for the foreign-born population - Jamaica (%)
Place of birth for the foreign-born population - St. Vincent and the Grenadines (%)
Place of birth for the foreign-born population - Trinidad and Tobago (%)
Place of birth for the foreign-born population - West Indies (%)
Place of birth for the foreign-born population - Other Caribbean (%)
Place of birth for the foreign-born population - Belize (%)
Place of birth for the foreign-born population - Costa Rica (%)
Place of birth for the foreign-born population - El Salvador (%)
Place of birth for the foreign-born population - Guatemala (%)
Place of birth for the foreign-born population - Honduras (%)
Place of birth for the foreign-born population - Mexico (%)
Place of birth for the foreign-born population - Nicaragua (%)
Place of birth for the foreign-born population - Panama (%)
Place of birth for the foreign-born population - Other Central America (%)
Place of birth for the foreign-born population - Argentina (%)
Place of birth for the foreign-born population - Bolivia (%)
Place of birth for the foreign-born population - Brazil (%)
Place of birth for the foreign-born population - Chile (%)
Place of birth for the foreign-born population - Colombia (%)
Place of birth for the foreign-born population - Ecuador (%)
Place of birth for the foreign-born population - Guyana (%)
Place of birth for the foreign-born population - Peru (%)
Place of birth for the foreign-born population - Uruguay (%)
Place of birth for the foreign-born population - Venezuela (%)
Place of birth for the foreign-born population - Other South America (%)
Place of birth for the foreign-born population - Canada (%)
Place of birth for the foreign-born population - Other Northern America (%)
Place of birth for the foreign-born population - Other (%)
Latest news about races in Crestwood, MO collected exclusively by city-data.com from local newspapers, TV, and radio stations
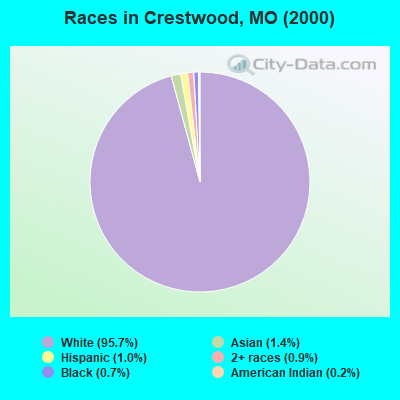
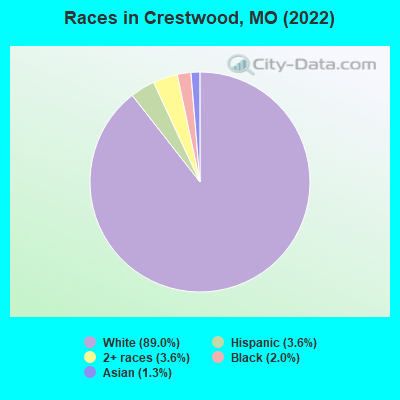
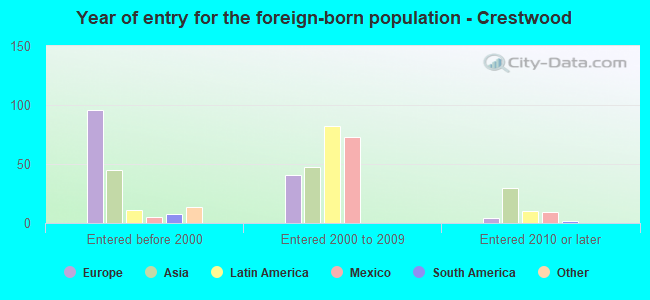
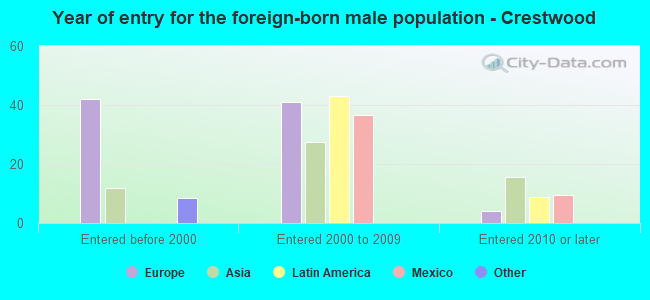
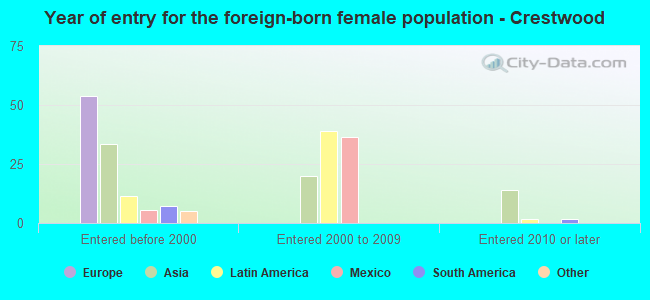
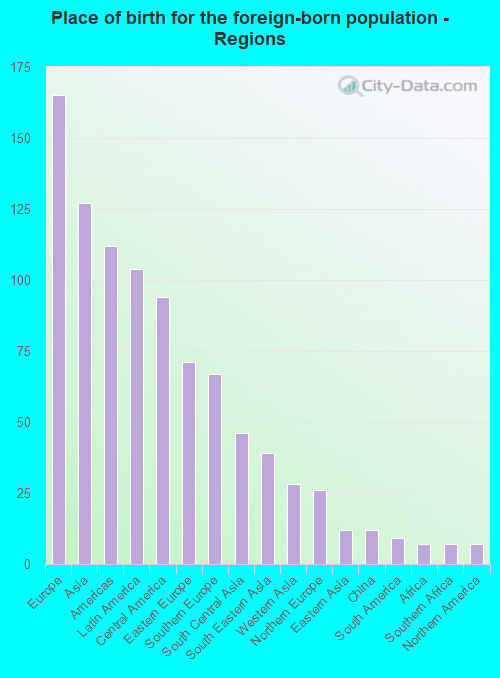
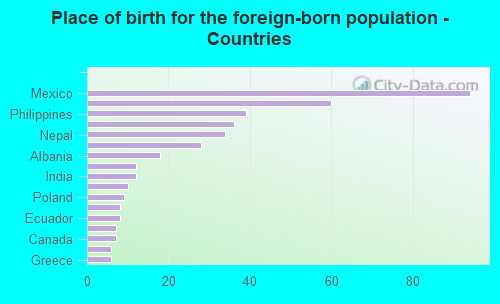
According to 2022 data, the most numerous races in Crestwood, MO are White alone (10,854 residents), Black alone (244 residents), and Two or more races (437 residents). 95.0% of Crestwood residents speak English at home. 3.4% of Crestwood, MO residents are foreign-born (1.4% born in Europe, 1.0% born in Asia, 0.9% born in Latin America), which is 18.5% less than the foreign-born rate of 4.0% across the entire state of Missouri.
Race distribution in Crestwood
2000 2022
4,686,474 83.8% White alone 625,667 11.2% Black alone 118,592 2.1% Hispanic 71,905 1.3% Two or more races 61,041 1.1% Asian alone 23,302 0.4% American Indian alone 5,291 0.09% Other race alone 2,939 0.05% Native Hawaiian and Other
4,733,411 76.6% White alone 656,739 10.6% Black alone 316,300 5.1% Two or more races 291,763 4.7% Hispanic 132,436 2.1% Asian alone 27,467 0.4% Other race alone 12,313 0.2% American Indian alone 7,528 0.1% Native Hawaiian and Other
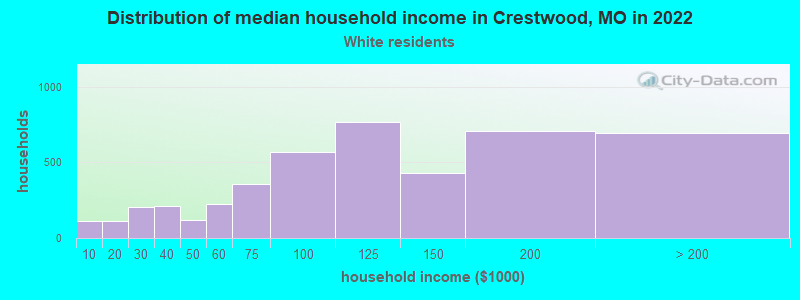
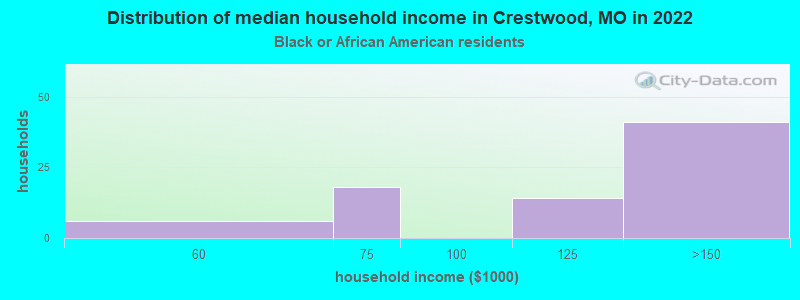
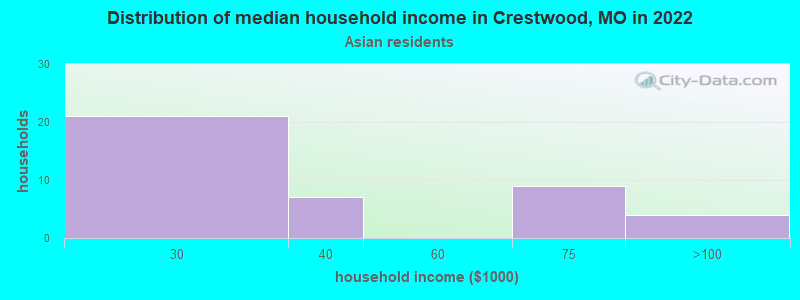
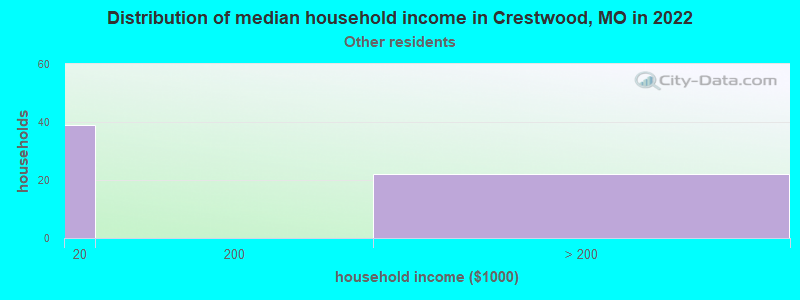
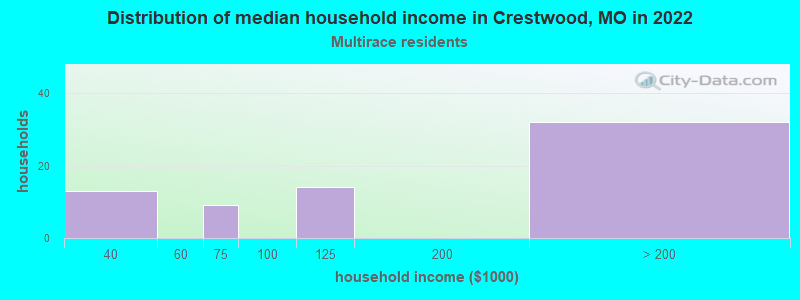
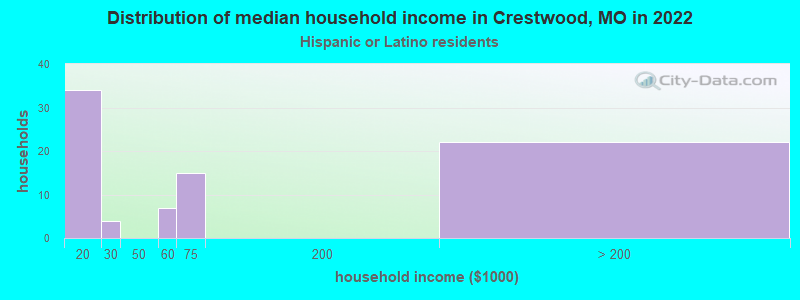
Income and house value in Crestwood Median household income in 2022 $114,930 White non-Hispanic householders$113,261 Black householders$26,141 Asian householders$197,715 Two or more races householdersMedian 2022 house value $290,269 White Non-Hispanic householders$252,879 Black or African American householders$71,903 American Indian or Alaska Native householders $210,843 Asian householders$302,216 Two or more races householders$190,931 Hispanic or Latino householders
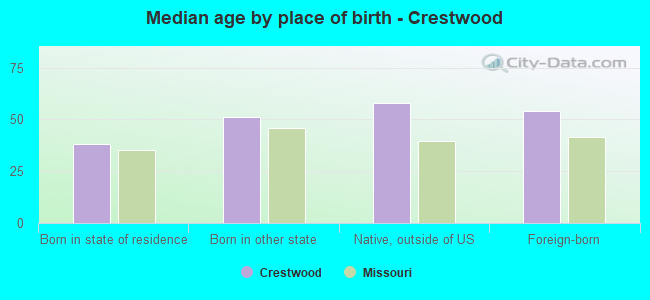
Median age by race in Crestwood
43.5 Median age for White residents42.7 44.8 30.2 Median age for Black or African American residents30.5 15.9 -520,187,792.9 Median age for American Indian / Alaska Native residents-644,003,776.5 -505,494,505.0 34.1 Median age for Asian residents32.4 56.5 -710,303,029.6 Median age for Native Hawaiian / Pacific Islander residents-1,449,781,657.9 -752,136,751.4 34.8 Median age for Other race residents36.0 35.4 14.0 Median age for Two or more races residents13.8 14.2 43.9 Median age for White alone residents42.7 45.8 29.9 Median age for Hispanic or Latino residents34.8 29.2
Owner/renter occupied households by race in Crestwood
House owners and renters - White residents 3,974 88.8% Owner occupied502 11.2% Renter occupiedHouse owners and renters - Black or African American residents 77 100.0% Owner occupiedHouse owners and renters - Asian residents 19 36.5% Owner occupied34 63.5% Renter occupiedHouse owners and renters - Other race residents 8 14.4% Owner occupied46 85.6% Renter occupiedHouse owners and renters - Two or more races residents 55 86.9% Owner occupied8 13.1% Renter occupiedHouse owners and renters - White alone residents 3,965 88.6% Owner occupied509 11.4% Renter occupiedHouse owners and renters - Hispanic or Latino residents 40 43.9% Owner occupied52 56.1% Renter occupied
Language usage in Crestwood
English speakers - Total 95.0% of residents of Crestwood speak English at home.
2.3% of residents speak Spanish at home 161 61.9% Speak English very well99 38.1% Speak English less than very well2.7% of residents speak other language at home 217 71.1% Speak English very well88 28.9% Speak English less than very well
English speakers - Born in the United States 97.6% of residents of Crestwood speak English at home.
1.8% of residents speak Spanish at home 51 100.0% Speak English very well0.2% of residents speak other language at home 6 100.0% Speak English very well
English speakers - Native, born elsewhere 94.8% of residents of Crestwood speak English at home.
13.0% of residents speak other language at home 10 100.0% Speak English less than very well
English speakers - Foreign-born 23.0% of residents of Crestwood speak English at home.
29.9% of residents speak Spanish at home 15 12.0% Speak English very well110 88.0% Speak English less than very well51.0% of residents speak other language at home 139 65.3% Speak English very well74 34.7% Speak English less than very well
White (Caucasian) - Speak only English Native:
98.8% (10,102)Foreign-born:
19.4% (38)
White (Caucasian) - Speak another language Native:
1.2% (127)Foreign-born:
81.2% (160)
Asian - Speak only English Native:
71.0% (47)Foreign-born:
53.8% (54)
Asian - Speak another language Native:
32.9% (22)Foreign-born:
56.7% (56)
Other race - Speak another language Native:
32.2% (22)Foreign-born:
90.6% (77)
Two or more races - Speak another language Native:
15.0% (71)Foreign-born:
100.0% (21)
White alone - Speak only English Native:
99.0% (9,986)Foreign-born:
20.1% (39)
White alone - Speak another language Native:
1.0% (100)Foreign-born:
80.6% (157)
Hispanic or Latino - Speak another language Native:
30.7% (100)Foreign-born:
100.0% (118)
Foreign-born residents in Crestwood 412 residents are foreign born (1.4% Europe , 1.0% Asia , 0.9% Latin America ).
This city:
3.4%Missouri:
4.2%
Marital status for residents in Crestwood Marital status - White (Caucasian) population 15 years and over
Males 21.3% Never married66.6% Now married1.2% Separated1.1% Widowed9.8% DivorcedFemales 18.1% Never married61.5% Now married3.5% Separated7.5% Widowed9.4% DivorcedWomen who gave birth in the past 12 months Now married:
98.6% (70)Unmarried:
1.4% (1)
Women who did not give birth in the past 12 months Now married:
65.2% (1,396)Unmarried:
34.8% (745)
Marital status - Black or African American population 15 years and over
Males 34.6% Never married65.4% Now married0.0% Separated0.0% Widowed0.0% DivorcedFemales 22.4% Never married71.8% Now married0.0% Separated5.9% Widowed0.0% DivorcedWomen who did not give birth in the past 12 months Now married:
76.3% (57)Unmarried:
23.8% (18)
Marital status - Asian population 15 years and over
Males 46.4% Never married53.6% Now married0.0% Separated0.0% Widowed0.0% DivorcedFemales 21.7% Never married58.0% Now married0.0% Separated10.1% Widowed10.1% DivorcedWomen who did not give birth in the past 12 months Now married:
15.4% (4)Unmarried:
84.6% (23)
Marital status - Other race population 15 years and over
Males 14.5% Never married85.5% Now married0.0% Separated0.0% Widowed0.0% DivorcedFemales 0.0% Never married100.0% Now married0.0% Separated0.0% Widowed0.0% DivorcedWomen who did not give birth in the past 12 months Now married:
100.0% (42)Unmarried:
0.0% (0)
Marital status - Two or more races population 15 years and over
Males 59.6% Never married40.4% Now married0.0% Separated0.0% Widowed0.0% DivorcedFemales 44.8% Never married39.7% Now married0.0% Separated0.0% Widowed15.5% DivorcedWomen who gave birth in the past 12 months Now married:
0.0% (0)Unmarried:
100.0% (1)
Women who did not give birth in the past 12 months Now married:
41.9% (24)Unmarried:
58.1% (33)
Marital status - White alone, not Hispanic / Latino population 15 years and over
Males 20.6% Never married67.1% Now married1.3% Separated1.1% Widowed10.0% DivorcedFemales 18.4% Never married60.8% Now married3.6% Separated7.7% Widowed9.6% DivorcedWomen who gave birth in the past 12 months Now married:
98.6% (71)Unmarried:
1.4% (1)
Women who did not give birth in the past 12 months Now married:
64.1% (1,338)Unmarried:
35.9% (751)
Marital status - Hispanic or Latino population 15 years and over
Males 50.5% Never married49.5% Now married0.0% Separated0.0% Widowed0.0% DivorcedFemales 14.1% Never married85.3% Now married0.0% Separated0.0% Widowed0.6% DivorcedWomen who did not give birth in the past 12 months Now married:
84.1% (125)Unmarried:
15.9% (24)
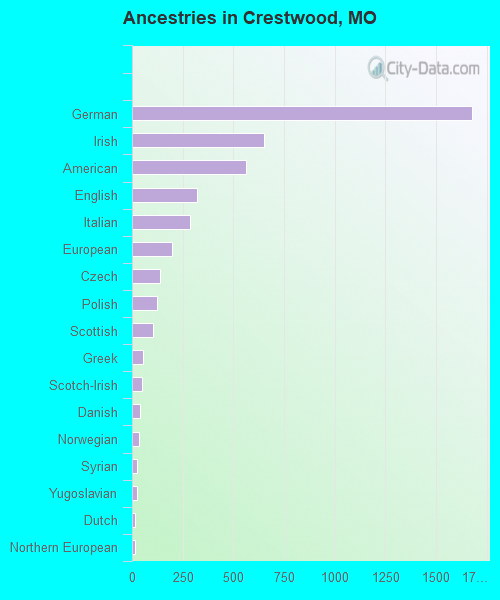
Ancestries in Crestwood
1,678 31.9% German653 12.4% Irish563 10.7% American319 6.1% English285 5.4% Italian195 3.7% European140 2.7% Czech121 2.3% Polish103 2.0% Scottish54 1.0% Greek47 0.9% Scotch-Irish41 0.8% Danish36 0.7% Norwegian25 0.5% Syrian25 0.5% Yugoslavian17 0.3% Dutch17 0.3% Northern European14 0.3% British14 0.3% French13 0.2% Swedish10 0.2% Czechoslovakian10 0.2% Welsh9 0.2% Ukrainian6 0.1% Armenian5 0.09% Eastern European4 0.08% African
Children Nativity (place of birth) in Crestwood
Children under 6 years - Living with two parents Both parents native 815 100.0% NativeBoth parents foreign-born 5 100.0% NativeOne native, one foreign-born parent 19 100.0% NativeChildren under 6 years - Living with one parent Native parent 34 100.0% NativeChildren 6 to 17 years - Living with two parents Both parents native 1,377 100.0% NativeBoth parents foreign-born 29 100.0% NativeOne native, one foreign-born parent 15 100.0% NativeChildren 6 to 17 years - Living with one parent Native parent 201 100.0% NativeForeign-born parent 5 48.6% Native5 51.4% Foreign-born