Races in Creve Coeur, Missouri (MO) Detailed Stats
Ancestries, Foreign-born residents, place of birth
Settings
X


Recent posts about races in Creve Coeur, Missouri on our local forum with over 2,400,000 registered users:
 | Missouri Native Moving Back. Advice on St. Louis Metro (14 replies) |
| Moving to St. Louis from Northern VA (10 replies) |
| Creve Couer Lake History (38 replies) |
| What is really wrong with St. Louis? (448 replies) |
| Maryland Heights Landfill? (5 replies) |
| Relocating from Overland Park KS to STL (5 replies) |
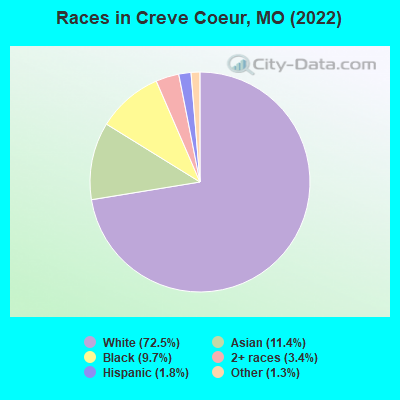
According to 2022 data, the most numerous races in Creve Coeur, MO are White alone (13,407 residents), Black alone (1,800 residents), and Two or more races (638 residents). 85.7% of Creve Coeur residents speak English at home. 12.9% of Creve Coeur, MO residents are foreign-born (8.8% born in Asia, 3.0% born in Europe), which is 69.0% greater than the foreign-born rate of 4.0% across the entire state of Missouri.
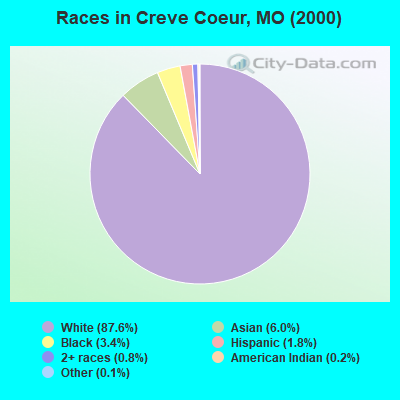
Race distribution in Creve Coeur
2000
2022

- 14,46187.6%White alone
- 9916.0%Asian alone
- 5663.4%Black alone
- 2921.8%Hispanic
- 1380.8%Two or more races
- 320.2%American Indian alone
- 190.1%Other race alone
- 10.01%Native Hawaiian and Other
Pacific Islander alone
-
- 13,40772.5%White alone
- 2,10811.4%Asian alone
- 1,8009.7%Black alone
- 6383.4%Two or more races
- 3331.8%Hispanic
- 2441.3%Other race alone
- 140.08%Native Hawaiian and Other
Pacific Islander alone - 50.03%American Indian alone
2000
2022
-
- 4,686,47483.8%White alone
- 625,66711.2%Black alone
- 118,5922.1%Hispanic
- 71,9051.3%Two or more races
- 61,0411.1%Asian alone
- 23,3020.4%American Indian alone
- 5,2910.09%Other race alone
- 2,9390.05%Native Hawaiian and Other
Pacific Islander alone

-
- 4,733,41176.6%White alone
- 656,73910.6%Black alone
- 316,3005.1%Two or more races
- 291,7634.7%Hispanic
- 132,4362.1%Asian alone
- 27,4670.4%Other race alone
- 12,3130.2%American Indian alone
- 7,5280.1%Native Hawaiian and Other
Pacific Islander alone

Income and house value in Creve Coeur
- Median household income in 2022
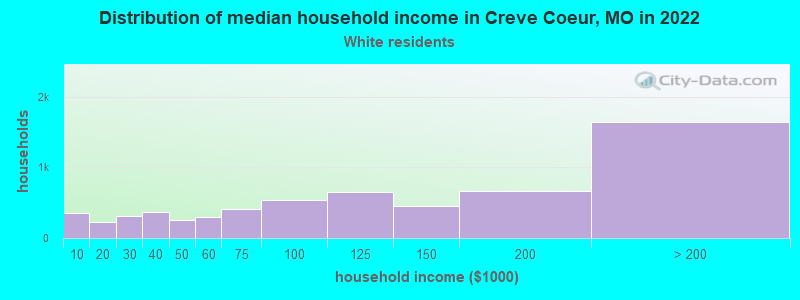
- $117,897White non-Hispanic householders
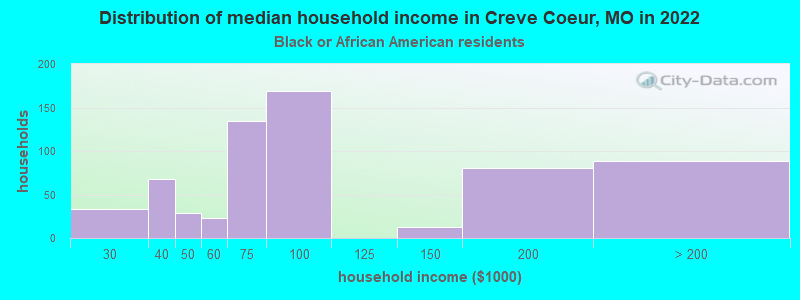
- $79,054Black householders
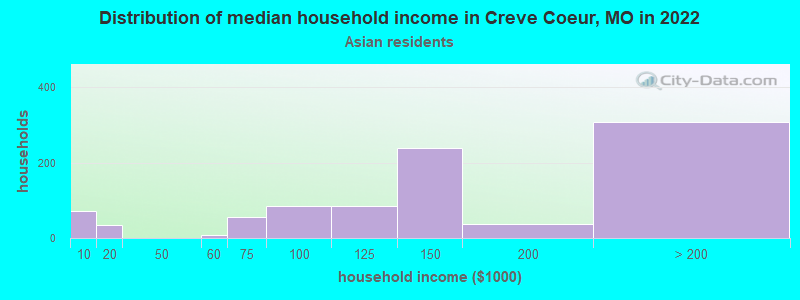
- $139,629Asian householders
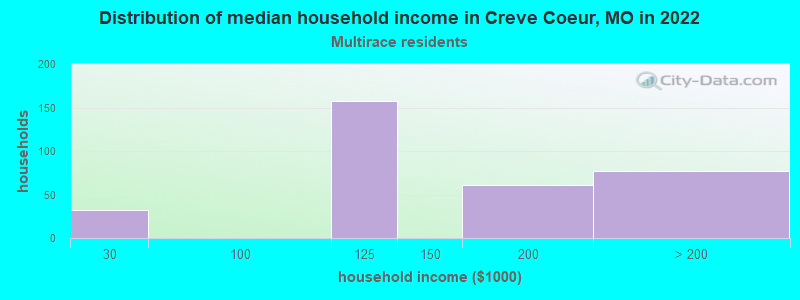
- $155,485Two or more races householders
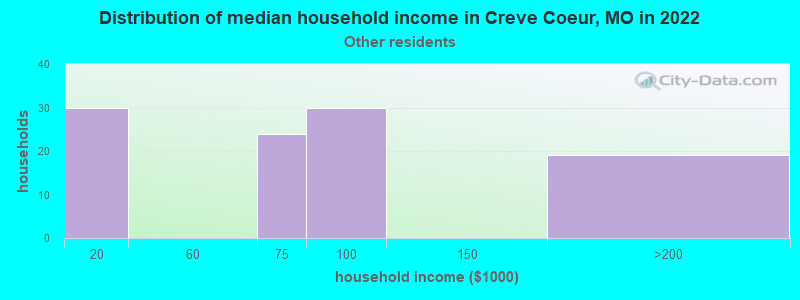
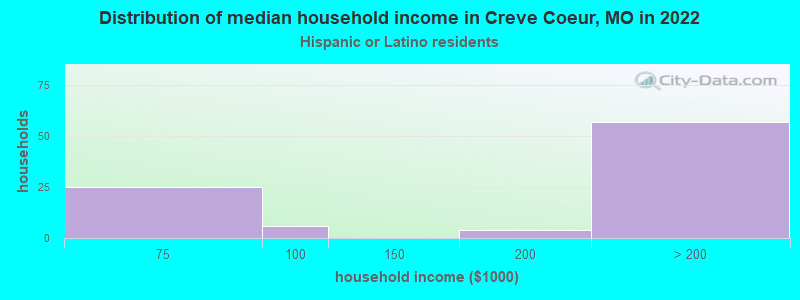
- over $200,000Hispanic or Latino race householders
- Median 2022 house value
- $609,047White Non-Hispanic householders
- $656,537Black or African American householders
- $300,912American Indian or Alaska Native householders
- $656,537Asian householders
- $355,624Two or more races householders
- $441,630Hispanic or Latino householders
Household income for White non-Hispanic householders
Household income for Black householders
Household income for Asian householders
Household income for Some other race householders
Household income for Two or more races householders
Household income for Hispanic or Latino race householders
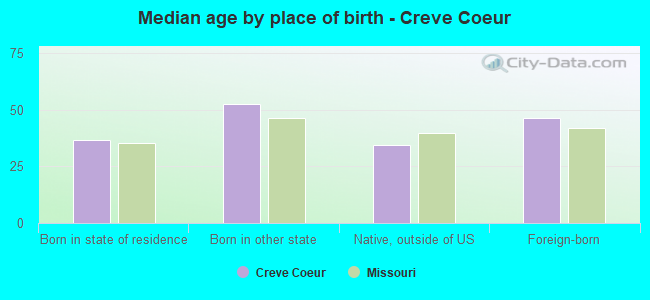
Median age by race in Creve Coeur
- 49.4Median age for White residents
- 46.0Males
- 51.8Females
- 29.1Median age for Black or African American residents
- 26.5Males
- 30.6Females
- 47.4Median age for American Indian / Alaska Native residents
- -644,003,776.5Males
- -505,494,505.0Females
- 39.7Median age for Asian residents
- 35.4Males
- 45.6Females
- -710,303,029.6Median age for Native Hawaiian / Pacific Islander residents
- -1,449,781,657.9Males
- -752,136,751.4Females
- 36.7Median age for Other race residents
- 21.5Males
- 42.0Females
- 20.1Median age for Two or more races residents
- 20.0Males
- 22.3Females
- 49.3Median age for White alone residents
- 45.9Males
- 51.7Females
- 24.8Median age for Hispanic or Latino residents
- 47.8Males
- 23.7Females
Owner/renter occupied households by race in Creve Coeur
- House owners and renters - White residents
- 4,23568.0%Owner occupied
- 1,99332.0%Renter occupied
- House owners and renters - Black or African American residents
- 23535.8%Owner occupied
- 42164.2%Renter occupied
- House owners and renters - Asian residents
- 46150.4%Owner occupied
- 45349.6%Renter occupied
- House owners and renters - Native Hawaiian / Pacific Islander residents
- 20100.0%Renter occupied
- House owners and renters - Other race residents
- 2530.1%Owner occupied
- 5869.9%Renter occupied
- House owners and renters - Two or more races residents
- 19062.0%Owner occupied
- 11638.0%Renter occupied
- House owners and renters - White alone residents
- 4,23167.8%Owner occupied
- 2,00532.2%Renter occupied
- House owners and renters - Hispanic or Latino residents
- 7483.5%Owner occupied
- 1516.5%Renter occupied
Language usage in Creve Coeur
- English speakers - Total
- 85.7% of residents of Creve Coeur speak English at home.
- 1.4% of residents speak Spanish at home
- 19977.1%Speak English very well
- 5922.9%Speak English less than very well
- 12.9% of residents speak other language at home
- 1,83179.5%Speak English very well
- 47220.5%Speak English less than very well
- English speakers - Born in the United States
- 95.8% of residents of Creve Coeur speak English at home.
- 1.0% of residents speak Spanish at home
- 5396.4%Speak English very well
- 23.6%Speak English less than very well
- 3.4% of residents speak other language at home
- 17589.7%Speak English very well
- 2010.3%Speak English less than very well
All residents speak only English at home
- English speakers - Foreign-born
- 20.6% of residents of Creve Coeur speak English at home.
- 4.3% of residents speak Spanish at home
- 8783.7%Speak English very well
- 1716.3%Speak English less than very well
- 73.4% of residents speak other language at home
- 1,33675.9%Speak English very well
- 42524.1%Speak English less than very well
White (Caucasian) - Speak only English
| Native: | 97.2% (11,979) |
| Foreign-born: | 27.9% (173) |
White (Caucasian) - Speak another language
| Native: | 2.8% (342) |
| Foreign-born: | 70.9% (441) |
Asian - Speak only English
| Native: | 79.5% (444) |
| Foreign-born: | 18.3% (277) |
Asian - Speak another language
| Native: | 26.6% (149) |
| Foreign-born: | 82.2% (1,242) |
Other race - Speak another language
| Native: | 16.6% (28) |
| Foreign-born: | 90.6% (38) |
Two or more races - Speak only English
| Native: | 89.4% (588) |
| Foreign-born: | 14.8% (27) |
Two or more races - Speak another language
| Native: | 11.3% (74) |
| Foreign-born: | 82.3% (152) |
White alone - Speak only English
| Native: | 97.1% (11,985) |
| Foreign-born: | 26.6% (158) |
White alone - Speak another language
| Native: | 2.9% (359) |
| Foreign-born: | 72.7% (432) |
Hispanic or Latino - Speak only English
| Native: | 62.3% (126) |
| Foreign-born: | 18.6% (23) |
Hispanic or Latino - Speak another language
| Native: | 36.4% (74) |
| Foreign-born: | 79.2% (99) |
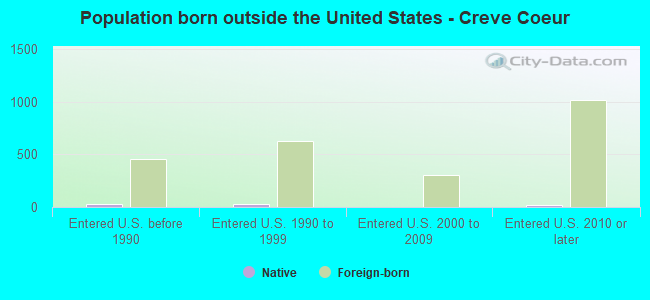
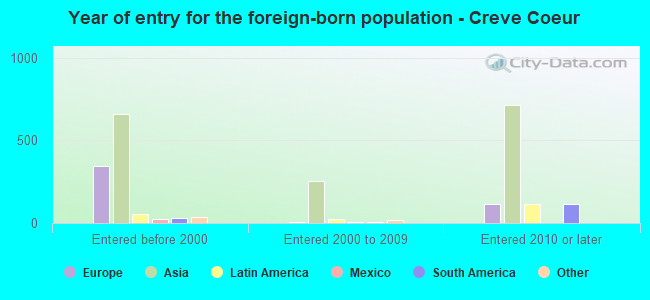
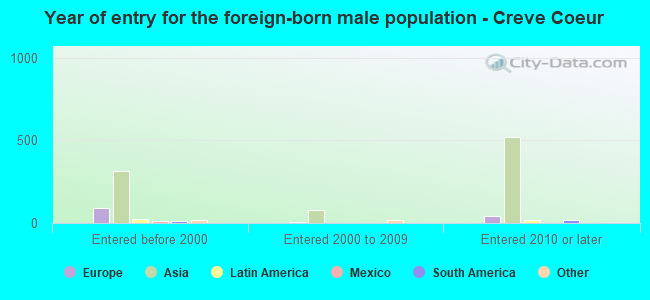
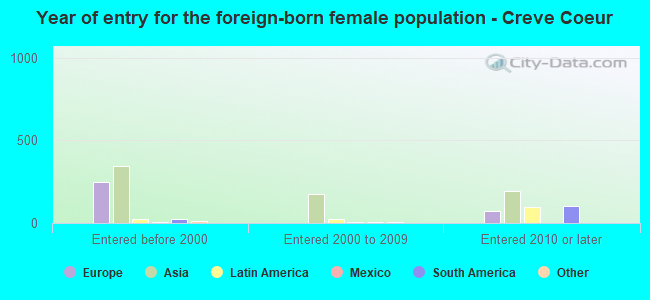
Foreign-born residents in Creve Coeur
2,389 residents are foreign born (8.8% Asia, 3.0% Europe).
| This city: | 12.9% |
| Missouri: | 4.2% |
Marital status for residents in Creve Coeur
Marital status - White (Caucasian) population 15 years and over
- Males
- 24.1%Never married
- 59.9%Now married
- 1.8%Separated
- 4.1%Widowed
- 10.2%Divorced
- Females
- 26.8%Never married
- 46.6%Now married
- 0.3%Separated
- 14.0%Widowed
- 12.3%Divorced
Women who gave birth in the past 12 months
| Now married: | 100.0% (92) |
| Unmarried: | 0.0% (0) |
Women who did not give birth in the past 12 months
| Now married: | 36.8% (1,020) |
| Unmarried: | 63.2% (1,755) |
Marital status - Black or African American population 15 years and over
- Males
- 82.5%Never married
- 12.7%Now married
- 0.5%Separated
- 0.0%Widowed
- 4.3%Divorced
- Females
- 71.5%Never married
- 9.1%Now married
- 0.9%Separated
- 16.9%Widowed
- 1.6%Divorced
Women who did not give birth in the past 12 months
| Now married: | 4.5% (28) |
| Unmarried: | 95.5% (593) |
Marital status - American Indian / Alaska Native population 15 years and over
- Males
- 100.0%Never married
- 0.0%Now married
- 0.0%Separated
- 0.0%Widowed
- 0.0%Divorced
- Females
- 0.0%Never married
- 100.0%Now married
- 0.0%Separated
- 0.0%Widowed
- 0.0%Divorced
Marital status - Asian population 15 years and over
- Males
- 30.6%Never married
- 59.9%Now married
- 5.5%Separated
- 3.9%Widowed
- 0.0%Divorced
- Females
- 5.9%Never married
- 88.3%Now married
- 0.0%Separated
- 4.7%Widowed
- 1.2%Divorced
Women who gave birth in the past 12 months
| Now married: | 100.0% (40) |
| Unmarried: | 0.0% (0) |
Women who did not give birth in the past 12 months
| Now married: | 86.9% (374) |
| Unmarried: | 13.1% (56) |
Marital status - Other race population 15 years and over
- Males
- 31.6%Never married
- 68.4%Now married
- 0.0%Separated
- 0.0%Widowed
- 0.0%Divorced
- Females
- 32.1%Never married
- 31.3%Now married
- 0.0%Separated
- 0.0%Widowed
- 36.6%Divorced
Women who did not give birth in the past 12 months
| Now married: | 32.6% (30) |
| Unmarried: | 67.4% (62) |
Marital status - Two or more races population 15 years and over
- Males
- 38.5%Never married
- 50.3%Now married
- 0.0%Separated
- 0.0%Widowed
- 11.2%Divorced
- Females
- 22.6%Never married
- 73.2%Now married
- 0.0%Separated
- 0.0%Widowed
- 4.2%Divorced
Women who did not give birth in the past 12 months
| Now married: | 69.0% (158) |
| Unmarried: | 31.0% (71) |
Marital status - White alone, not Hispanic / Latino population 15 years and over
- Males
- 24.2%Never married
- 59.8%Now married
- 1.8%Separated
- 4.1%Widowed
- 10.2%Divorced
- Females
- 26.8%Never married
- 46.7%Now married
- 0.3%Separated
- 14.1%Widowed
- 12.2%Divorced
Women who gave birth in the past 12 months
| Now married: | 100.0% (93) |
| Unmarried: | 0.0% (0) |
Women who did not give birth in the past 12 months
| Now married: | 36.8% (1,021) |
| Unmarried: | 63.2% (1,756) |
Marital status - Hispanic or Latino population 15 years and over
- Males
- 24.5%Never married
- 75.5%Now married
- 0.0%Separated
- 0.0%Widowed
- 0.0%Divorced
- Females
- 29.5%Never married
- 52.7%Now married
- 0.0%Separated
- 0.0%Widowed
- 17.8%Divorced
Women who did not give birth in the past 12 months
| Now married: | 55.3% (51) |
| Unmarried: | 44.7% (41) |
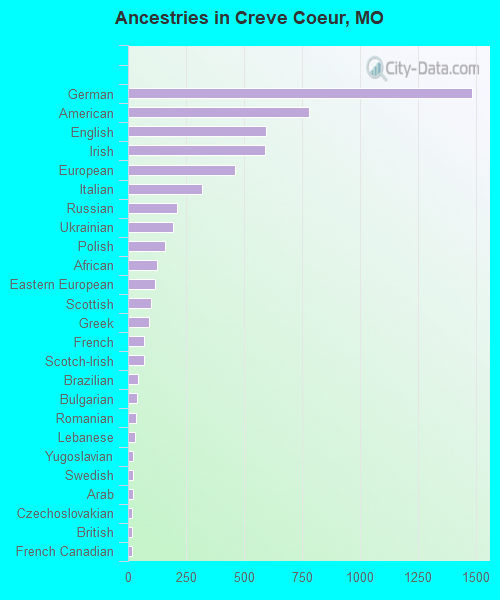
Ancestries in Creve Coeur

- 1,48314.8%German
- 7807.8%American
- 5945.9%English
- 5895.9%Irish
- 4634.6%European
- 3183.2%Italian
- 2122.1%Russian
- 1941.9%Ukrainian
- 1581.6%Polish
- 1271.3%African
- 1181.2%Eastern European
- 981.0%Scottish
- 910.9%Greek
- 670.7%French
- 670.7%Scotch-Irish
- 420.4%Brazilian
- 390.4%Bulgarian
- 330.3%Romanian
- 290.3%Lebanese
- 230.2%Yugoslavian
- 210.2%Swedish
- 200.2%Arab
- 170.2%Czechoslovakian
- 160.2%British
- 160.2%French Canadian
- 160.2%Nigerian
- 150.1%Swiss
- 130.1%Czech
- 110.1%Hungarian
- 90.09%Lithuanian
- 80.08%Turkish
- 70.07%Syrian
- 60.06%Slovene
- 60.06%Albanian
- 20.02%Australian
- 20.02%Slovak
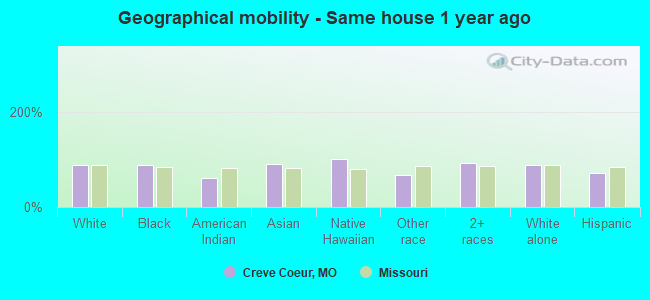
Geographical mobility in Creve Coeur

- Same house 1 year ago
- 11,73588.0%White (Caucasian)
- 1,59488.6%Black or African American
- 660.9%American Indian / Alaska Native
- 1,88889.9%Asian
- 24100.0%Native Hawaiian / Pacific Islander
- 14967.8%Other race
- 84491.7%Two or more races
- 11,75488.1%White alone, not Hispanic / Latino
- 23971.8%Hispanic or Latino
-
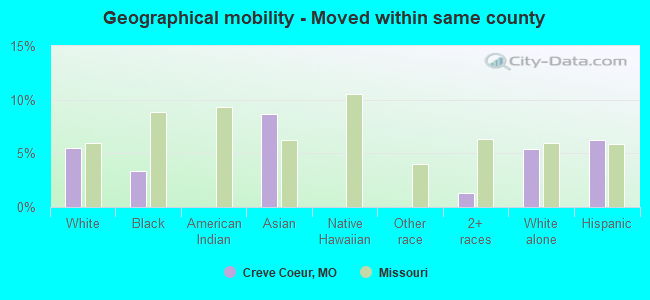
- Moved within same county
- 7315.5%White / Caucasian
- 613.4%Black or African American
- 1838.7%Asian
- 121.3%Two or more races
- 7175.4%White alone, not Hispanic / Latino
- 216.3%Hispanic or Latino
-
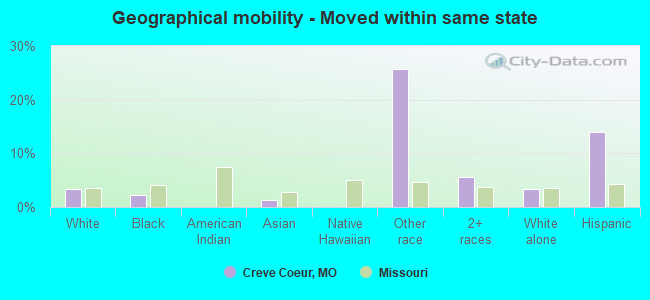
- Moved within same state
- 4493.4%White / Caucasian
- 392.2%Black or African American
- 271.3%Asian
- 5725.7%Other race
- 515.5%Two or more races
- 4443.3%White alone, not Hispanic / Latino
- 4714.0%Hispanic or Latino
-
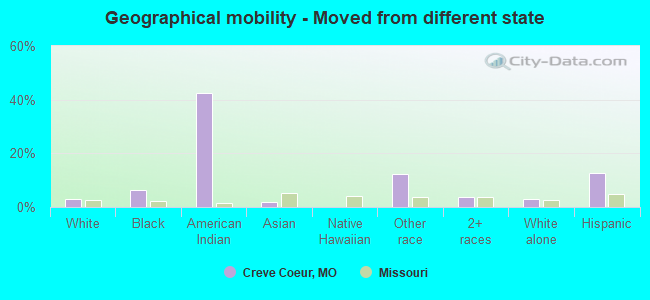
- Moved from different state
- 3953.0%White / Caucasian
- 1126.2%Black or African American
- 442.7%American Indian / Alaska Native
- 381.8%Asian
- 2712.5%Other race
- 353.8%Two or more races
- 3963.0%White alone, not Hispanic / Latino
- 4312.8%Hispanic or Latino
-
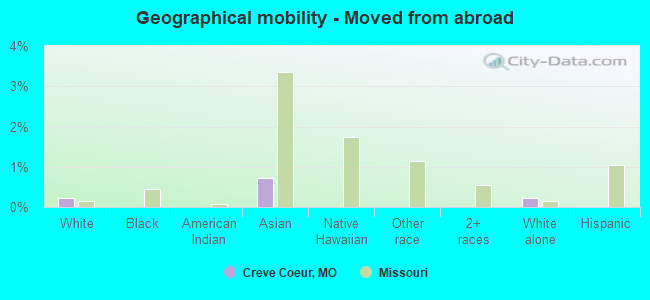
- Moved from abroad
- 280.2%White
- 150.7%Asian
- 290.2%White alone, not Hispanic / Latino
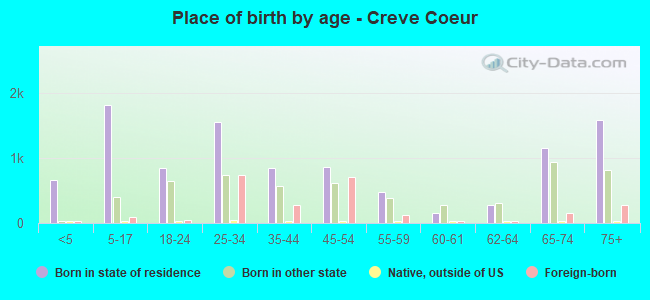
Children Nativity (place of birth) in Creve Coeur
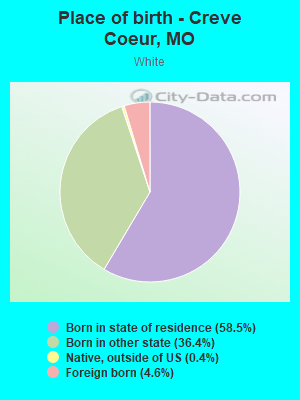
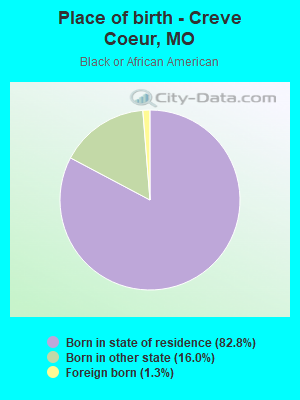
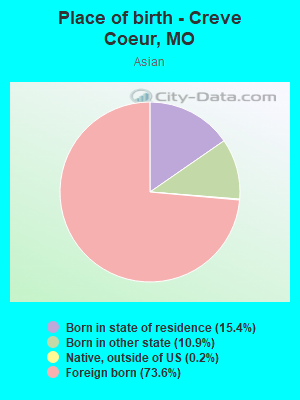
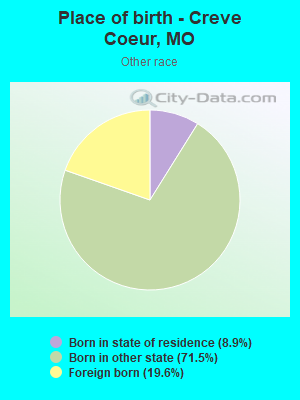
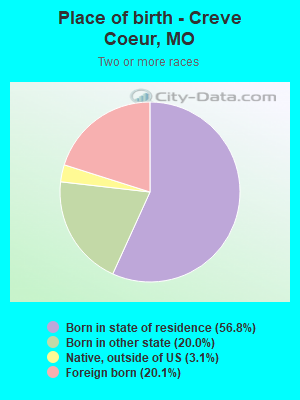
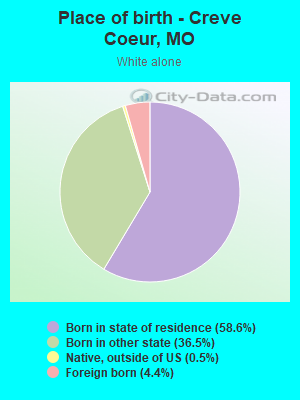
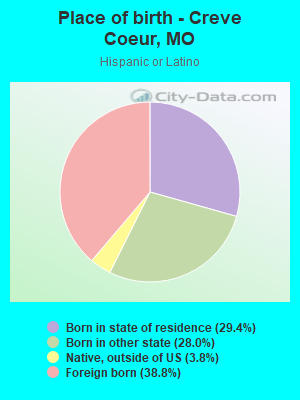
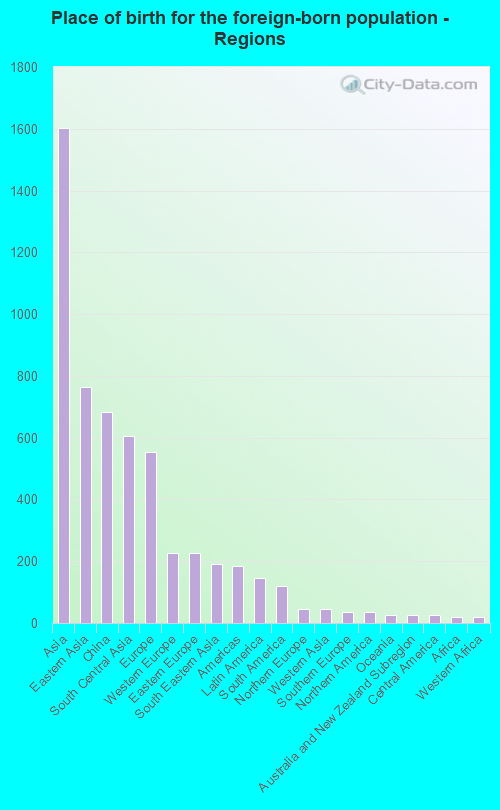
Place of birth for residents in Creve Coeur
![Place of birth for the foreign-born population - Regions]()
- 1,604Asia
- 763Eastern Asia
- 684China
- 605South Central Asia
- 555Europe
- 228Western Europe
- 227Eastern Europe
- 190South Eastern Asia
- 183Americas
- 146Latin America
- 120South America
- 45Northern Europe
- 44Western Asia
- 37Southern Europe
- 37Northern America
- 27Oceania
- 27Australia and New Zealand Subregion
- 26Central America
- 18Africa
- 18Western Africa
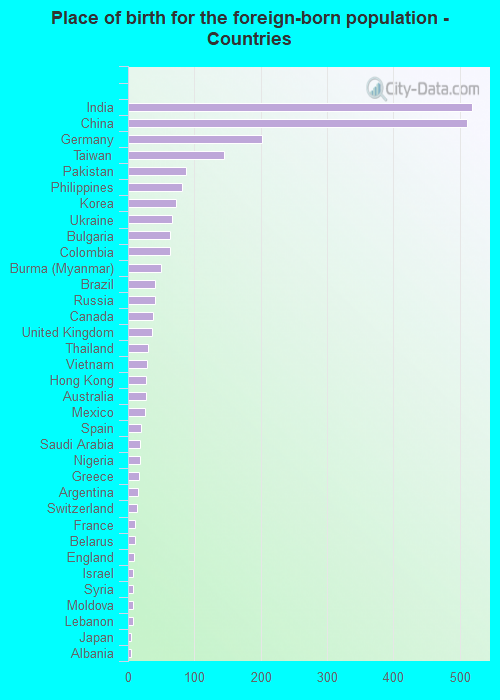
![Place of birth for the foreign-born population - Countries]()
- 518India
- 511China
- 202Germany
- 145Taiwan
- 87Pakistan
- 81Philippines
- 73Korea
- 67Ukraine
- 64Bulgaria
- 63Colombia
- 50Burma (Myanmar)
- 41Brazil
- 40Russia
- 37Canada
- 36United Kingdom
- 30Thailand
- 28Vietnam
- 27Hong Kong
- 27Australia
- 26Mexico
- 19Spain
- 18Saudi Arabia
- 18Nigeria
- 17Greece
- 15Argentina
- 14Switzerland
- 11France
- 10Belarus
- 9England
- 8Israel
- 8Syria
- 7Moldova
- 7Lebanon
- 5Japan
- 5Albania
Zip codes: 63132.