Races in Cross, South Carolina (SC) Detailed Stats
Ancestries, Foreign-born residents, place of birth
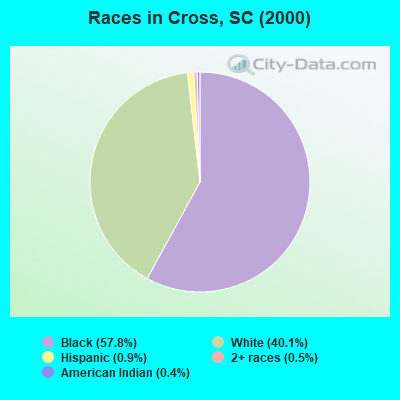
Race distribution in Cross

- 4,21557.8%Black alone
- 2,92640.1%White alone
- 690.9%Hispanic
- 370.5%Two or more races
- 290.4%American Indian alone
- 60.08%Native Hawaiian and Other
Pacific Islander alone - 50.07%Asian alone
- 40.05%Other race alone
2000
2022
-
- 2,652,29166.1%White alone
- 1,178,48629.4%Black alone
- 95,0762.4%Hispanic
- 35,5680.9%Asian alone
- 33,2900.8%Two or more races
- 12,7650.3%American Indian alone
- 3,2660.08%Other race alone
- 1,2700.03%Native Hawaiian and Other
Pacific Islander alone

-
- 3,301,73962.5%White alone
- 1,313,29024.9%Black alone
- 343,7836.5%Hispanic
- 190,5083.6%Two or more races
- 89,8881.7%Asian alone
- 29,3900.6%Other race alone
- 12,1120.2%American Indian alone
- 1,9240.04%Native Hawaiian and Other
Pacific Islander alone

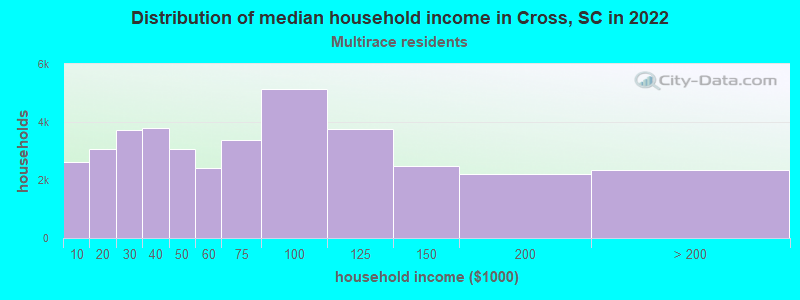
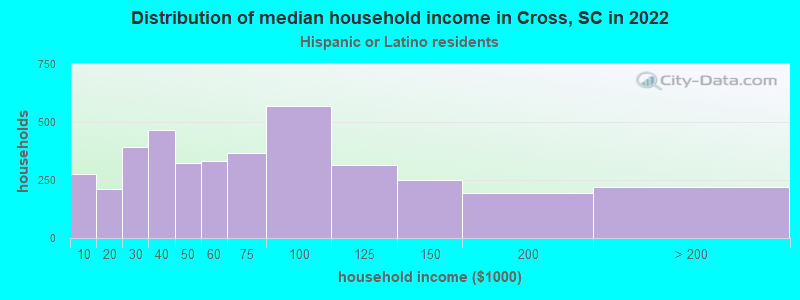
Income and house value in Cross
- Median household income in 2022
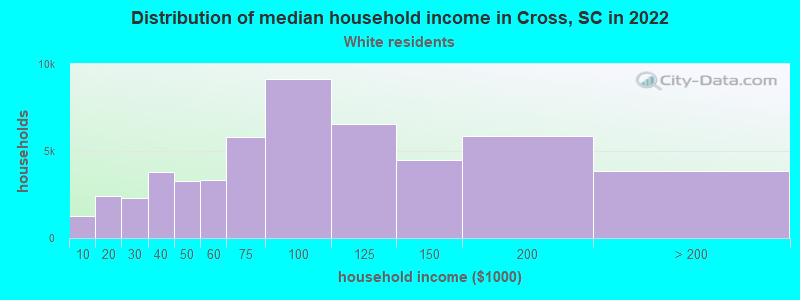
- $68,801White non-Hispanic householders
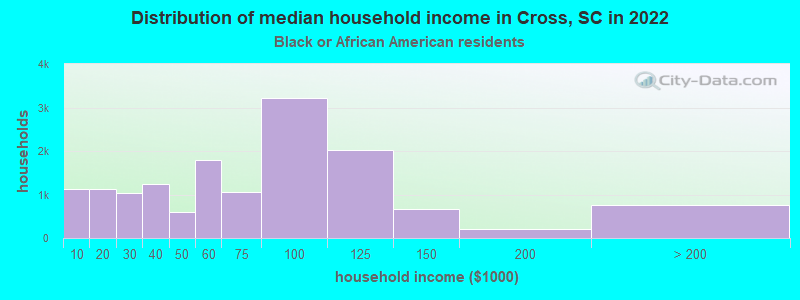
- $42,641Black householders
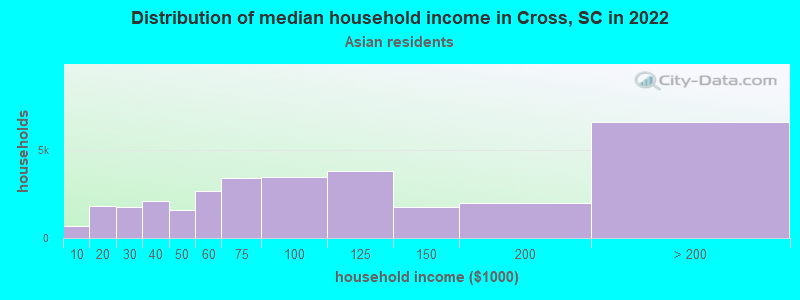
- $101,371Asian householders
- $77,745Two or more races householders
- $5,660Hispanic or Latino race householders
- Median 2022 house value
- $332,045White Non-Hispanic householders
- $313,789Black or African American householders
- $285,262Two or more races householders
- $123,613Hispanic or Latino householders
Household income for White non-Hispanic householders
Household income for Black householders
Household income for Asian householders
Household income for Native Hawaiian and other Pacific Islander householders

Household income for Two or more races householders
Household income for Hispanic or Latino race householders
Zip code: 29436