Races in Crown Point, Indiana (IN) Detailed Stats
Data:
Races - White alone (%)
Races - White alone (% change since 2000)
Races - Black alone (%)
Races - Black alone (% change since 2000)
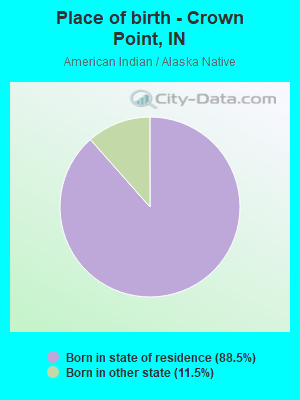
Races - American Indian alone (%)
Races - American Indian alone (% change since 2000)
Races - Asian alone (%)
Races - Asian alone (% change since 2000)
Races - Hispanic (%)
Races - Hispanic (% change since 2000)
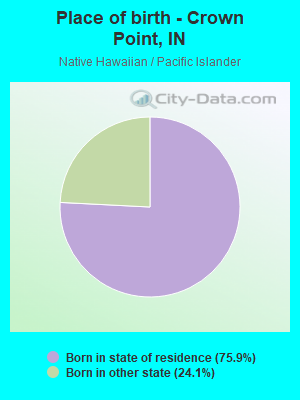
Races - Native Hawaiian and Other Pacific Islander alone (%)
Races - Native Hawaiian and Other Pacific Islander alone (% change since 2000)
Races - Two or more races(%)
Races - Two or more races(% change since 2000)
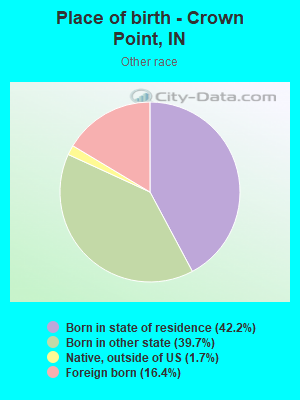
Races - Other race alone (%)
Races - Other race alone (% change since 2000)
Racial diversity
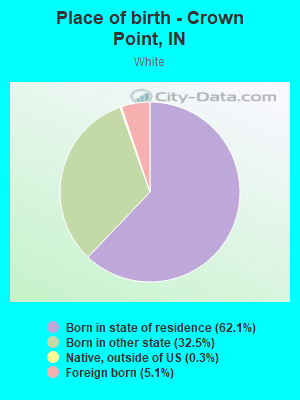
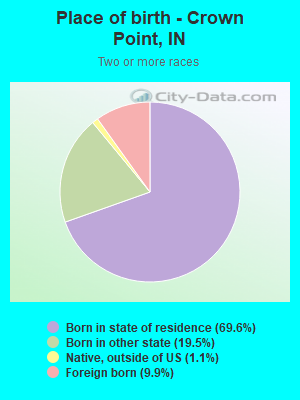
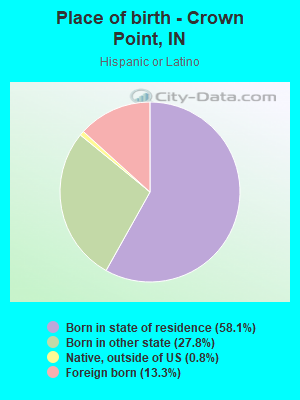
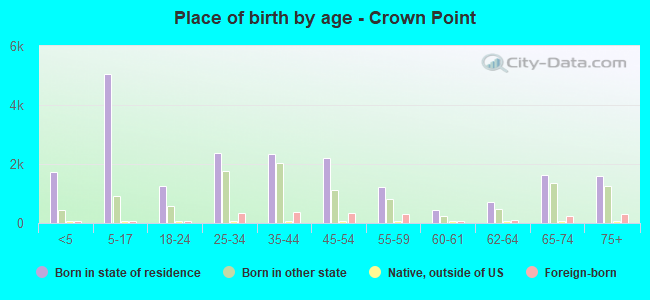
Place of birth - Born in state of residence (%)
Place of birth - Born in state of residence (%) - White
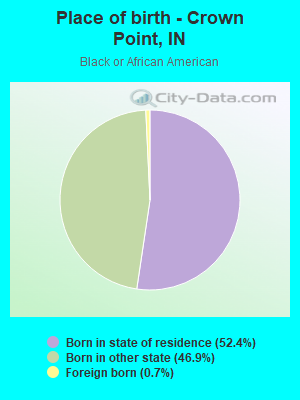
Place of birth - Born in state of residence (%) - Black or African American
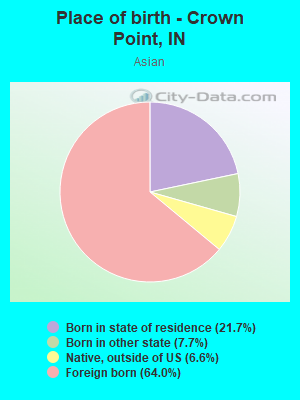
Place of birth - Born in state of residence (%) - Asian
Place of birth - Born in state of residence (%) - Hispanic or Latino
Place of birth - Born in state of residence (%) - American Indian and Alaska Native
Place of birth - Born in state of residence (%) - Multirace
Place of birth - Born in state of residence (%) - Other Race
Place of birth - Born in other state (%)
Place of birth - Born in other state (%) - White
Place of birth - Born in other state (%) - Black or African American
Place of birth - Born in other state (%) - Asian
Place of birth - Born in other state (%) - Hispanic or Latino
Place of birth - Born in other state (%) - American Indian and Alaska Native
Place of birth - Born in other state (%) - Multirace
Place of birth - Born in other state (%) - Other Race
Place of birth - Native, outside of US (%)
Place of birth - Native, outside of US (%) - White
Place of birth - Native, outside of US (%) - Black or African American
Place of birth - Native, outside of US (%) - Asian
Place of birth - Native, outside of US (%) - Hispanic or Latino
Place of birth - Native, outside of US (%) - American Indian and Alaska Native
Place of birth - Native, outside of US (%) - Multirace
Place of birth - Native, outside of US (%) - Other Race
Place of birth - Foreign born (%)
Place of birth - Foreign born (%) - White
Place of birth - Foreign born (%) - Black or African American
Place of birth - Foreign born (%) - Asian
Place of birth - Foreign born (%) - Hispanic or Latino
Place of birth - Foreign born (%) - American Indian and Alaska Native
Place of birth - Foreign born (%) - Multirace
Place of birth - Foreign born (%) - Other Race
Residents speaking English at home (%)
Residents speaking English at home - Born in the United States (%)
Residents speaking English at home - Native, born elsewhere (%)
Residents speaking English at home - Foreign born (%)
Residents speaking Spanish at home (%)
Residents speaking Spanish at home - Born in the United States (%)
Residents speaking Spanish at home - Native, born elsewhere (%)
Residents speaking Spanish at home - Foreign born (%)
Residents speaking other language at home (%)
Residents speaking other language at home - Born in the United States (%)
Residents speaking other language at home - Native, born elsewhere (%)
Residents speaking other language at home - Foreign born (%)
Marital status - Never married (%)
Marital status - Now married (%)
Marital status - Separated (%)
Marital status - Widowed (%)
Marital status - Divorced (%)
Ancestries Reported - Arab (%)
Ancestries Reported - Czech (%)
Ancestries Reported - Danish (%)
Ancestries Reported - Dutch (%)
Ancestries Reported - English (%)
Ancestries Reported - French (%)
Ancestries Reported - French Canadian (%)
Ancestries Reported - German (%)
Ancestries Reported - Greek (%)
Ancestries Reported - Hungarian (%)
Ancestries Reported - Irish (%)
Ancestries Reported - Italian (%)
Ancestries Reported - Lithuanian (%)
Ancestries Reported - Norwegian (%)
Ancestries Reported - Polish (%)
Ancestries Reported - Portuguese (%)
Ancestries Reported - Russian (%)
Ancestries Reported - Scotch-Irish (%)
Ancestries Reported - Scottish (%)
Ancestries Reported - Slovak (%)
Ancestries Reported - Subsaharan African (%)
Ancestries Reported - Swedish (%)
Ancestries Reported - Swiss (%)
Ancestries Reported - Ukrainian (%)
Ancestries Reported - United States (%)
Ancestries Reported - Welsh (%)
Ancestries Reported - West Indian (%)
Ancestries Reported - Other (%)
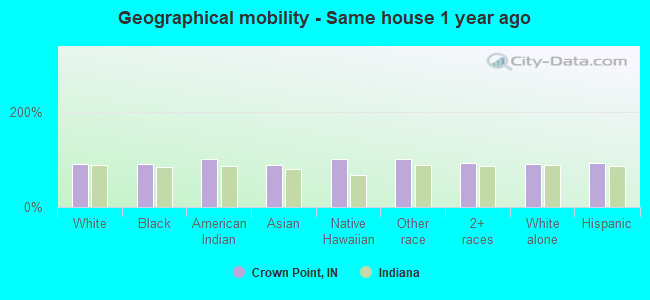
Geographical mobility - Same house 1 year ago (%)
Geographical mobility - Same house 1 year ago (%) - White
Geographical mobility - Same house 1 year ago (%) - Black or African American
Geographical mobility - Same house 1 year ago (%) - Asian
Geographical mobility - Same house 1 year ago (%) - Hispanic or Latino
Geographical mobility - Same house 1 year ago (%) - American Indian and Alaska Native
Geographical mobility - Same house 1 year ago (%) - Multirace
Geographical mobility - Same house 1 year ago (%) - Other Race
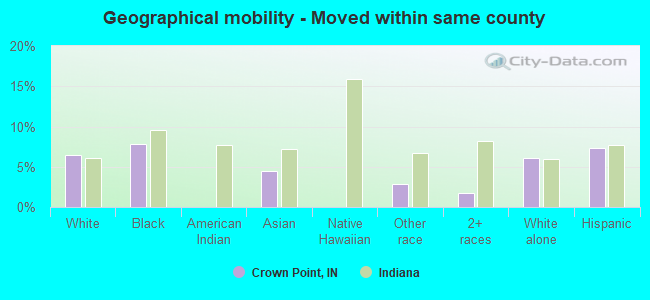
Geographical mobility - Moved within same county (%)
Geographical mobility - Moved within same county (%) - White
Geographical mobility - Moved within same county (%) - Black or African American
Geographical mobility - Moved within same county (%) - Asian
Geographical mobility - Moved within same county (%) - Hispanic or Latino
Geographical mobility - Moved within same county (%) - American Indian and Alaska Native
Geographical mobility - Moved within same county (%) - Multirace
Geographical mobility - Moved within same county (%) - Other Race
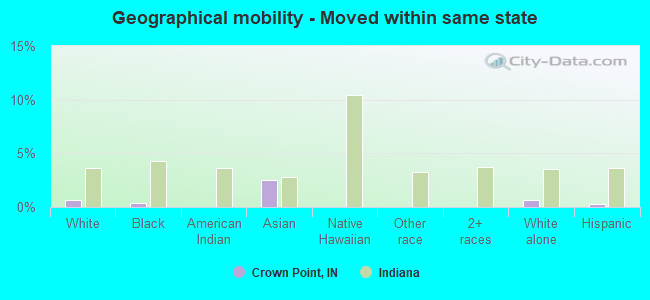
Geographical mobility - Moved from different county within same state (%)
Geographical mobility - Moved from different county within same state (%) - White
Geographical mobility - Moved from different county within same state (%) - Black or African American
Geographical mobility - Moved from different county within same state (%) - Asian
Geographical mobility - Moved from different county within same state (%) - Hispanic or Latino
Geographical mobility - Moved from different county within same state (%) - American Indian and Alaska Native
Geographical mobility - Moved from different county within same state (%) - Multirace
Geographical mobility - Moved from different county within same state (%) - Other Race
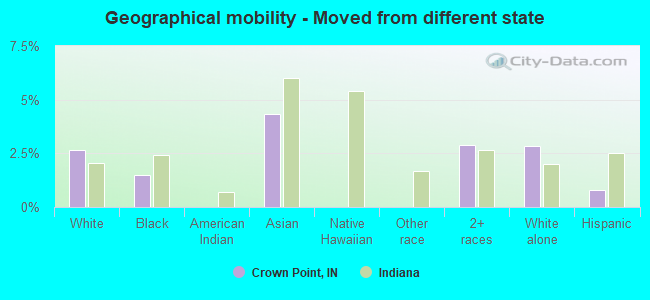
Geographical mobility - Moved from different state (%)
Geographical mobility - Moved from different state (%) - White
Geographical mobility - Moved from different state (%) - Black or African American
Geographical mobility - Moved from different state (%) - Asian
Geographical mobility - Moved from different state (%) - Hispanic or Latino
Geographical mobility - Moved from different state (%) - American Indian and Alaska Native
Geographical mobility - Moved from different state (%) - Multirace
Geographical mobility - Moved from different state (%) - Other Race
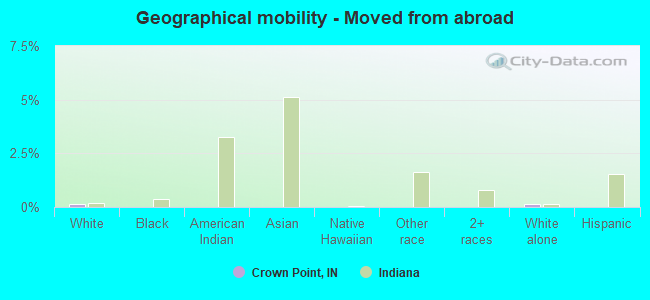
Geographical mobility - Moved from abroad (%)
Geographical mobility - Moved from abroad (%) - White
Geographical mobility - Moved from abroad (%) - Black or African American
Geographical mobility - Moved from abroad (%) - Asian
Geographical mobility - Moved from abroad (%) - Hispanic or Latino
Geographical mobility - Moved from abroad (%) - American Indian and Alaska Native
Geographical mobility - Moved from abroad (%) - Multirace
Geographical mobility - Moved from abroad (%) - Other Race
Place of birth for the foreign-born population - Ireland (%)
Place of birth for the foreign-born population - Denmark (%)
Place of birth for the foreign-born population - Norway (%)
Place of birth for the foreign-born population - Sweden (%)
Place of birth for the foreign-born population - United Kingdom (%)
Place of birth for the foreign-born population - England (%)
Place of birth for the foreign-born population - Scotland (%)
Place of birth for the foreign-born population - Other Northern Europe (%)
Place of birth for the foreign-born population - Austria (%)
Place of birth for the foreign-born population - Belgium (%)
Place of birth for the foreign-born population - France (%)
Place of birth for the foreign-born population - Germany (%)
Place of birth for the foreign-born population - Netherlands (%)
Place of birth for the foreign-born population - Switzerland (%)
Place of birth for the foreign-born population - Other Western Europe (%)
Place of birth for the foreign-born population - Greece (%)
Place of birth for the foreign-born population - Italy (%)
Place of birth for the foreign-born population - Portugal (%)
Place of birth for the foreign-born population - Spain (%)
Place of birth for the foreign-born population - Other Southern Europe (%)
Place of birth for the foreign-born population - Albania (%)
Place of birth for the foreign-born population - Belarus (%)
Place of birth for the foreign-born population - Bosnia and Herzegovina (%)
Place of birth for the foreign-born population - Bulgaria (%)
Place of birth for the foreign-born population - Croatia (%)
Place of birth for the foreign-born population - Czechoslovakia (%)
Place of birth for the foreign-born population - Hungary (%)
Place of birth for the foreign-born population - Latvia (%)
Place of birth for the foreign-born population - Lithuania (%)
Place of birth for the foreign-born population - North Macedonia (Macedonia) (%)
Place of birth for the foreign-born population - Moldova (%)
Place of birth for the foreign-born population - Poland (%)
Place of birth for the foreign-born population - Romania (%)
Place of birth for the foreign-born population - Russia (%)
Place of birth for the foreign-born population - Serbia (%)
Place of birth for the foreign-born population - Ukraine (%)
Place of birth for the foreign-born population - Other Eastern Europe (%)
Place of birth for the foreign-born population - China (%)
Place of birth for the foreign-born population - Hong Kong (%)
Place of birth for the foreign-born population - Taiwan (%)
Place of birth for the foreign-born population - Japan (%)
Place of birth for the foreign-born population - Korea (%)
Place of birth for the foreign-born population - Other Eastern Asia (%)
Place of birth for the foreign-born population - Afghanistan (%)
Place of birth for the foreign-born population - Bangladesh (%)
Place of birth for the foreign-born population - India (%)
Place of birth for the foreign-born population - Iran (%)
Place of birth for the foreign-born population - Kazakhstan (%)
Place of birth for the foreign-born population - Nepal (%)
Place of birth for the foreign-born population - Pakistan (%)
Place of birth for the foreign-born population - Sri Lanka (%)
Place of birth for the foreign-born population - Uzbekistan (%)
Place of birth for the foreign-born population - Other South Central Asia (%)
Place of birth for the foreign-born population - Burma (%)
Place of birth for the foreign-born population - Cambodia (%)
Place of birth for the foreign-born population - Indonesia (%)
Place of birth for the foreign-born population - Laos (%)
Place of birth for the foreign-born population - Malaysia (%)
Place of birth for the foreign-born population - Philippines (%)
Place of birth for the foreign-born population - Singapore (%)
Place of birth for the foreign-born population - Thailand (%)
Place of birth for the foreign-born population - Vietnam (%)
Place of birth for the foreign-born population - Other South Eastern Asia (%)
Place of birth for the foreign-born population - Armenia (%)
Place of birth for the foreign-born population - Iraq (%)
Place of birth for the foreign-born population - Israel (%)
Place of birth for the foreign-born population - Jordan (%)
Place of birth for the foreign-born population - Kuwait (%)
Place of birth for the foreign-born population - Lebanon (%)
Place of birth for the foreign-born population - Saudi Arabia (%)
Place of birth for the foreign-born population - Syria (%)
Place of birth for the foreign-born population - Turkey (%)
Place of birth for the foreign-born population - Yemen (%)
Place of birth for the foreign-born population - Other Western Asia (%)
Place of birth for the foreign-born population - Eritrea (%)
Place of birth for the foreign-born population - Ethiopia (%)
Place of birth for the foreign-born population - Kenya (%)
Place of birth for the foreign-born population - Somalia (%)
Place of birth for the foreign-born population - Uganda (%)
Place of birth for the foreign-born population - Zimbabwe (%)
Place of birth for the foreign-born population - Other Eastern Africa (%)
Place of birth for the foreign-born population - Cameroon (%)
Place of birth for the foreign-born population - Congo (%)
Place of birth for the foreign-born population - Democratic Republic of Congo (Zaire) (%)
Place of birth for the foreign-born population - Other Middle Africa (%)
Place of birth for the foreign-born population - Egypt (%)
Place of birth for the foreign-born population - Morocco (%)
Place of birth for the foreign-born population - Sudan (%)
Place of birth for the foreign-born population - Other Northern Africa (%)
Place of birth for the foreign-born population - South Africa (%)
Place of birth for the foreign-born population - Other Southern Africa (%)
Place of birth for the foreign-born population - Cabo Verde (%)
Place of birth for the foreign-born population - Ghana (%)
Place of birth for the foreign-born population - Liberia (%)
Place of birth for the foreign-born population - Nigeria (%)
Place of birth for the foreign-born population - Senegal (%)
Place of birth for the foreign-born population - Sierra Leone (%)
Place of birth for the foreign-born population - Other Western Africa (%)
Place of birth for the foreign-born population - Australia (%)
Place of birth for the foreign-born population - New Zealand (%)
Place of birth for the foreign-born population - Fiji (%)
Place of birth for the foreign-born population - Micronesia (%)
Place of birth for the foreign-born population - Bahamas (%)
Place of birth for the foreign-born population - Barbados (%)
Place of birth for the foreign-born population - Cuba (%)
Place of birth for the foreign-born population - Dominica (%)
Place of birth for the foreign-born population - Dominican Republic (%)
Place of birth for the foreign-born population - Grenada (%)
Place of birth for the foreign-born population - Haiti (%)
Place of birth for the foreign-born population - Jamaica (%)
Place of birth for the foreign-born population - St. Vincent and the Grenadines (%)
Place of birth for the foreign-born population - Trinidad and Tobago (%)
Place of birth for the foreign-born population - West Indies (%)
Place of birth for the foreign-born population - Other Caribbean (%)
Place of birth for the foreign-born population - Belize (%)
Place of birth for the foreign-born population - Costa Rica (%)
Place of birth for the foreign-born population - El Salvador (%)
Place of birth for the foreign-born population - Guatemala (%)
Place of birth for the foreign-born population - Honduras (%)
Place of birth for the foreign-born population - Mexico (%)
Place of birth for the foreign-born population - Nicaragua (%)
Place of birth for the foreign-born population - Panama (%)
Place of birth for the foreign-born population - Other Central America (%)
Place of birth for the foreign-born population - Argentina (%)
Place of birth for the foreign-born population - Bolivia (%)
Place of birth for the foreign-born population - Brazil (%)
Place of birth for the foreign-born population - Chile (%)
Place of birth for the foreign-born population - Colombia (%)
Place of birth for the foreign-born population - Ecuador (%)
Place of birth for the foreign-born population - Guyana (%)
Place of birth for the foreign-born population - Peru (%)
Place of birth for the foreign-born population - Uruguay (%)
Place of birth for the foreign-born population - Venezuela (%)
Place of birth for the foreign-born population - Other South America (%)
Place of birth for the foreign-born population - Canada (%)
Place of birth for the foreign-born population - Other Northern America (%)
Place of birth for the foreign-born population - Other (%)
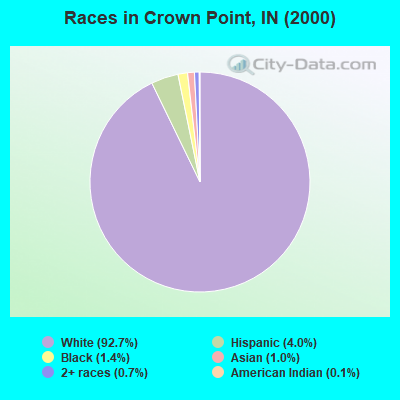
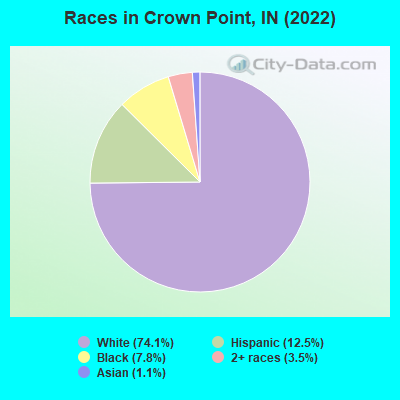
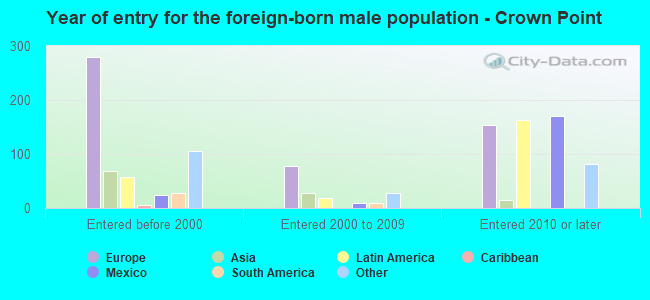
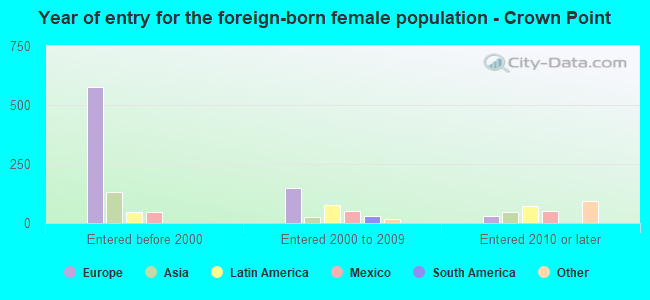
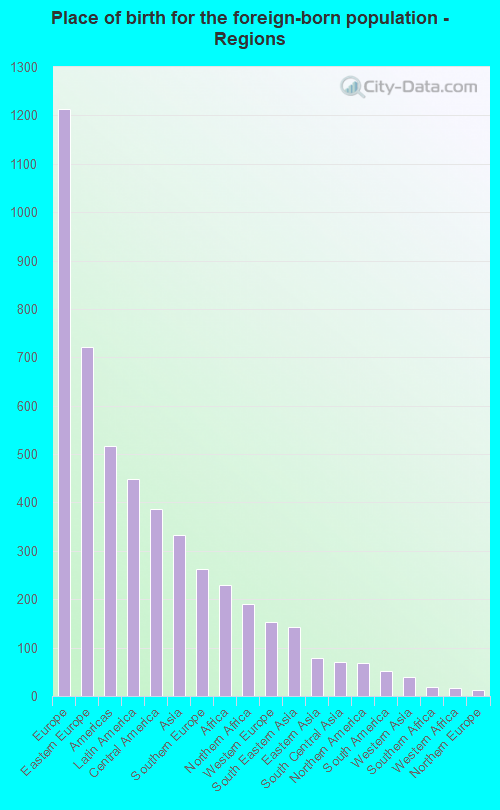
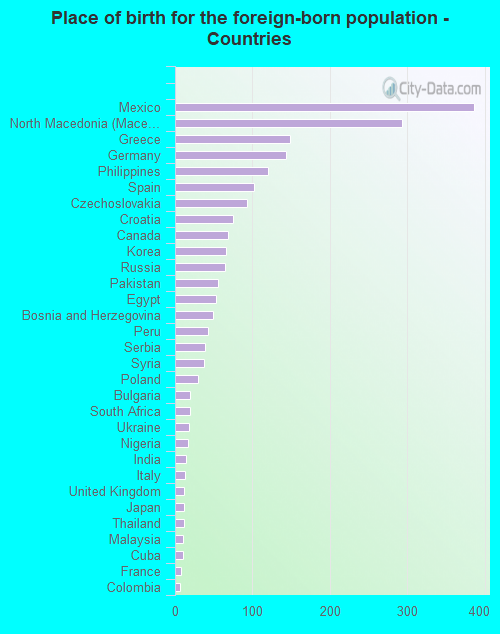
According to 2022 data, the most numerous races in Crown Point, IN are White alone (25,092 residents), Black alone (2,627 residents), and Hispanic (4,238 residents). 86.5% of Crown Point residents speak English at home. 6.8% of Crown Point, IN residents are foreign-born (3.3% born in Europe, 1.2% born in Latin America, 0.9% born in Asia), which is 11.4% greater than the foreign-born rate of 6.0% across the entire state of Indiana.
Race distribution in Crown Point
2000 2022
5,219,373 85.8% White alone 505,462 8.3% Black alone 214,536 3.5% Hispanic 61,115 1.0% Two or more races 58,424 1.0% Asian alone 13,654 0.2% American Indian alone 6,348 0.1% Other race alone 1,573 0.03% Native Hawaiian and Other
5,192,455 76.0% White alone 628,054 9.2% Black alone 534,528 7.8% Hispanic 263,242 3.9% Two or more races 172,880 2.5% Asian alone 33,467 0.5% Other race alone 5,866 0.09% American Indian alone 2,545 0.04% Native Hawaiian and Other
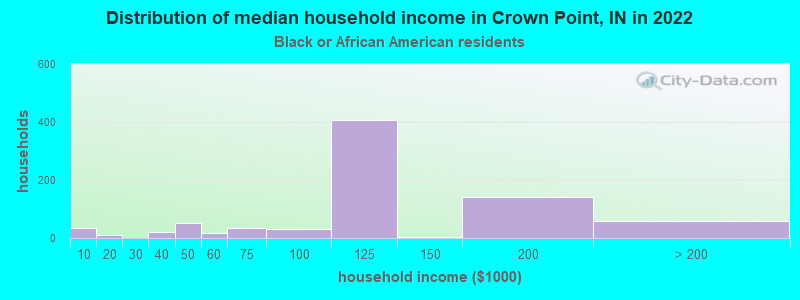
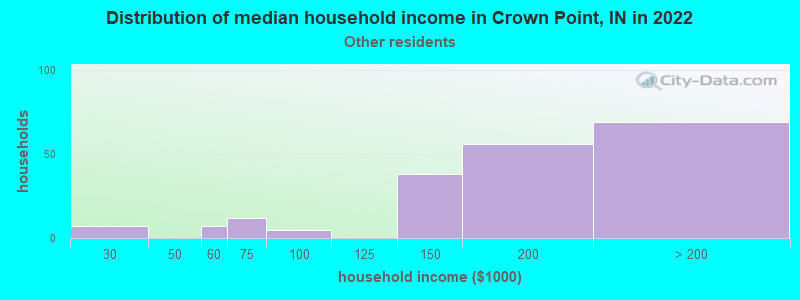
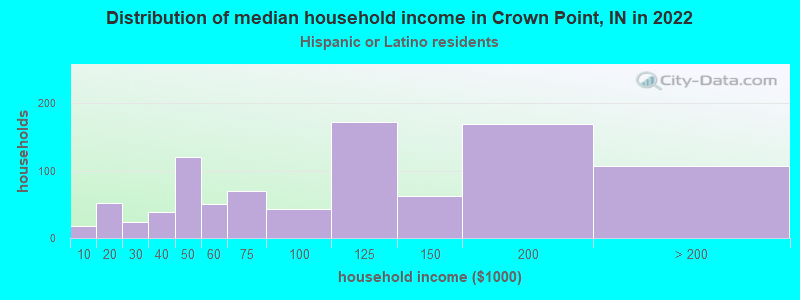
Income and house value in Crown Point Median household income in 2022 $84,464 White non-Hispanic householders$119,778 Black householders$160,779 Some other race householders$108,874 Two or more races householders$116,807 Hispanic or Latino race householdersMedian 2022 house value $292,288 White Non-Hispanic householders$364,719 Black or African American householders $273,656 Asian householders$174,674 Some other race householders$274,587 Two or more races householders$294,151 Hispanic or Latino householders
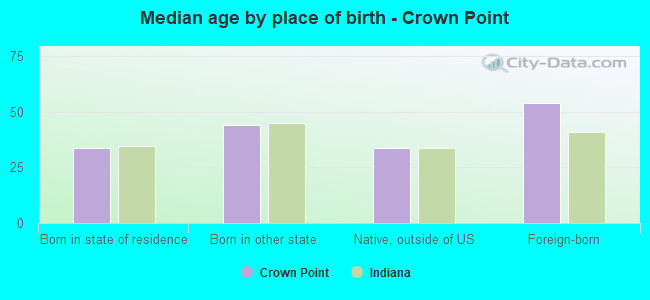
Median age by race in Crown Point
41.8 Median age for White residents40.7 42.3 33.9 Median age for Black or African American residents32.5 38.2 0.0 Median age for American Indian / Alaska Native residents-531,041,069.2 -482,477,587.1 54.6 Median age for Asian residents50.3 54.5 -664,335,663.7 Median age for Native Hawaiian / Pacific Islander residents-644,025,156.6 -664,437,011.6 43.9 Median age for Other race residents39.8 50.6 23.2 Median age for Two or more races residents21.0 23.6 42.1 Median age for White alone residents41.9 43.2 28.0 Median age for Hispanic or Latino residents28.3 27.9
Owner/renter occupied households by race in Crown Point
House owners and renters - White residents 9,035 87.2% Owner occupied1,325 12.8% Renter occupiedHouse owners and renters - Black or African American residents 484 77.0% Owner occupied144 23.0% Renter occupiedHouse owners and renters - Asian residents 139 72.7% Owner occupied52 27.3% Renter occupiedHouse owners and renters - Other race residents 147 89.1% Owner occupied18 10.9% Renter occupiedHouse owners and renters - Two or more races residents 674 86.2% Owner occupied108 13.8% Renter occupiedHouse owners and renters - White alone residents 8,980 87.0% Owner occupied1,339 13.0% Renter occupiedHouse owners and renters - Hispanic or Latino residents 777 83.8% Owner occupied150 16.2% Renter occupied
Language usage in Crown Point
English speakers - Total 86.5% of residents of Crown Point speak English at home.
5.8% of residents speak Spanish at home 1,276 68.8% Speak English very well578 31.2% Speak English less than very well7.7% of residents speak other language at home 1,854 75.7% Speak English very well595 24.3% Speak English less than very well
English speakers - Born in the United States 89.8% of residents of Crown Point speak English at home.
5.3% of residents speak Spanish at home 516 92.0% Speak English very well45 8.0% Speak English less than very well5.6% of residents speak other language at home 549 92.9% Speak English very well42 7.1% Speak English less than very well
English speakers - Native, born elsewhere 65.8% of residents of Crown Point speak English at home.
11.6% of residents speak Spanish at home 18 100.0% Speak English very well27.1% of residents speak other language at home 42 100.0% Speak English very well
English speakers - Foreign-born 25.8% of residents of Crown Point speak English at home.
18.4% of residents speak Spanish at home 144 35.3% Speak English very well264 64.7% Speak English less than very well58.5% of residents speak other language at home 851 65.5% Speak English very well449 34.5% Speak English less than very well
White (Caucasian) - Speak only English Native:
93.8% (21,288)Foreign-born:
20.5% (268)
White (Caucasian) - Speak another language Native:
6.1% (1,391)Foreign-born:
78.9% (1,032)
Black or African American - Speak another language Native:
7.0% (179)Foreign-born:
70.0% (14)
Asian - Speak only English Native:
73.7% (93)Foreign-born:
24.7% (67)
Asian - Speak another language Native:
26.2% (33)Foreign-born:
75.3% (205)
Other race - Speak another language Native:
18.6% (82)Foreign-born:
97.6% (90)
Two or more races - Speak only English Native:
72.5% (2,349)Foreign-born:
48.4% (188)
Two or more races - Speak another language Native:
22.7% (734)Foreign-born:
45.2% (175)
White alone - Speak only English Native:
94.9% (20,970)Foreign-born:
18.4% (258)
White alone - Speak another language Native:
5.5% (1,206)Foreign-born:
82.2% (1,152)
Hispanic or Latino - Speak only English Native:
63.8% (2,195)Foreign-born:
16.8% (96)
Hispanic or Latino - Speak another language Native:
35.6% (1,226)Foreign-born:
83.2% (473)
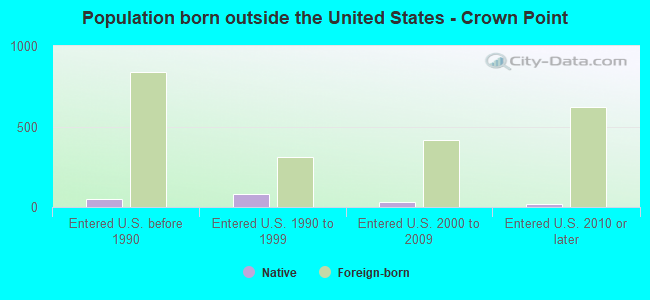
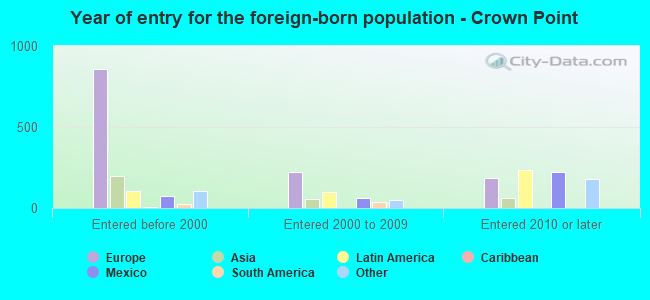
Foreign-born residents in Crown Point 2,293 residents are foreign born (3.3% Europe , 1.2% Latin America , 0.9% Asia ).
This city:
6.8%Indiana:
5.6%
Marital status for residents in Crown Point Marital status - White (Caucasian) population 15 years and over
Males 25.3% Never married60.7% Now married1.3% Separated5.0% Widowed7.6% DivorcedFemales 18.2% Never married56.7% Now married0.1% Separated11.6% Widowed13.4% DivorcedWomen who gave birth in the past 12 months Now married:
84.8% (323)Unmarried:
15.2% (58)
Women who did not give birth in the past 12 months Now married:
58.0% (2,732)Unmarried:
42.0% (1,975)
Marital status - Black or African American population 15 years and over
Males 63.3% Never married30.6% Now married1.9% Separated0.4% Widowed3.8% DivorcedFemales 39.5% Never married41.0% Now married1.1% Separated10.4% Widowed7.9% DivorcedWomen who gave birth in the past 12 months Now married:
0.0% (0)Unmarried:
100.0% (9)
Women who did not give birth in the past 12 months Now married:
36.1% (187)Unmarried:
63.9% (332)
Marital status - Asian population 15 years and over
Males 35.5% Never married64.5% Now married0.0% Separated0.0% Widowed0.0% DivorcedFemales 2.5% Never married81.9% Now married0.0% Separated4.3% Widowed11.3% DivorcedWomen who did not give birth in the past 12 months Now married:
80.7% (126)Unmarried:
19.3% (30)
Marital status - Other race population 15 years and over
Males 45.6% Never married40.7% Now married0.0% Separated0.0% Widowed13.8% DivorcedFemales 16.0% Never married64.1% Now married3.4% Separated12.1% Widowed4.4% DivorcedWomen who gave birth in the past 12 months Now married:
100.0% (46)Unmarried:
0.0% (0)
Women who did not give birth in the past 12 months Now married:
56.2% (52)Unmarried:
43.8% (40)
Marital status - Two or more races population 15 years and over
Males 50.4% Never married34.9% Now married1.3% Separated2.7% Widowed10.8% DivorcedFemales 33.1% Never married51.8% Now married0.0% Separated6.2% Widowed8.9% DivorcedWomen who gave birth in the past 12 months Now married:
100.0% (47)Unmarried:
0.0% (0)
Women who did not give birth in the past 12 months Now married:
44.0% (282)Unmarried:
56.0% (360)
Marital status - White alone, not Hispanic / Latino population 15 years and over
Males 24.5% Never married61.5% Now married1.0% Separated5.3% Widowed7.7% DivorcedFemales 16.8% Never married56.9% Now married0.1% Separated12.1% Widowed14.1% DivorcedWomen who gave birth in the past 12 months Now married:
82.7% (288)Unmarried:
17.3% (60)
Women who did not give birth in the past 12 months Now married:
59.3% (2,598)Unmarried:
40.7% (1,787)
Marital status - Hispanic or Latino population 15 years and over
Males 44.8% Never married40.0% Now married2.5% Separated1.8% Widowed10.9% DivorcedFemales 32.5% Never married55.6% Now married0.5% Separated5.8% Widowed5.6% DivorcedWomen who gave birth in the past 12 months Now married:
100.0% (106)Unmarried:
0.0% (0)
Women who did not give birth in the past 12 months Now married:
51.2% (539)Unmarried:
48.8% (513)
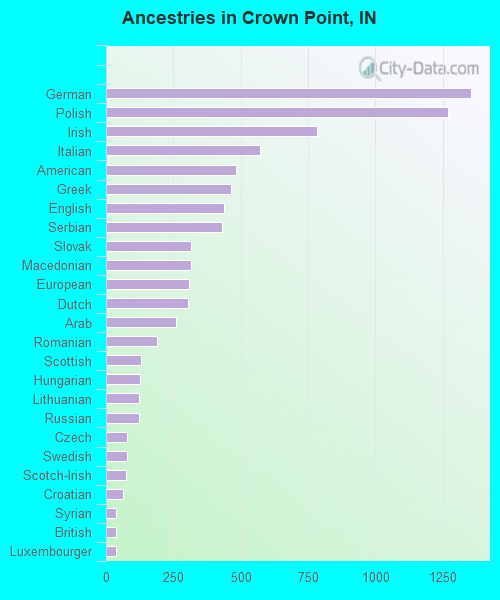
Ancestries in Crown Point
1,354 9.4% German1,270 8.8% Polish783 5.4% Irish570 4.0% Italian481 3.3% American464 3.2% Greek437 3.0% English431 3.0% Serbian317 2.2% Slovak314 2.2% Macedonian308 2.1% European306 2.1% Dutch258 1.8% Arab189 1.3% Romanian129 0.9% Scottish125 0.9% Hungarian123 0.9% Lithuanian122 0.8% Russian78 0.5% Czech77 0.5% Swedish73 0.5% Scotch-Irish62 0.4% Croatian38 0.3% Syrian36 0.2% British36 0.2% Luxembourger30 0.2% Norwegian27 0.2% French27 0.2% Nigerian27 0.2% Ukrainian26 0.2% French Canadian26 0.2% Welsh25 0.2% Northern European19 0.1% Finnish12 0.08% Egyptian12 0.08% Eastern European11 0.08% Scandinavian9 0.06% Palestinian
Geographical mobility in Crown Point Same house 1 year ago 22,663 89.7% White (Caucasian)2,470 91.3% Black or African American14 100.0% American Indian / Alaska Native380 88.1% Asian13 100.0% Native Hawaiian / Pacific Islander546 100.0% Other race3,635 92.3% Two or more races22,275 90.1% White alone, not Hispanic / Latino3,896 93.0% Hispanic or LatinoMoved within same county 1,626 6.4% White / Caucasian213 7.9% Black or African American19 4.5% Asian15 2.8% Other race68 1.7% Two or more races1,497 6.1% White alone, not Hispanic / Latino306 7.3% Hispanic or LatinoMoved within same state 166 0.7% White / Caucasian11 0.4% Black or African American11 2.5% Asian1 0.0% Two or more races151 0.6% White alone, not Hispanic / Latino12 0.3% Hispanic or LatinoMoved from different state 667 2.6% White / Caucasian41 1.5% Black or African American19 4.3% Asian115 2.9% Two or more races702 2.8% White alone, not Hispanic / Latino33 0.8% Hispanic or LatinoMoved from abroad 40 0.2% White40 0.2% White alone, not Hispanic / Latino
Children Nativity (place of birth) in Crown Point
Children under 6 years - Living with two parents Both parents native 1,872 100.0% NativeBoth parents foreign-born 50 100.0% NativeOne native, one foreign-born parent 481 100.0% NativeChildren under 6 years - Living with one parent Native parent 300 100.0% NativeChildren 6 to 17 years - Living with two parents Both parents native 3,458 100.0% NativeBoth parents foreign-born 109 100.0% NativeOne native, one foreign-born parent 379 75.1% Native126 24.9% Foreign-bornChildren 6 to 17 years - Living with one parent Native parent 1,490 100.0% Native
Grandparents responsible for own grandchildren in Crown Point
Grandparents (30 to 59 years) White / Caucasian 15 32.0% Responsible for grandchildren33 68.0% Not responsible for grandchildrenBlack or African American 77 100.0% Not responsible for grandchildrenTwo or more races 9 100.0% Not responsible for grandchildrenWhite alone, not Hispanic / Latino 21 100.0% Not responsible for grandchildrenHispanic or Latino 25 57.6% Responsible for grandchildren18 42.4% Not responsible for grandchildrenGrandparents (60 years and over) White / Caucasian 20 5.4% Responsible for grandchildren356 94.6% Not responsible for grandchildrenBlack or African American 22 100.0% Not responsible for grandchildrenWhite alone, not Hispanic / Latino 22 5.9% Responsible for grandchildren348 94.1% Not responsible for grandchildren