Races in Croydon, Pennsylvania (PA) Detailed Stats
Data:
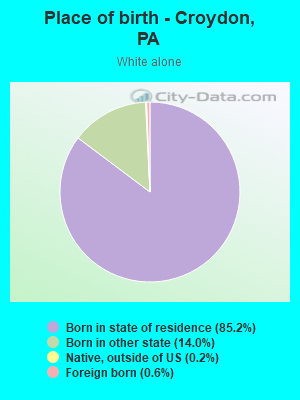
Races - White alone (%)
Races - White alone (% change since 2000)
Races - Black alone (%)
Races - Black alone (% change since 2000)
Races - American Indian alone (%)
Races - American Indian alone (% change since 2000)
Races - Asian alone (%)
Races - Asian alone (% change since 2000)
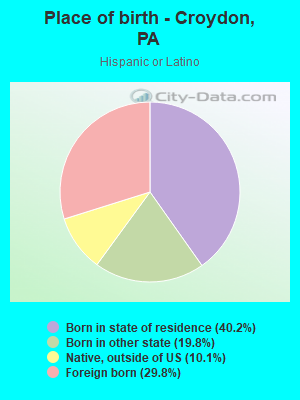
Races - Hispanic (%)
Races - Hispanic (% change since 2000)
Races - Native Hawaiian and Other Pacific Islander alone (%)
Races - Native Hawaiian and Other Pacific Islander alone (% change since 2000)
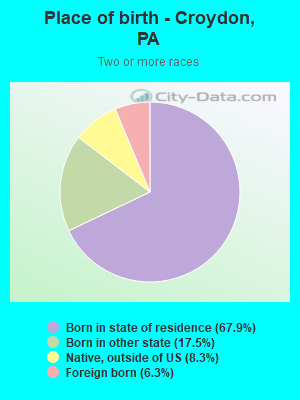
Races - Two or more races(%)
Races - Two or more races(% change since 2000)
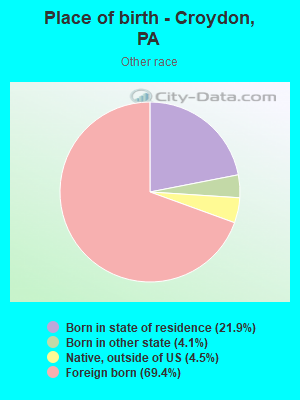
Races - Other race alone (%)
Races - Other race alone (% change since 2000)
Racial diversity
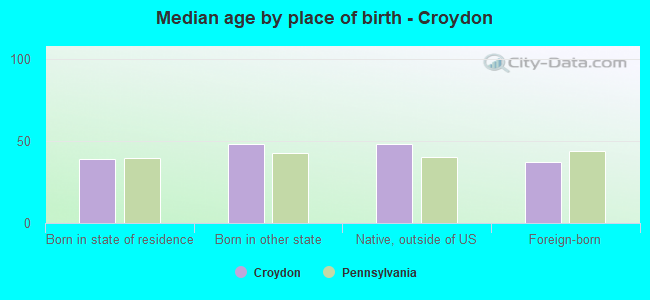
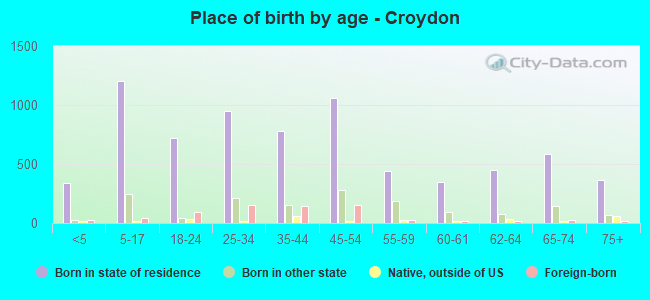
Place of birth - Born in state of residence (%)
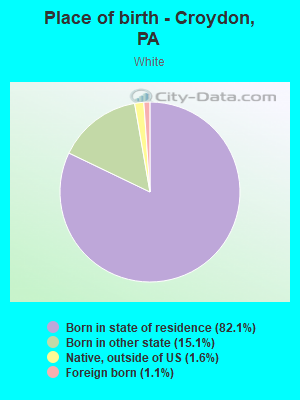
Place of birth - Born in state of residence (%) - White
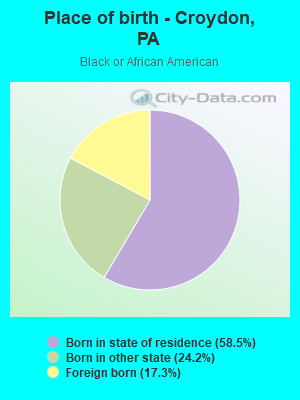
Place of birth - Born in state of residence (%) - Black or African American
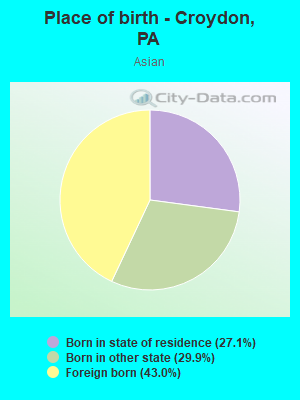
Place of birth - Born in state of residence (%) - Asian
Place of birth - Born in state of residence (%) - Hispanic or Latino
Place of birth - Born in state of residence (%) - American Indian and Alaska Native
Place of birth - Born in state of residence (%) - Multirace
Place of birth - Born in state of residence (%) - Other Race
Place of birth - Born in other state (%)
Place of birth - Born in other state (%) - White
Place of birth - Born in other state (%) - Black or African American
Place of birth - Born in other state (%) - Asian
Place of birth - Born in other state (%) - Hispanic or Latino
Place of birth - Born in other state (%) - American Indian and Alaska Native
Place of birth - Born in other state (%) - Multirace
Place of birth - Born in other state (%) - Other Race
Place of birth - Native, outside of US (%)
Place of birth - Native, outside of US (%) - White
Place of birth - Native, outside of US (%) - Black or African American
Place of birth - Native, outside of US (%) - Asian
Place of birth - Native, outside of US (%) - Hispanic or Latino
Place of birth - Native, outside of US (%) - American Indian and Alaska Native
Place of birth - Native, outside of US (%) - Multirace
Place of birth - Native, outside of US (%) - Other Race
Place of birth - Foreign born (%)
Place of birth - Foreign born (%) - White
Place of birth - Foreign born (%) - Black or African American
Place of birth - Foreign born (%) - Asian
Place of birth - Foreign born (%) - Hispanic or Latino
Place of birth - Foreign born (%) - American Indian and Alaska Native
Place of birth - Foreign born (%) - Multirace
Place of birth - Foreign born (%) - Other Race
Residents speaking English at home (%)
Residents speaking English at home - Born in the United States (%)
Residents speaking English at home - Native, born elsewhere (%)
Residents speaking English at home - Foreign born (%)
Residents speaking Spanish at home (%)
Residents speaking Spanish at home - Born in the United States (%)
Residents speaking Spanish at home - Native, born elsewhere (%)
Residents speaking Spanish at home - Foreign born (%)
Residents speaking other language at home (%)
Residents speaking other language at home - Born in the United States (%)
Residents speaking other language at home - Native, born elsewhere (%)
Residents speaking other language at home - Foreign born (%)
Marital status - Never married (%)
Marital status - Now married (%)
Marital status - Separated (%)
Marital status - Widowed (%)
Marital status - Divorced (%)
Ancestries Reported - Arab (%)
Ancestries Reported - Czech (%)
Ancestries Reported - Danish (%)
Ancestries Reported - Dutch (%)
Ancestries Reported - English (%)
Ancestries Reported - French (%)
Ancestries Reported - French Canadian (%)
Ancestries Reported - German (%)
Ancestries Reported - Greek (%)
Ancestries Reported - Hungarian (%)
Ancestries Reported - Irish (%)
Ancestries Reported - Italian (%)
Ancestries Reported - Lithuanian (%)
Ancestries Reported - Norwegian (%)
Ancestries Reported - Polish (%)
Ancestries Reported - Portuguese (%)
Ancestries Reported - Russian (%)
Ancestries Reported - Scotch-Irish (%)
Ancestries Reported - Scottish (%)
Ancestries Reported - Slovak (%)
Ancestries Reported - Subsaharan African (%)
Ancestries Reported - Swedish (%)
Ancestries Reported - Swiss (%)
Ancestries Reported - Ukrainian (%)
Ancestries Reported - United States (%)
Ancestries Reported - Welsh (%)
Ancestries Reported - West Indian (%)
Ancestries Reported - Other (%)
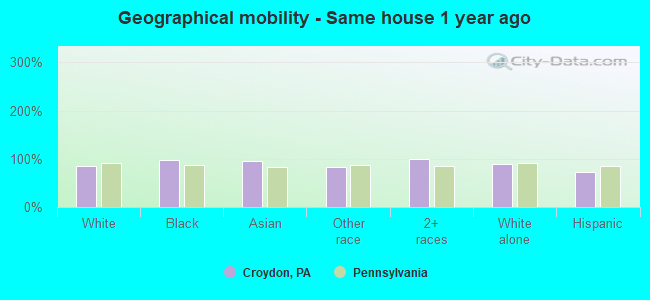
Geographical mobility - Same house 1 year ago (%)
Geographical mobility - Same house 1 year ago (%) - White
Geographical mobility - Same house 1 year ago (%) - Black or African American
Geographical mobility - Same house 1 year ago (%) - Asian
Geographical mobility - Same house 1 year ago (%) - Hispanic or Latino
Geographical mobility - Same house 1 year ago (%) - American Indian and Alaska Native
Geographical mobility - Same house 1 year ago (%) - Multirace
Geographical mobility - Same house 1 year ago (%) - Other Race
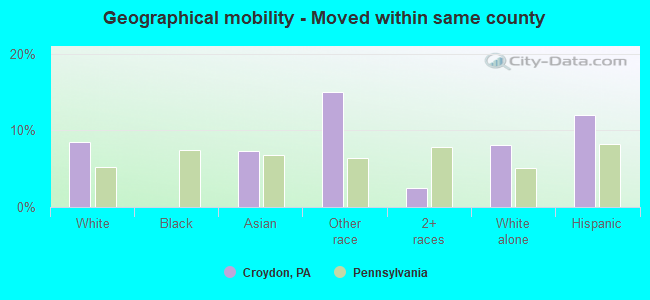
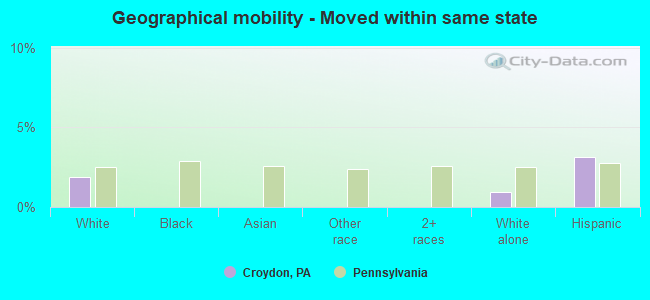
Geographical mobility - Moved within same county (%)
Geographical mobility - Moved within same county (%) - White
Geographical mobility - Moved within same county (%) - Black or African American
Geographical mobility - Moved within same county (%) - Asian
Geographical mobility - Moved within same county (%) - Hispanic or Latino
Geographical mobility - Moved within same county (%) - American Indian and Alaska Native
Geographical mobility - Moved within same county (%) - Multirace
Geographical mobility - Moved within same county (%) - Other Race
Geographical mobility - Moved from different county within same state (%)
Geographical mobility - Moved from different county within same state (%) - White
Geographical mobility - Moved from different county within same state (%) - Black or African American
Geographical mobility - Moved from different county within same state (%) - Asian
Geographical mobility - Moved from different county within same state (%) - Hispanic or Latino
Geographical mobility - Moved from different county within same state (%) - American Indian and Alaska Native
Geographical mobility - Moved from different county within same state (%) - Multirace
Geographical mobility - Moved from different county within same state (%) - Other Race
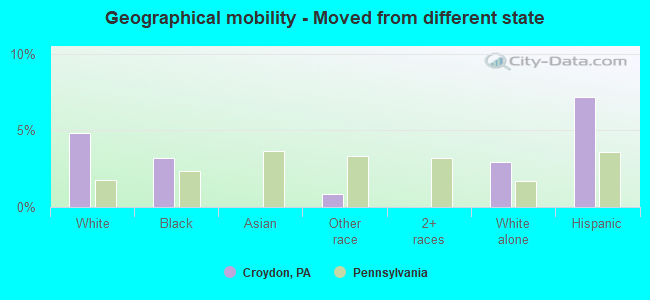
Geographical mobility - Moved from different state (%)
Geographical mobility - Moved from different state (%) - White
Geographical mobility - Moved from different state (%) - Black or African American
Geographical mobility - Moved from different state (%) - Asian
Geographical mobility - Moved from different state (%) - Hispanic or Latino
Geographical mobility - Moved from different state (%) - American Indian and Alaska Native
Geographical mobility - Moved from different state (%) - Multirace
Geographical mobility - Moved from different state (%) - Other Race
Geographical mobility - Moved from abroad (%)
Geographical mobility - Moved from abroad (%) - White
Geographical mobility - Moved from abroad (%) - Black or African American
Geographical mobility - Moved from abroad (%) - Asian
Geographical mobility - Moved from abroad (%) - Hispanic or Latino
Geographical mobility - Moved from abroad (%) - American Indian and Alaska Native
Geographical mobility - Moved from abroad (%) - Multirace
Geographical mobility - Moved from abroad (%) - Other Race
Place of birth for the foreign-born population - Ireland (%)
Place of birth for the foreign-born population - Denmark (%)
Place of birth for the foreign-born population - Norway (%)
Place of birth for the foreign-born population - Sweden (%)
Place of birth for the foreign-born population - United Kingdom (%)
Place of birth for the foreign-born population - England (%)
Place of birth for the foreign-born population - Scotland (%)
Place of birth for the foreign-born population - Other Northern Europe (%)
Place of birth for the foreign-born population - Austria (%)
Place of birth for the foreign-born population - Belgium (%)
Place of birth for the foreign-born population - France (%)
Place of birth for the foreign-born population - Germany (%)
Place of birth for the foreign-born population - Netherlands (%)
Place of birth for the foreign-born population - Switzerland (%)
Place of birth for the foreign-born population - Other Western Europe (%)
Place of birth for the foreign-born population - Greece (%)
Place of birth for the foreign-born population - Italy (%)
Place of birth for the foreign-born population - Portugal (%)
Place of birth for the foreign-born population - Spain (%)
Place of birth for the foreign-born population - Other Southern Europe (%)
Place of birth for the foreign-born population - Albania (%)
Place of birth for the foreign-born population - Belarus (%)
Place of birth for the foreign-born population - Bosnia and Herzegovina (%)
Place of birth for the foreign-born population - Bulgaria (%)
Place of birth for the foreign-born population - Croatia (%)
Place of birth for the foreign-born population - Czechoslovakia (%)
Place of birth for the foreign-born population - Hungary (%)
Place of birth for the foreign-born population - Latvia (%)
Place of birth for the foreign-born population - Lithuania (%)
Place of birth for the foreign-born population - North Macedonia (Macedonia) (%)
Place of birth for the foreign-born population - Moldova (%)
Place of birth for the foreign-born population - Poland (%)
Place of birth for the foreign-born population - Romania (%)
Place of birth for the foreign-born population - Russia (%)
Place of birth for the foreign-born population - Serbia (%)
Place of birth for the foreign-born population - Ukraine (%)
Place of birth for the foreign-born population - Other Eastern Europe (%)
Place of birth for the foreign-born population - China (%)
Place of birth for the foreign-born population - Hong Kong (%)
Place of birth for the foreign-born population - Taiwan (%)
Place of birth for the foreign-born population - Japan (%)
Place of birth for the foreign-born population - Korea (%)
Place of birth for the foreign-born population - Other Eastern Asia (%)
Place of birth for the foreign-born population - Afghanistan (%)
Place of birth for the foreign-born population - Bangladesh (%)
Place of birth for the foreign-born population - India (%)
Place of birth for the foreign-born population - Iran (%)
Place of birth for the foreign-born population - Kazakhstan (%)
Place of birth for the foreign-born population - Nepal (%)
Place of birth for the foreign-born population - Pakistan (%)
Place of birth for the foreign-born population - Sri Lanka (%)
Place of birth for the foreign-born population - Uzbekistan (%)
Place of birth for the foreign-born population - Other South Central Asia (%)
Place of birth for the foreign-born population - Burma (%)
Place of birth for the foreign-born population - Cambodia (%)
Place of birth for the foreign-born population - Indonesia (%)
Place of birth for the foreign-born population - Laos (%)
Place of birth for the foreign-born population - Malaysia (%)
Place of birth for the foreign-born population - Philippines (%)
Place of birth for the foreign-born population - Singapore (%)
Place of birth for the foreign-born population - Thailand (%)
Place of birth for the foreign-born population - Vietnam (%)
Place of birth for the foreign-born population - Other South Eastern Asia (%)
Place of birth for the foreign-born population - Armenia (%)
Place of birth for the foreign-born population - Iraq (%)
Place of birth for the foreign-born population - Israel (%)
Place of birth for the foreign-born population - Jordan (%)
Place of birth for the foreign-born population - Kuwait (%)
Place of birth for the foreign-born population - Lebanon (%)
Place of birth for the foreign-born population - Saudi Arabia (%)
Place of birth for the foreign-born population - Syria (%)
Place of birth for the foreign-born population - Turkey (%)
Place of birth for the foreign-born population - Yemen (%)
Place of birth for the foreign-born population - Other Western Asia (%)
Place of birth for the foreign-born population - Eritrea (%)
Place of birth for the foreign-born population - Ethiopia (%)
Place of birth for the foreign-born population - Kenya (%)
Place of birth for the foreign-born population - Somalia (%)
Place of birth for the foreign-born population - Uganda (%)
Place of birth for the foreign-born population - Zimbabwe (%)
Place of birth for the foreign-born population - Other Eastern Africa (%)
Place of birth for the foreign-born population - Cameroon (%)
Place of birth for the foreign-born population - Congo (%)
Place of birth for the foreign-born population - Democratic Republic of Congo (Zaire) (%)
Place of birth for the foreign-born population - Other Middle Africa (%)
Place of birth for the foreign-born population - Egypt (%)
Place of birth for the foreign-born population - Morocco (%)
Place of birth for the foreign-born population - Sudan (%)
Place of birth for the foreign-born population - Other Northern Africa (%)
Place of birth for the foreign-born population - South Africa (%)
Place of birth for the foreign-born population - Other Southern Africa (%)
Place of birth for the foreign-born population - Cabo Verde (%)
Place of birth for the foreign-born population - Ghana (%)
Place of birth for the foreign-born population - Liberia (%)
Place of birth for the foreign-born population - Nigeria (%)
Place of birth for the foreign-born population - Senegal (%)
Place of birth for the foreign-born population - Sierra Leone (%)
Place of birth for the foreign-born population - Other Western Africa (%)
Place of birth for the foreign-born population - Australia (%)
Place of birth for the foreign-born population - New Zealand (%)
Place of birth for the foreign-born population - Fiji (%)
Place of birth for the foreign-born population - Micronesia (%)
Place of birth for the foreign-born population - Bahamas (%)
Place of birth for the foreign-born population - Barbados (%)
Place of birth for the foreign-born population - Cuba (%)
Place of birth for the foreign-born population - Dominica (%)
Place of birth for the foreign-born population - Dominican Republic (%)
Place of birth for the foreign-born population - Grenada (%)
Place of birth for the foreign-born population - Haiti (%)
Place of birth for the foreign-born population - Jamaica (%)
Place of birth for the foreign-born population - St. Vincent and the Grenadines (%)
Place of birth for the foreign-born population - Trinidad and Tobago (%)
Place of birth for the foreign-born population - West Indies (%)
Place of birth for the foreign-born population - Other Caribbean (%)
Place of birth for the foreign-born population - Belize (%)
Place of birth for the foreign-born population - Costa Rica (%)
Place of birth for the foreign-born population - El Salvador (%)
Place of birth for the foreign-born population - Guatemala (%)
Place of birth for the foreign-born population - Honduras (%)
Place of birth for the foreign-born population - Mexico (%)
Place of birth for the foreign-born population - Nicaragua (%)
Place of birth for the foreign-born population - Panama (%)
Place of birth for the foreign-born population - Other Central America (%)
Place of birth for the foreign-born population - Argentina (%)
Place of birth for the foreign-born population - Bolivia (%)
Place of birth for the foreign-born population - Brazil (%)
Place of birth for the foreign-born population - Chile (%)
Place of birth for the foreign-born population - Colombia (%)
Place of birth for the foreign-born population - Ecuador (%)
Place of birth for the foreign-born population - Guyana (%)
Place of birth for the foreign-born population - Peru (%)
Place of birth for the foreign-born population - Uruguay (%)
Place of birth for the foreign-born population - Venezuela (%)
Place of birth for the foreign-born population - Other South America (%)
Place of birth for the foreign-born population - Canada (%)
Place of birth for the foreign-born population - Other Northern America (%)
Place of birth for the foreign-born population - Other (%)
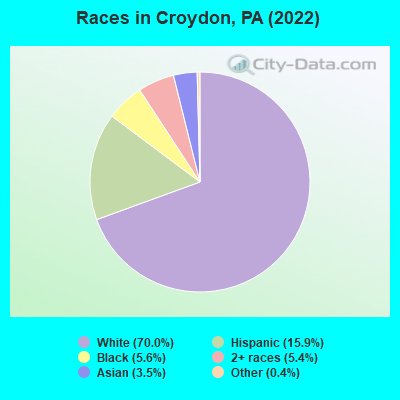
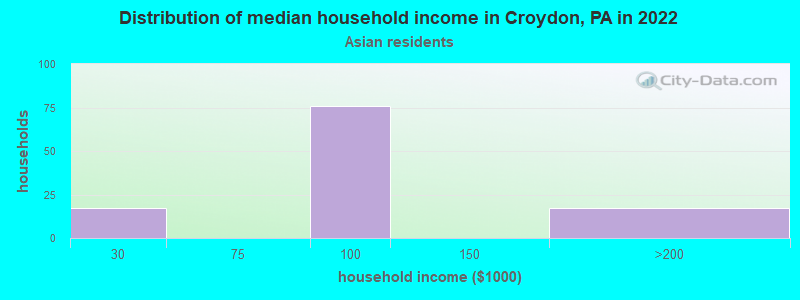
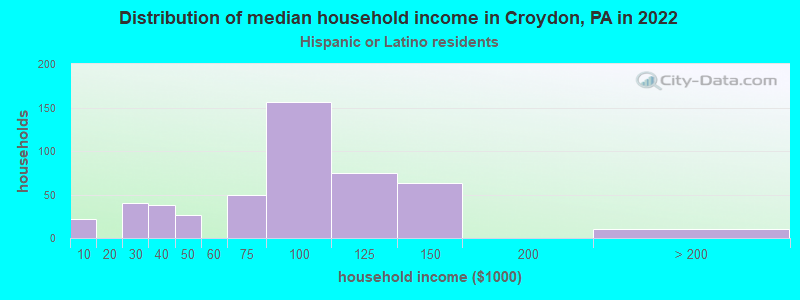
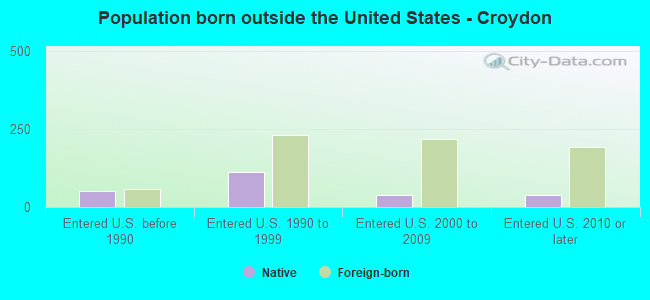
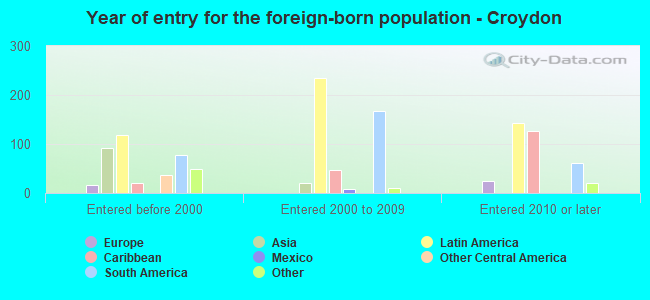
According to 2022 data, the most numerous races in Croydon, PA are White alone (6,829 residents), Black alone (547 residents), and Hispanic (1,554 residents). 87.1% of Croydon residents speak English at home. 7.1% of Croydon, PA residents are foreign-born (3.9% born in Latin America, 1.3% born in Asia, 1.0% born in Africa), which is about the same as the foreign-born rate of 7.0% across the entire state of Pennsylvania.
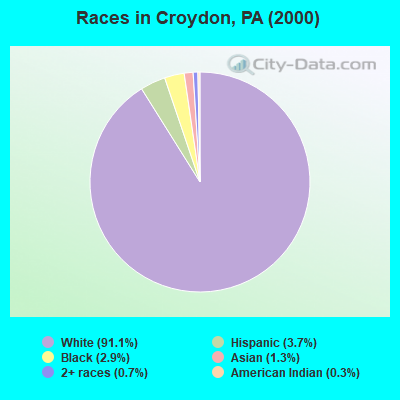
Race distribution in Croydon
2000 2022
10,322,455 84.1% White alone 1,202,437 9.8% Black alone 394,088 3.2% Hispanic 218,296 1.8% Asian alone 113,097 0.9% Two or more races 13,086 0.1% Other race alone 14,904 0.1% American Indian alone 2,691 0.02% Native Hawaiian and Other
9,487,228 73.1% White alone 1,311,581 10.1% Black alone 1,115,997 8.6% Hispanic 493,942 3.8% Two or more races 487,124 3.8% Asian alone 63,582 0.5% Other race alone 10,130 0.08% American Indian alone 2,424 0.02% Native Hawaiian and Other
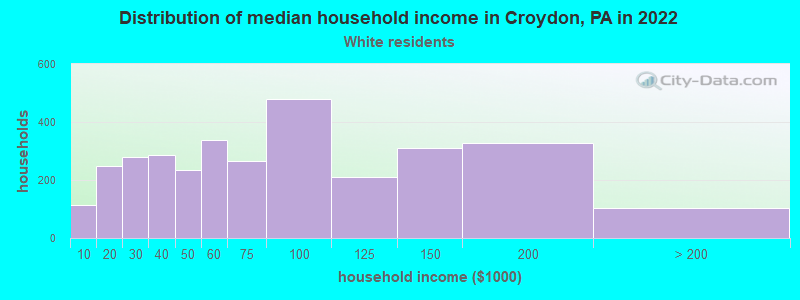
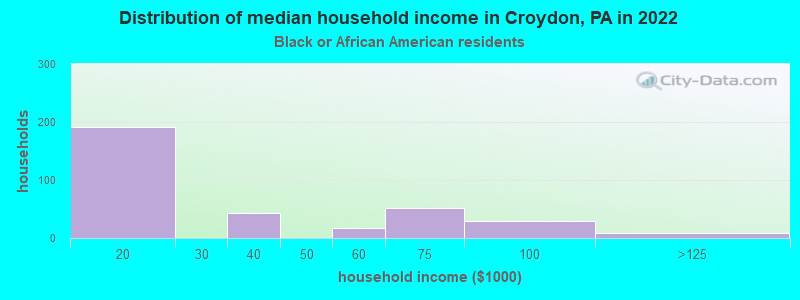
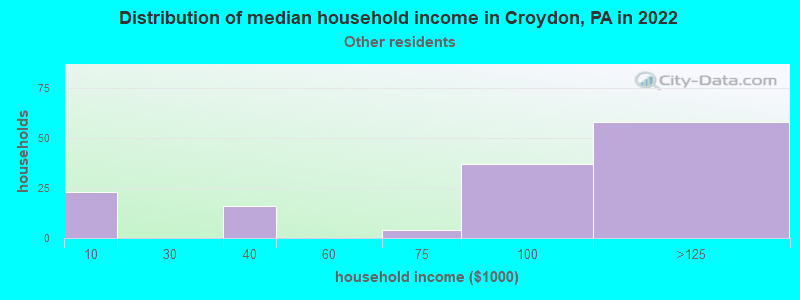
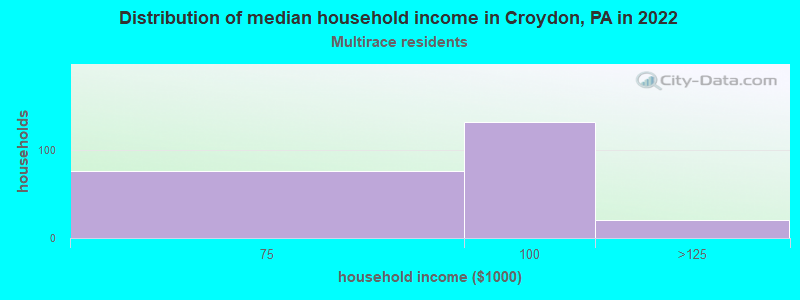
Income and house value in Croydon Median household income in 2022 $68,681 White non-Hispanic householders$20,743 Black householders$93,193 Asian householders$80,705 Some other race householders$78,807 Two or more races householders$80,357 Hispanic or Latino race householdersMedian 2022 house value $260,409 White Non-Hispanic householders$338,655 Black or African American householders$232,290 American Indian or Alaska Native householders $260,898 Asian householders$275,080 Some other race householders$254,052 Hispanic or Latino householders
Median age by race in Croydon
46.1 Median age for White residents47.9 45.7 47.8 Median age for Black or African American residents46.6 47.0 -674,382,715.4 Median age for American Indian / Alaska Native residents-668,138,336.3 -858,283,432.3 26.4 Median age for Asian residents26.5 29.2 -680,432,644.4 Median age for Native Hawaiian / Pacific Islander residents-649,523,808.9 -747,474,746.7 30.3 Median age for Other race residents18.8 30.0 28.8 Median age for Two or more races residents30.7 25.0 46.4 Median age for White alone residents47.8 46.1 34.4 Median age for Hispanic or Latino residents42.2 29.8
Owner/renter occupied households by race in Croydon
House owners and renters - White residents 2,527 80.4% Owner occupied618 19.6% Renter occupiedHouse owners and renters - Black or African American residents 36 11.6% Owner occupied278 88.4% Renter occupiedHouse owners and renters - Asian residents 98 100.0% Owner occupiedHouse owners and renters - Other race residents 136 92.1% Owner occupied12 7.9% Renter occupiedHouse owners and renters - Two or more races residents 195 80.6% Owner occupied47 19.4% Renter occupiedHouse owners and renters - White alone residents 2,451 81.6% Owner occupied555 18.4% Renter occupiedHouse owners and renters - Hispanic or Latino residents 358 75.4% Owner occupied116 24.6% Renter occupied
Language usage in Croydon
English speakers - Total 87.1% of residents of Croydon speak English at home.
9.5% of residents speak Spanish at home 556 62.7% Speak English very well331 37.3% Speak English less than very well3.8% of residents speak other language at home 204 57.8% Speak English very well149 42.2% Speak English less than very well
English speakers - Born in the United States 85.5% of residents of Croydon speak English at home.
11.5% of residents speak Spanish at home 125 71.4% Speak English very well50 28.6% Speak English less than very well2.7% of residents speak other language at home 42 100.0% Speak English less than very well
English speakers - Native, born elsewhere 23.2% of residents of Croydon speak English at home.
49.5% of residents speak Spanish at home 76 77.6% Speak English very well22 22.4% Speak English less than very well
English speakers - Foreign-born 18.1% of residents of Croydon speak English at home.
51.2% of residents speak Spanish at home 105 31.8% Speak English very well225 68.2% Speak English less than very well30.7% of residents speak other language at home 113 57.1% Speak English very well85 42.9% Speak English less than very well
White (Caucasian) - Speak only English Native:
95.8% (6,805)Foreign-born:
12.3% (10)
White (Caucasian) - Speak another language Native:
3.7% (263)Foreign-born:
88.3% (71)
Black or African American - Speak only English Native:
98.7% (459)Foreign-born:
63.6% (68)
Asian - Speak another language Native:
34.4% (58)Foreign-born:
99.6% (142)
Other race - Speak another language Native:
96.5% (154)Foreign-born:
88.4% (297)
Two or more races - Speak another language Native:
20.2% (173)Foreign-born:
100.0% (60)
White alone - Speak only English Native:
98.0% (6,507)Foreign-born:
25.1% (10)
White alone - Speak another language Native:
2.0% (136)Foreign-born:
74.8% (30)
Hispanic or Latino - Speak another language Native:
46.2% (461)Foreign-born:
91.7% (367)
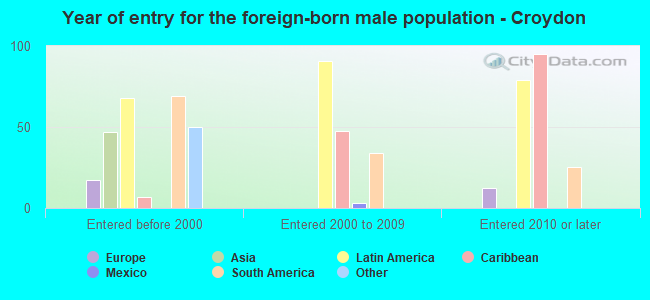
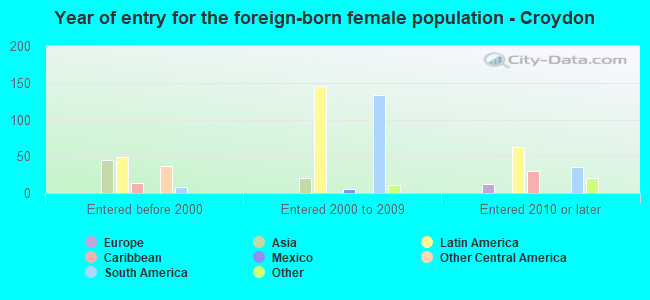
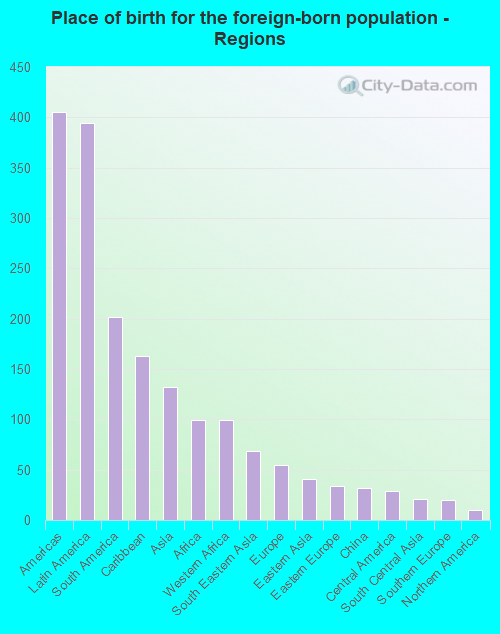
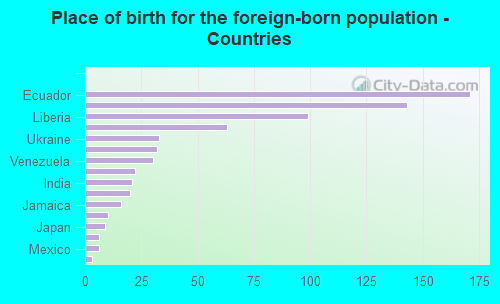
Foreign-born residents in Croydon 692 residents are foreign born (3.9% Latin America , 1.3% Asia , 1.0% Africa ).
This city:
7.1%Pennsylvania:
7.3%
Marital status for residents in Croydon Marital status - White (Caucasian) population 15 years and over
Males 35.2% Never married49.1% Now married1.5% Separated2.7% Widowed11.5% DivorcedFemales 34.2% Never married45.4% Now married0.3% Separated8.4% Widowed11.7% DivorcedWomen who gave birth in the past 12 months Now married:
0.0% (0)Unmarried:
100.0% (36)
Women who did not give birth in the past 12 months Now married:
30.4% (504)Unmarried:
69.6% (1,152)
Marital status - Black or African American population 15 years and over
Males 52.2% Never married3.4% Now married0.0% Separated0.0% Widowed44.4% DivorcedFemales 49.3% Never married9.2% Now married0.0% Separated27.1% Widowed14.4% DivorcedWomen who gave birth in the past 12 months Now married:
0.0% (0)Unmarried:
100.0% (19)
Women who did not give birth in the past 12 months Now married:
15.0% (16)Unmarried:
85.0% (92)
Marital status - Asian population 15 years and over
Males 54.7% Never married45.3% Now married0.0% Separated0.0% Widowed0.0% DivorcedFemales 22.1% Never married61.9% Now married0.0% Separated0.0% Widowed15.9% DivorcedWomen who gave birth in the past 12 months Now married:
100.0% (15)Unmarried:
0.0% (0)
Women who did not give birth in the past 12 months Now married:
50.6% (47)Unmarried:
49.4% (45)
Marital status - Other race population 15 years and over
Males 49.2% Never married43.7% Now married7.1% Separated0.0% Widowed0.0% DivorcedFemales 51.1% Never married30.9% Now married18.0% Separated0.0% Widowed0.0% DivorcedWomen who gave birth in the past 12 months Now married:
100.0% (52)Unmarried:
0.0% (0)
Women who did not give birth in the past 12 months Now married:
18.4% (25)Unmarried:
81.6% (113)
Marital status - Two or more races population 15 years and over
Males 53.8% Never married38.6% Now married0.0% Separated0.0% Widowed7.6% DivorcedFemales 55.2% Never married31.4% Now married0.0% Separated7.3% Widowed6.1% DivorcedWomen who did not give birth in the past 12 months Now married:
29.5% (102)Unmarried:
70.5% (245)
Marital status - White alone, not Hispanic / Latino population 15 years and over
Males 35.6% Never married47.6% Now married1.7% Separated2.9% Widowed12.3% DivorcedFemales 33.6% Never married45.4% Now married0.4% Separated9.3% Widowed11.4% DivorcedWomen who gave birth in the past 12 months Now married:
0.0% (0)Unmarried:
100.0% (24)
Women who did not give birth in the past 12 months Now married:
30.6% (462)Unmarried:
69.4% (1,050)
Marital status - Hispanic or Latino population 15 years and over
Males 36.9% Never married60.6% Now married2.5% Separated0.0% Widowed0.0% DivorcedFemales 46.9% Never married38.0% Now married3.7% Separated3.6% Widowed7.7% DivorcedWomen who gave birth in the past 12 months Now married:
71.7% (37)Unmarried:
28.3% (15)
Women who did not give birth in the past 12 months Now married:
29.4% (141)Unmarried:
70.6% (337)
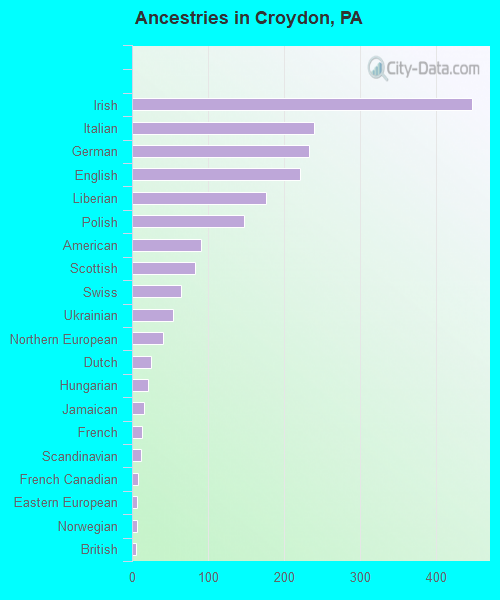
Ancestries in Croydon
447 14.9% Irish239 8.0% Italian233 7.8% German221 7.4% English176 5.9% Liberian147 4.9% Polish91 3.0% American83 2.8% Scottish65 2.2% Swiss54 1.8% Ukrainian41 1.4% Northern European25 0.8% Dutch21 0.7% Hungarian16 0.5% Jamaican13 0.4% French12 0.4% Scandinavian8 0.3% French Canadian7 0.2% Eastern European6 0.2% Norwegian5 0.2% British4 0.1% African
Children Nativity (place of birth) in Croydon
Children under 6 years - Living with two parents Both parents native 109 100.0% NativeBoth parents foreign-born 72 80.3% Native18 19.7% Foreign-bornChildren under 6 years - Living with one parent Native parent 178 100.0% NativeChildren 6 to 17 years - Living with two parents Both parents native 588 100.0% NativeBoth parents foreign-born 67 59.0% Native46 41.0% Foreign-bornOne native, one foreign-born parent 51 100.0% NativeChildren 6 to 17 years - Living with one parent Native parent 470 100.0% NativeForeign-born parent 128 51.1% Native123 48.9% Foreign-born
Grandparents responsible for own grandchildren in Croydon
Grandparents (30 to 59 years) White / Caucasian 53 100.0% Not responsible for grandchildrenTwo or more races 20 100.0% Not responsible for grandchildrenWhite alone, not Hispanic / Latino 57 100.0% Not responsible for grandchildrenGrandparents (60 years and over) White / Caucasian 44 36.8% Responsible for grandchildren75 63.2% Not responsible for grandchildrenTwo or more races 14 100.0% Not responsible for grandchildrenWhite alone, not Hispanic / Latino 44 36.5% Responsible for grandchildren76 63.5% Not responsible for grandchildren