Races in Crystal Lake, Illinois (IL) Detailed Stats
Data:
Races - White alone (%)
Races - White alone (% change since 2000)
Races - Black alone (%)
Races - Black alone (% change since 2000)
Races - American Indian alone (%)
Races - American Indian alone (% change since 2000)
Races - Asian alone (%)
Races - Asian alone (% change since 2000)
Races - Hispanic (%)
Races - Hispanic (% change since 2000)
Races - Native Hawaiian and Other Pacific Islander alone (%)
Races - Native Hawaiian and Other Pacific Islander alone (% change since 2000)
Races - Two or more races(%)
Races - Two or more races(% change since 2000)
Races - Other race alone (%)
Races - Other race alone (% change since 2000)
Racial diversity
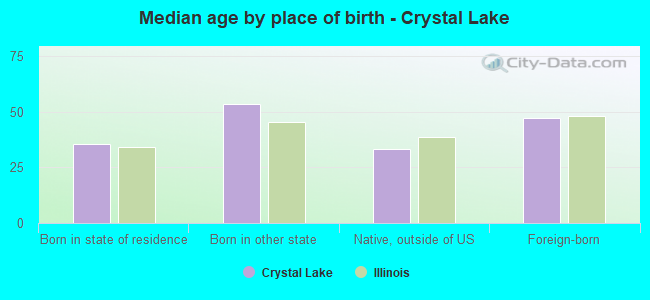
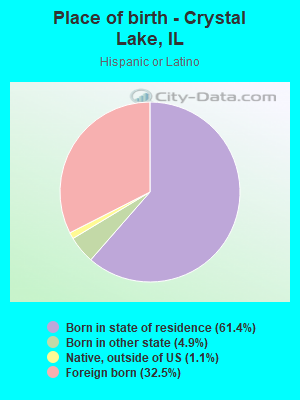
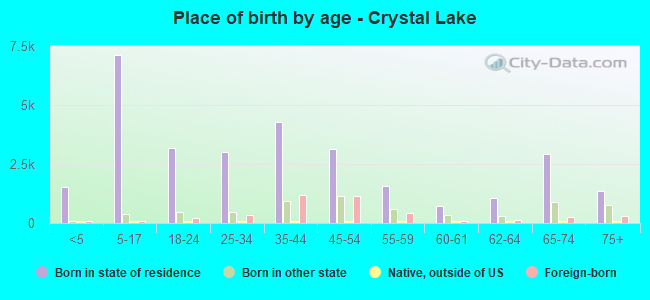
Place of birth - Born in state of residence (%)
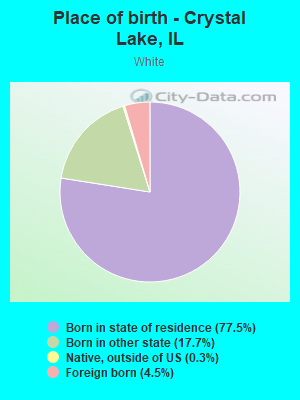
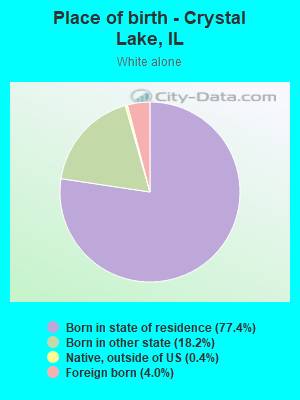
Place of birth - Born in state of residence (%) - White
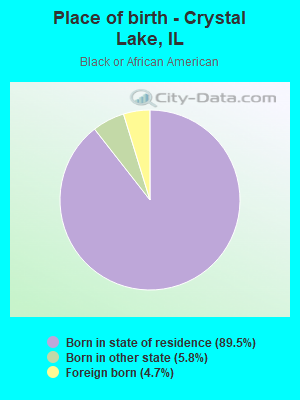
Place of birth - Born in state of residence (%) - Black or African American
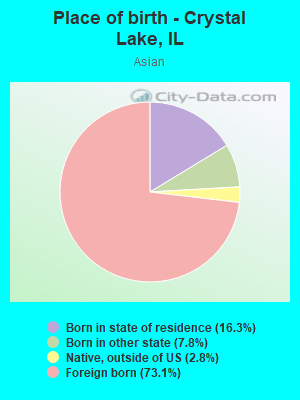
Place of birth - Born in state of residence (%) - Asian
Place of birth - Born in state of residence (%) - Hispanic or Latino
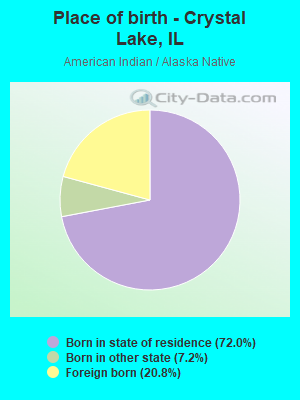
Place of birth - Born in state of residence (%) - American Indian and Alaska Native
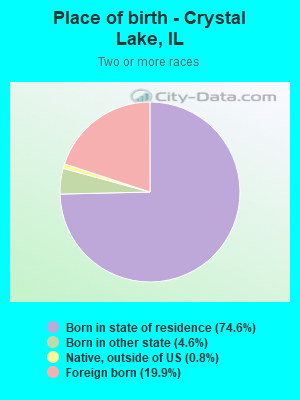
Place of birth - Born in state of residence (%) - Multirace
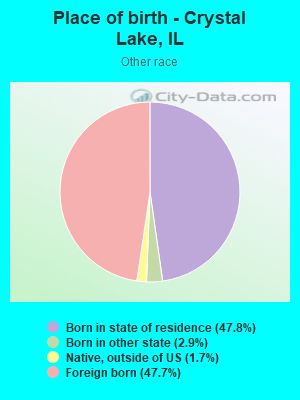
Place of birth - Born in state of residence (%) - Other Race
Place of birth - Born in other state (%)
Place of birth - Born in other state (%) - White
Place of birth - Born in other state (%) - Black or African American
Place of birth - Born in other state (%) - Asian
Place of birth - Born in other state (%) - Hispanic or Latino
Place of birth - Born in other state (%) - American Indian and Alaska Native
Place of birth - Born in other state (%) - Multirace
Place of birth - Born in other state (%) - Other Race
Place of birth - Native, outside of US (%)
Place of birth - Native, outside of US (%) - White
Place of birth - Native, outside of US (%) - Black or African American
Place of birth - Native, outside of US (%) - Asian
Place of birth - Native, outside of US (%) - Hispanic or Latino
Place of birth - Native, outside of US (%) - American Indian and Alaska Native
Place of birth - Native, outside of US (%) - Multirace
Place of birth - Native, outside of US (%) - Other Race
Place of birth - Foreign born (%)
Place of birth - Foreign born (%) - White
Place of birth - Foreign born (%) - Black or African American
Place of birth - Foreign born (%) - Asian
Place of birth - Foreign born (%) - Hispanic or Latino
Place of birth - Foreign born (%) - American Indian and Alaska Native
Place of birth - Foreign born (%) - Multirace
Place of birth - Foreign born (%) - Other Race
Residents speaking English at home (%)
Residents speaking English at home - Born in the United States (%)
Residents speaking English at home - Native, born elsewhere (%)
Residents speaking English at home - Foreign born (%)
Residents speaking Spanish at home (%)
Residents speaking Spanish at home - Born in the United States (%)
Residents speaking Spanish at home - Native, born elsewhere (%)
Residents speaking Spanish at home - Foreign born (%)
Residents speaking other language at home (%)
Residents speaking other language at home - Born in the United States (%)
Residents speaking other language at home - Native, born elsewhere (%)
Residents speaking other language at home - Foreign born (%)
Marital status - Never married (%)
Marital status - Now married (%)
Marital status - Separated (%)
Marital status - Widowed (%)
Marital status - Divorced (%)
Ancestries Reported - Arab (%)
Ancestries Reported - Czech (%)
Ancestries Reported - Danish (%)
Ancestries Reported - Dutch (%)
Ancestries Reported - English (%)
Ancestries Reported - French (%)
Ancestries Reported - French Canadian (%)
Ancestries Reported - German (%)
Ancestries Reported - Greek (%)
Ancestries Reported - Hungarian (%)
Ancestries Reported - Irish (%)
Ancestries Reported - Italian (%)
Ancestries Reported - Lithuanian (%)
Ancestries Reported - Norwegian (%)
Ancestries Reported - Polish (%)
Ancestries Reported - Portuguese (%)
Ancestries Reported - Russian (%)
Ancestries Reported - Scotch-Irish (%)
Ancestries Reported - Scottish (%)
Ancestries Reported - Slovak (%)
Ancestries Reported - Subsaharan African (%)
Ancestries Reported - Swedish (%)
Ancestries Reported - Swiss (%)
Ancestries Reported - Ukrainian (%)
Ancestries Reported - United States (%)
Ancestries Reported - Welsh (%)
Ancestries Reported - West Indian (%)
Ancestries Reported - Other (%)
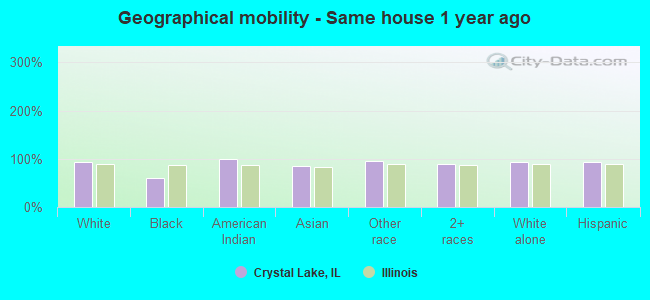
Geographical mobility - Same house 1 year ago (%)
Geographical mobility - Same house 1 year ago (%) - White
Geographical mobility - Same house 1 year ago (%) - Black or African American
Geographical mobility - Same house 1 year ago (%) - Asian
Geographical mobility - Same house 1 year ago (%) - Hispanic or Latino
Geographical mobility - Same house 1 year ago (%) - American Indian and Alaska Native
Geographical mobility - Same house 1 year ago (%) - Multirace
Geographical mobility - Same house 1 year ago (%) - Other Race
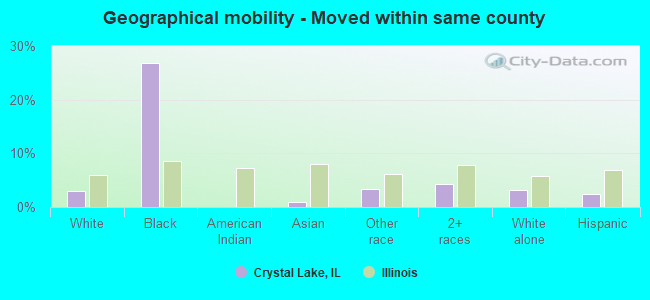
Geographical mobility - Moved within same county (%)
Geographical mobility - Moved within same county (%) - White
Geographical mobility - Moved within same county (%) - Black or African American
Geographical mobility - Moved within same county (%) - Asian
Geographical mobility - Moved within same county (%) - Hispanic or Latino
Geographical mobility - Moved within same county (%) - American Indian and Alaska Native
Geographical mobility - Moved within same county (%) - Multirace
Geographical mobility - Moved within same county (%) - Other Race
Geographical mobility - Moved from different county within same state (%)
Geographical mobility - Moved from different county within same state (%) - White
Geographical mobility - Moved from different county within same state (%) - Black or African American
Geographical mobility - Moved from different county within same state (%) - Asian
Geographical mobility - Moved from different county within same state (%) - Hispanic or Latino
Geographical mobility - Moved from different county within same state (%) - American Indian and Alaska Native
Geographical mobility - Moved from different county within same state (%) - Multirace
Geographical mobility - Moved from different county within same state (%) - Other Race
Geographical mobility - Moved from different state (%)
Geographical mobility - Moved from different state (%) - White
Geographical mobility - Moved from different state (%) - Black or African American
Geographical mobility - Moved from different state (%) - Asian
Geographical mobility - Moved from different state (%) - Hispanic or Latino
Geographical mobility - Moved from different state (%) - American Indian and Alaska Native
Geographical mobility - Moved from different state (%) - Multirace
Geographical mobility - Moved from different state (%) - Other Race
Geographical mobility - Moved from abroad (%)
Geographical mobility - Moved from abroad (%) - White
Geographical mobility - Moved from abroad (%) - Black or African American
Geographical mobility - Moved from abroad (%) - Asian
Geographical mobility - Moved from abroad (%) - Hispanic or Latino
Geographical mobility - Moved from abroad (%) - American Indian and Alaska Native
Geographical mobility - Moved from abroad (%) - Multirace
Geographical mobility - Moved from abroad (%) - Other Race
Place of birth for the foreign-born population - Ireland (%)
Place of birth for the foreign-born population - Denmark (%)
Place of birth for the foreign-born population - Norway (%)
Place of birth for the foreign-born population - Sweden (%)
Place of birth for the foreign-born population - United Kingdom (%)
Place of birth for the foreign-born population - England (%)
Place of birth for the foreign-born population - Scotland (%)
Place of birth for the foreign-born population - Other Northern Europe (%)
Place of birth for the foreign-born population - Austria (%)
Place of birth for the foreign-born population - Belgium (%)
Place of birth for the foreign-born population - France (%)
Place of birth for the foreign-born population - Germany (%)
Place of birth for the foreign-born population - Netherlands (%)
Place of birth for the foreign-born population - Switzerland (%)
Place of birth for the foreign-born population - Other Western Europe (%)
Place of birth for the foreign-born population - Greece (%)
Place of birth for the foreign-born population - Italy (%)
Place of birth for the foreign-born population - Portugal (%)
Place of birth for the foreign-born population - Spain (%)
Place of birth for the foreign-born population - Other Southern Europe (%)
Place of birth for the foreign-born population - Albania (%)
Place of birth for the foreign-born population - Belarus (%)
Place of birth for the foreign-born population - Bosnia and Herzegovina (%)
Place of birth for the foreign-born population - Bulgaria (%)
Place of birth for the foreign-born population - Croatia (%)
Place of birth for the foreign-born population - Czechoslovakia (%)
Place of birth for the foreign-born population - Hungary (%)
Place of birth for the foreign-born population - Latvia (%)
Place of birth for the foreign-born population - Lithuania (%)
Place of birth for the foreign-born population - North Macedonia (Macedonia) (%)
Place of birth for the foreign-born population - Moldova (%)
Place of birth for the foreign-born population - Poland (%)
Place of birth for the foreign-born population - Romania (%)
Place of birth for the foreign-born population - Russia (%)
Place of birth for the foreign-born population - Serbia (%)
Place of birth for the foreign-born population - Ukraine (%)
Place of birth for the foreign-born population - Other Eastern Europe (%)
Place of birth for the foreign-born population - China (%)
Place of birth for the foreign-born population - Hong Kong (%)
Place of birth for the foreign-born population - Taiwan (%)
Place of birth for the foreign-born population - Japan (%)
Place of birth for the foreign-born population - Korea (%)
Place of birth for the foreign-born population - Other Eastern Asia (%)
Place of birth for the foreign-born population - Afghanistan (%)
Place of birth for the foreign-born population - Bangladesh (%)
Place of birth for the foreign-born population - India (%)
Place of birth for the foreign-born population - Iran (%)
Place of birth for the foreign-born population - Kazakhstan (%)
Place of birth for the foreign-born population - Nepal (%)
Place of birth for the foreign-born population - Pakistan (%)
Place of birth for the foreign-born population - Sri Lanka (%)
Place of birth for the foreign-born population - Uzbekistan (%)
Place of birth for the foreign-born population - Other South Central Asia (%)
Place of birth for the foreign-born population - Burma (%)
Place of birth for the foreign-born population - Cambodia (%)
Place of birth for the foreign-born population - Indonesia (%)
Place of birth for the foreign-born population - Laos (%)
Place of birth for the foreign-born population - Malaysia (%)
Place of birth for the foreign-born population - Philippines (%)
Place of birth for the foreign-born population - Singapore (%)
Place of birth for the foreign-born population - Thailand (%)
Place of birth for the foreign-born population - Vietnam (%)
Place of birth for the foreign-born population - Other South Eastern Asia (%)
Place of birth for the foreign-born population - Armenia (%)
Place of birth for the foreign-born population - Iraq (%)
Place of birth for the foreign-born population - Israel (%)
Place of birth for the foreign-born population - Jordan (%)
Place of birth for the foreign-born population - Kuwait (%)
Place of birth for the foreign-born population - Lebanon (%)
Place of birth for the foreign-born population - Saudi Arabia (%)
Place of birth for the foreign-born population - Syria (%)
Place of birth for the foreign-born population - Turkey (%)
Place of birth for the foreign-born population - Yemen (%)
Place of birth for the foreign-born population - Other Western Asia (%)
Place of birth for the foreign-born population - Eritrea (%)
Place of birth for the foreign-born population - Ethiopia (%)
Place of birth for the foreign-born population - Kenya (%)
Place of birth for the foreign-born population - Somalia (%)
Place of birth for the foreign-born population - Uganda (%)
Place of birth for the foreign-born population - Zimbabwe (%)
Place of birth for the foreign-born population - Other Eastern Africa (%)
Place of birth for the foreign-born population - Cameroon (%)
Place of birth for the foreign-born population - Congo (%)
Place of birth for the foreign-born population - Democratic Republic of Congo (Zaire) (%)
Place of birth for the foreign-born population - Other Middle Africa (%)
Place of birth for the foreign-born population - Egypt (%)
Place of birth for the foreign-born population - Morocco (%)
Place of birth for the foreign-born population - Sudan (%)
Place of birth for the foreign-born population - Other Northern Africa (%)
Place of birth for the foreign-born population - South Africa (%)
Place of birth for the foreign-born population - Other Southern Africa (%)
Place of birth for the foreign-born population - Cabo Verde (%)
Place of birth for the foreign-born population - Ghana (%)
Place of birth for the foreign-born population - Liberia (%)
Place of birth for the foreign-born population - Nigeria (%)
Place of birth for the foreign-born population - Senegal (%)
Place of birth for the foreign-born population - Sierra Leone (%)
Place of birth for the foreign-born population - Other Western Africa (%)
Place of birth for the foreign-born population - Australia (%)
Place of birth for the foreign-born population - New Zealand (%)
Place of birth for the foreign-born population - Fiji (%)
Place of birth for the foreign-born population - Micronesia (%)
Place of birth for the foreign-born population - Bahamas (%)
Place of birth for the foreign-born population - Barbados (%)
Place of birth for the foreign-born population - Cuba (%)
Place of birth for the foreign-born population - Dominica (%)
Place of birth for the foreign-born population - Dominican Republic (%)
Place of birth for the foreign-born population - Grenada (%)
Place of birth for the foreign-born population - Haiti (%)
Place of birth for the foreign-born population - Jamaica (%)
Place of birth for the foreign-born population - St. Vincent and the Grenadines (%)
Place of birth for the foreign-born population - Trinidad and Tobago (%)
Place of birth for the foreign-born population - West Indies (%)
Place of birth for the foreign-born population - Other Caribbean (%)
Place of birth for the foreign-born population - Belize (%)
Place of birth for the foreign-born population - Costa Rica (%)
Place of birth for the foreign-born population - El Salvador (%)
Place of birth for the foreign-born population - Guatemala (%)
Place of birth for the foreign-born population - Honduras (%)
Place of birth for the foreign-born population - Mexico (%)
Place of birth for the foreign-born population - Nicaragua (%)
Place of birth for the foreign-born population - Panama (%)
Place of birth for the foreign-born population - Other Central America (%)
Place of birth for the foreign-born population - Argentina (%)
Place of birth for the foreign-born population - Bolivia (%)
Place of birth for the foreign-born population - Brazil (%)
Place of birth for the foreign-born population - Chile (%)
Place of birth for the foreign-born population - Colombia (%)
Place of birth for the foreign-born population - Ecuador (%)
Place of birth for the foreign-born population - Guyana (%)
Place of birth for the foreign-born population - Peru (%)
Place of birth for the foreign-born population - Uruguay (%)
Place of birth for the foreign-born population - Venezuela (%)
Place of birth for the foreign-born population - Other South America (%)
Place of birth for the foreign-born population - Canada (%)
Place of birth for the foreign-born population - Other Northern America (%)
Place of birth for the foreign-born population - Other (%)
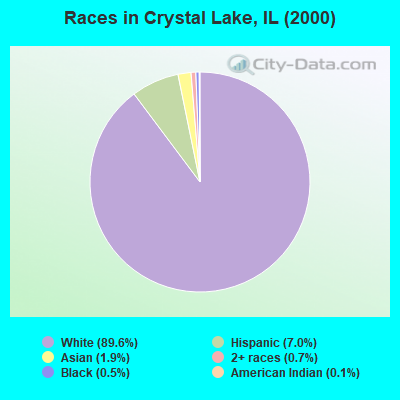
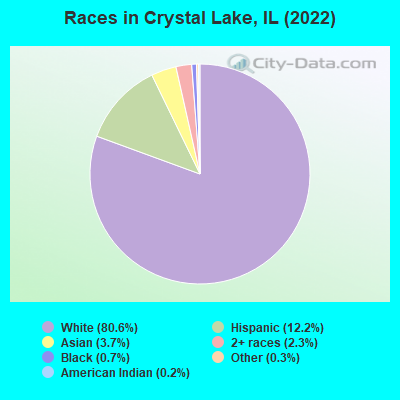
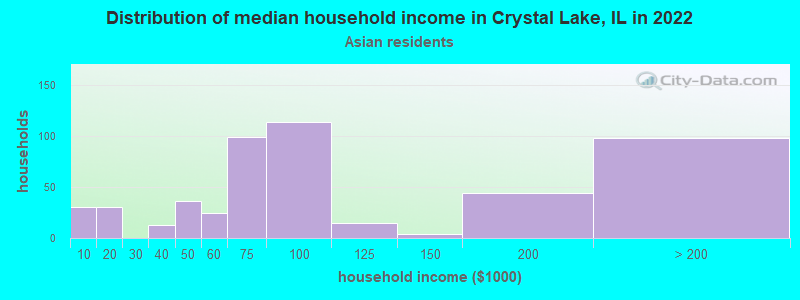
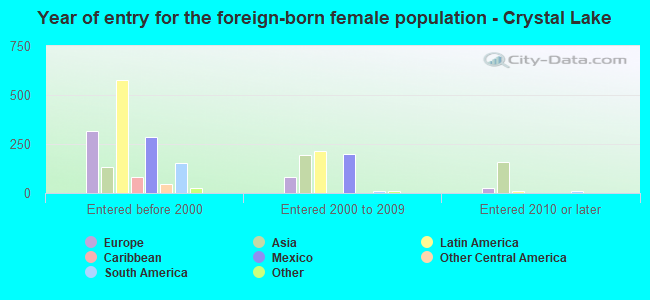
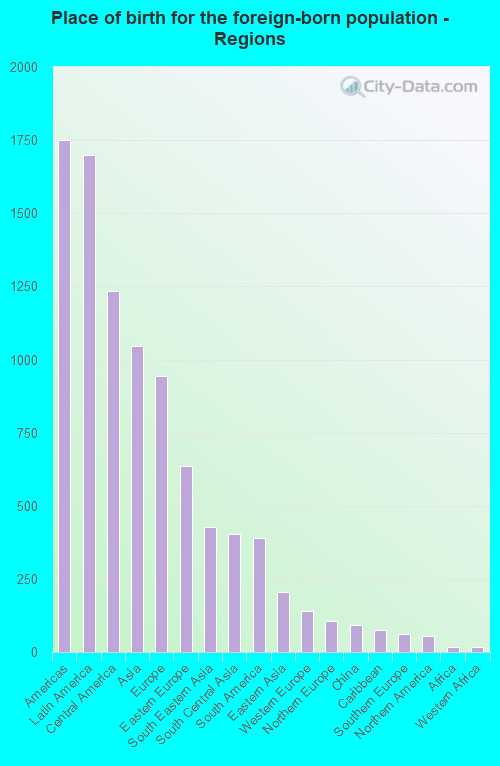
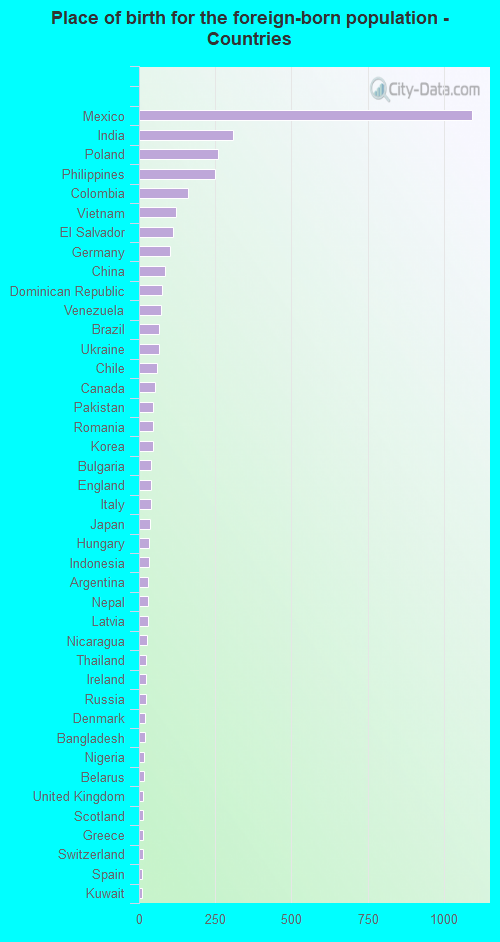
According to 2022 data, the most numerous races in Crystal Lake, IL are White alone (32,665 residents), Hispanic (4,964 residents), and Black alone (286 residents). 84.9% of Crystal Lake residents speak English at home. 9.3% of Crystal Lake, IL residents are foreign-born (4.2% born in Latin America, 2.6% born in Asia, 2.3% born in Europe), which is 50.9% less than the foreign-born rate of 14.0% across the entire state of Illinois.
Race distribution in Crystal Lake
2000 2022
8,424,140 67.8% White alone 1,856,152 14.9% Black alone 1,530,262 12.3% Hispanic 419,916 3.4% Asian alone 153,996 1.2% Two or more races 13,479 0.1% Other race alone 18,232 0.1% American Indian alone 3,116 0.03% Native Hawaiian and Other
7,356,301 58.5% White alone 2,299,726 18.3% Hispanic 1,660,423 13.2% Black alone 747,296 5.9% Asian alone 458,599 3.6% Two or more races 45,386 0.4% Other race alone 10,405 0.08% American Indian alone 3,896 0.03% Native Hawaiian and Other
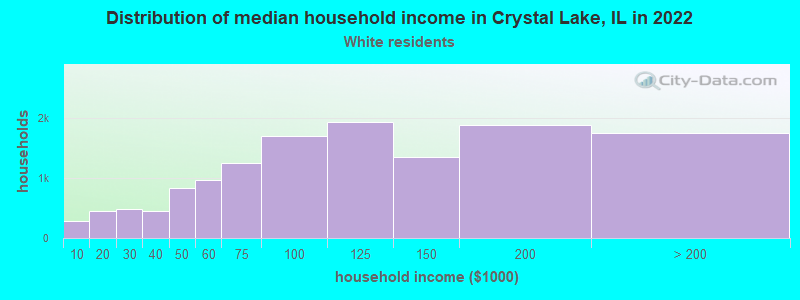
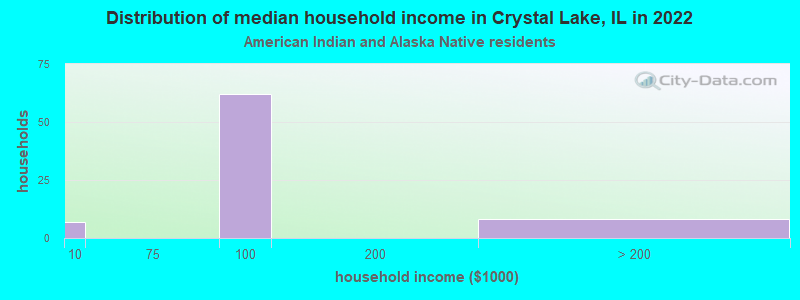
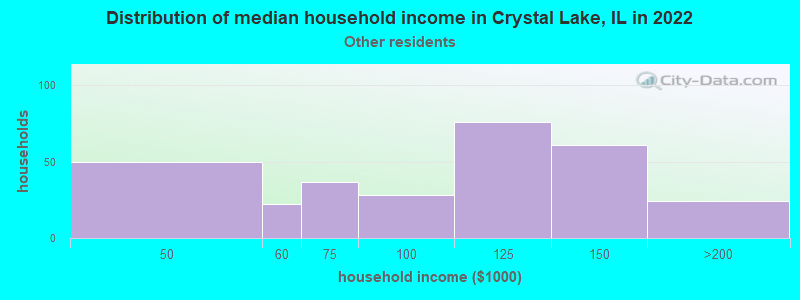
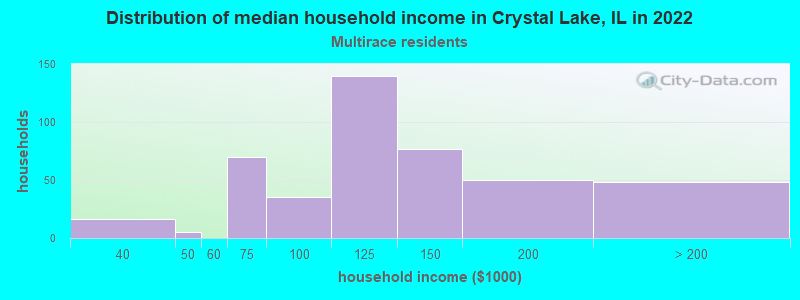
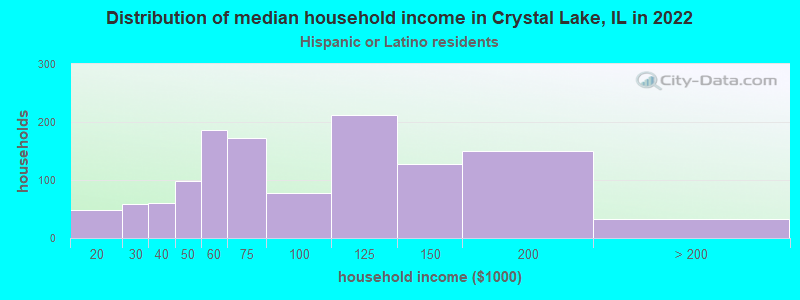
Income and house value in Crystal Lake Median household income in 2022 $102,999 White non-Hispanic householders$82,561 American Indian and Alaska Native householders$85,605 Asian householders$98,809 Some other race householders$119,120 Two or more races householders$76,136 Hispanic or Latino race householdersMedian 2022 house value $301,602 White Non-Hispanic householders$385,224 Black or African American householders$174,844 American Indian or Alaska Native householders $380,804 Asian householders$274,907 Some other race householders$275,791 Two or more races householders$273,316 Hispanic or Latino householders
Median age by race in Crystal Lake
42.9 Median age for White residents42.5 43.3 19.3 Median age for Black or African American residents3.6 30.4 49.4 Median age for American Indian / Alaska Native residents48.6 65.2 45.1 Median age for Asian residents49.4 43.0 -666,666,666.0 Median age for Native Hawaiian / Pacific Islander residents-666,666,666.0 -666,666,666.0 32.0 Median age for Other race residents38.4 25.8 22.7 Median age for Two or more races residents15.4 25.4 42.9 Median age for White alone residents42.3 43.3 27.8 Median age for Hispanic or Latino residents28.2 26.0
Owner/renter occupied households by race in Crystal Lake
House owners and renters - White residents 10,797 81.3% Owner occupied2,476 18.7% Renter occupiedHouse owners and renters - Black or African American residents 50 100.0% Renter occupiedHouse owners and renters - American Indian / Alaska Native residents 51 66.5% Owner occupied26 33.5% Renter occupiedHouse owners and renters - Asian residents 390 69.1% Owner occupied175 30.9% Renter occupiedHouse owners and renters - Other race residents 271 90.2% Owner occupied29 9.8% Renter occupiedHouse owners and renters - Two or more races residents 367 76.7% Owner occupied112 23.3% Renter occupiedHouse owners and renters - White alone residents 10,702 81.8% Owner occupied2,376 18.2% Renter occupiedHouse owners and renters - Hispanic or Latino residents 845 74.1% Owner occupied295 25.9% Renter occupied
Language usage in Crystal Lake
English speakers - Total 84.9% of residents of Crystal Lake speak English at home.
9.0% of residents speak Spanish at home 2,589 73.6% Speak English very well928 26.4% Speak English less than very well5.8% of residents speak other language at home 1,526 67.0% Speak English very well753 33.0% Speak English less than very well
English speakers - Born in the United States 96.5% of residents of Crystal Lake speak English at home.
2.9% of residents speak Spanish at home 127 69.4% Speak English very well56 30.6% Speak English less than very well0.4% of residents speak other language at home 13 50.0% Speak English very well13 50.0% Speak English less than very well
English speakers - Native, born elsewhere 81.1% of residents of Crystal Lake speak English at home.
6.6% of residents speak Spanish at home 16 100.0% Speak English less than very well
English speakers - Foreign-born 16.3% of residents of Crystal Lake speak English at home.
43.5% of residents speak Spanish at home 987 55.9% Speak English very well778 44.1% Speak English less than very well40.6% of residents speak other language at home 869 52.8% Speak English very well776 47.2% Speak English less than very well
White (Caucasian) - Speak only English Native:
96.9% (30,079)Foreign-born:
23.3% (356)
White (Caucasian) - Speak another language Native:
3.2% (1,000)Foreign-born:
76.4% (1,164)
American Indian / Alaska Native - Speak another language Native:
16.1% (22)Foreign-born:
100.0% (31)
Asian - Speak only English Native:
64.5% (245)Foreign-born:
24.1% (275)
Asian - Speak another language Native:
28.5% (108)Foreign-born:
75.7% (864)
Other race - Speak only English Native:
34.4% (206)Foreign-born:
2.0% (13)
Other race - Speak another language Native:
67.0% (402)Foreign-born:
90.1% (580)
Two or more races - Speak only English Native:
65.1% (1,342)Foreign-born:
6.2% (37)
Two or more races - Speak another language Native:
32.7% (674)Foreign-born:
90.3% (538)
White alone - Speak only English Native:
97.8% (29,586)Foreign-born:
29.4% (388)
White alone - Speak another language Native:
2.0% (620)Foreign-born:
67.6% (892)
Hispanic or Latino - Speak only English Native:
46.3% (1,446)Foreign-born:
3.5% (56)
Hispanic or Latino - Speak another language Native:
53.7% (1,677)Foreign-born:
97.5% (1,574)
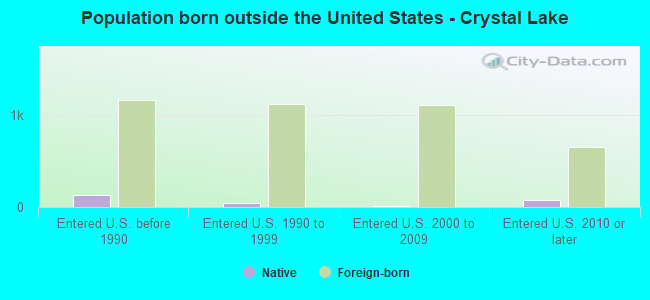
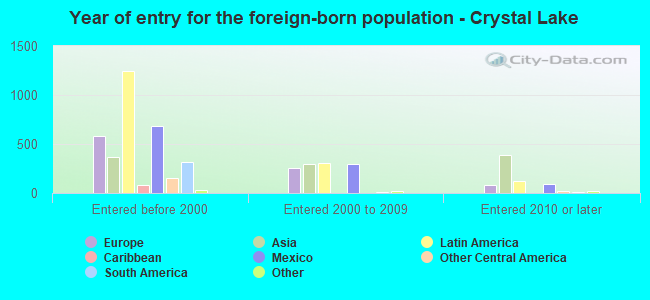
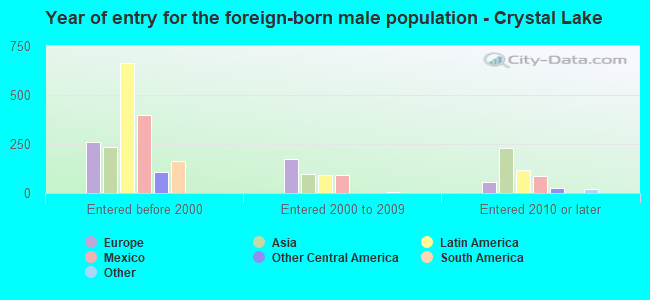
Foreign-born residents in Crystal Lake 3,761 residents are foreign born (4.2% Latin America , 2.6% Asia , 2.3% Europe ).
This city:
9.3%Illinois:
14.1%
Marital status for residents in Crystal Lake Marital status - White (Caucasian) population 15 years and over
Males 29.9% Never married59.6% Now married0.7% Separated2.5% Widowed7.3% DivorcedFemales 24.4% Never married55.4% Now married0.9% Separated8.4% Widowed10.9% DivorcedWomen who gave birth in the past 12 months Now married:
100.0% (202)Unmarried:
0.0% (0)
Women who did not give birth in the past 12 months Now married:
51.0% (3,609)Unmarried:
49.0% (3,471)
Marital status - Black or African American population 15 years and over
Males 63.6% Never married36.4% Now married0.0% Separated0.0% Widowed0.0% DivorcedFemales 87.5% Never married9.8% Now married0.0% Separated2.7% Widowed0.0% DivorcedWomen who did not give birth in the past 12 months Now married:
3.0% (3)Unmarried:
97.0% (92)
Marital status - American Indian / Alaska Native population 15 years and over
Males 14.6% Never married65.9% Now married0.0% Separated0.0% Widowed19.5% DivorcedFemales 0.0% Never married88.1% Now married0.0% Separated0.0% Widowed11.9% DivorcedWomen who did not give birth in the past 12 months Now married:
83.9% (43)Unmarried:
16.1% (8)
Marital status - Asian population 15 years and over
Males 29.9% Never married53.6% Now married0.0% Separated2.2% Widowed14.3% DivorcedFemales 14.3% Never married77.9% Now married0.0% Separated0.9% Widowed7.0% DivorcedWomen who did not give birth in the past 12 months Now married:
76.9% (283)Unmarried:
23.1% (85)
Marital status - Other race population 15 years and over
Males 30.8% Never married60.6% Now married0.0% Separated8.6% Widowed0.0% DivorcedFemales 31.3% Never married49.1% Now married0.0% Separated0.0% Widowed19.6% DivorcedWomen who did not give birth in the past 12 months Now married:
38.8% (164)Unmarried:
61.2% (258)
Marital status - Two or more races population 15 years and over
Males 34.4% Never married63.9% Now married0.0% Separated1.7% Widowed0.0% DivorcedFemales 47.8% Never married44.3% Now married2.7% Separated2.4% Widowed2.8% DivorcedWomen who gave birth in the past 12 months Now married:
100.0% (45)Unmarried:
0.0% (0)
Women who did not give birth in the past 12 months Now married:
40.4% (360)Unmarried:
59.6% (530)
Marital status - White alone, not Hispanic / Latino population 15 years and over
Males 29.8% Never married60.3% Now married0.2% Separated2.5% Widowed7.2% DivorcedFemales 23.4% Never married55.5% Now married1.0% Separated8.7% Widowed11.4% DivorcedWomen who gave birth in the past 12 months Now married:
100.0% (216)Unmarried:
0.0% (0)
Women who did not give birth in the past 12 months Now married:
51.1% (3,529)Unmarried:
48.9% (3,382)
Marital status - Hispanic or Latino population 15 years and over
Males 31.6% Never married54.8% Now married4.6% Separated3.2% Widowed5.7% DivorcedFemales 35.5% Never married54.4% Now married0.0% Separated2.5% Widowed7.6% DivorcedWomen who gave birth in the past 12 months Now married:
100.0% (29)Unmarried:
0.0% (0)
Women who did not give birth in the past 12 months Now married:
47.6% (691)Unmarried:
52.4% (762)
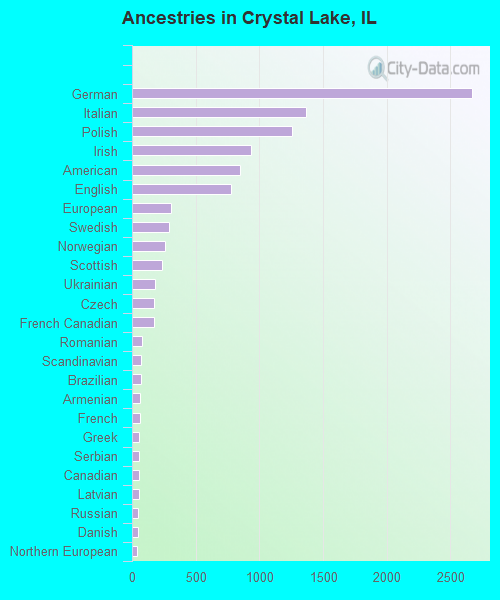
Ancestries in Crystal Lake
2,669 18.3% German1,364 9.4% Italian1,254 8.6% Polish938 6.4% Irish850 5.8% American775 5.3% English305 2.1% European289 2.0% Swedish261 1.8% Norwegian236 1.6% Scottish182 1.2% Ukrainian173 1.2% Czech170 1.2% French Canadian79 0.5% Romanian72 0.5% Scandinavian68 0.5% Brazilian60 0.4% Armenian59 0.4% French56 0.4% Greek55 0.4% Serbian54 0.4% Canadian54 0.4% Latvian49 0.3% Russian47 0.3% Danish42 0.3% Northern European41 0.3% Bulgarian40 0.3% Hungarian40 0.3% Welsh39 0.3% Swiss39 0.3% Eastern European39 0.3% Croatian30 0.2% Dutch28 0.2% Belgian25 0.2% Austrian24 0.2% Lithuanian23 0.2% Estonian21 0.1% Scotch-Irish19 0.1% Nigerian19 0.1% Yugoslavian17 0.1% Slovene15 0.1% Slavic14 0.10% British13 0.09% Czechoslovakian11 0.08% Lebanese8 0.05% Finnish6 0.04% Arab3 0.02% Slovak
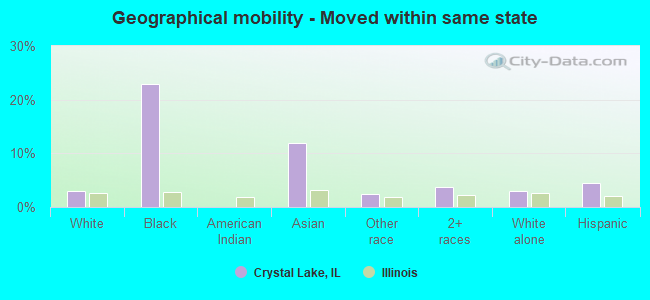
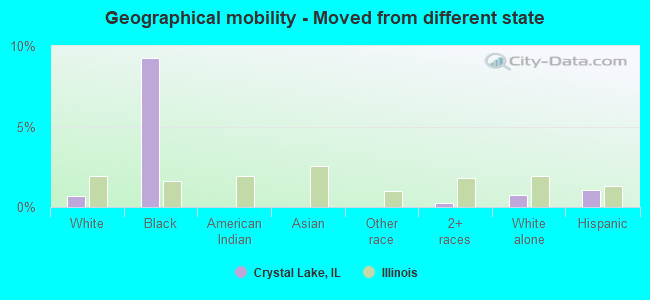
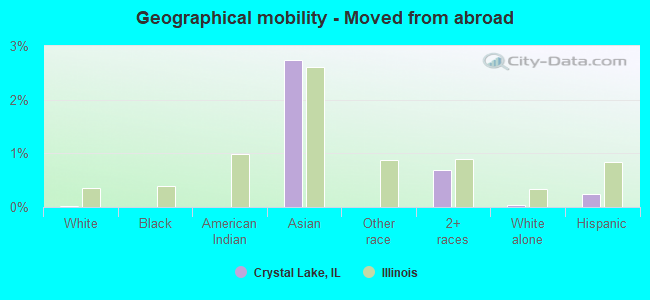
Geographical mobility in Crystal Lake Same house 1 year ago 31,296 93.7% White (Caucasian)168 59.7% Black or African American166 99.7% American Indian / Alaska Native1,274 85.9% Asian1,009 94.6% Other race2,722 90.3% Two or more races30,303 93.4% White alone, not Hispanic / Latino4,659 93.1% Hispanic or LatinoMoved within same county 989 3.0% White / Caucasian76 26.9% Black or African American14 1.0% Asian35 3.3% Other race129 4.3% Two or more races1,004 3.1% White alone, not Hispanic / Latino118 2.4% Hispanic or LatinoMoved within same state 980 2.9% White / Caucasian64 22.9% Black or African American177 11.9% Asian26 2.5% Other race111 3.7% Two or more races973 3.0% White alone, not Hispanic / Latino222 4.4% Hispanic or LatinoMoved from different state 238 0.7% White / Caucasian26 9.2% Black or African American8 0.3% Two or more races233 0.7% White alone, not Hispanic / Latino52 1.0% Hispanic or LatinoMoved from abroad 8 0.0% White41 2.7% Asian21 0.7% Two or more races14 0.0% White alone, not Hispanic / Latino12 0.2% Hispanic or Latino
Children Nativity (place of birth) in Crystal Lake
Children under 6 years - Living with two parents Both parents native 1,565 100.0% NativeBoth parents foreign-born 235 100.0% NativeOne native, one foreign-born parent 156 100.0% NativeChildren under 6 years - Living with one parent Native parent 211 100.0% NativeForeign-born parent 67 100.0% NativeChildren 6 to 17 years - Living with two parents Both parents native 4,076 100.0% NativeBoth parents foreign-born 856 100.0% NativeOne native, one foreign-born parent 331 100.0% NativeChildren 6 to 17 years - Living with one parent Native parent 1,453 100.0% NativeForeign-born parent 86 49.1% Native89 50.9% Foreign-born
Grandparents responsible for own grandchildren in Crystal Lake
Grandparents (30 to 59 years) White / Caucasian 4 5.5% Responsible for grandchildren71 94.5% Not responsible for grandchildrenAsian 11 100.0% Not responsible for grandchildrenTwo or more races 8 100.0% Not responsible for grandchildrenWhite alone, not Hispanic / Latino 4 4.4% Responsible for grandchildren85 95.6% Not responsible for grandchildrenGrandparents (60 years and over) White / Caucasian 80 46.4% Responsible for grandchildren92 53.6% Not responsible for grandchildrenAsian 12 100.0% Not responsible for grandchildrenTwo or more races 13 100.0% Not responsible for grandchildrenWhite alone, not Hispanic / Latino 92 51.0% Responsible for grandchildren89 49.0% Not responsible for grandchildren