Races in Cullowhee, North Carolina (NC) Detailed Stats
Ancestries, Foreign-born residents, place of birth
Settings
X


Recent posts about races in Cullowhee, North Carolina on our local forum with over 2,400,000 registered users:
 | Retiring in NC but I can't decide where. So many great towns to choose from! (364 replies) |
| Looking for a Second home (3 replies) |
| NC state taxes (47 replies) |
| Asheville versus Greenville (39 replies) |
| Mark Meadows (11 replies) |
| Would love some help choosing where to buy vacation homeowners (13 replies) |
Latest news about races in Cullowhee, NC collected exclusively by city-data.com from local newspapers, TV, and radio stations
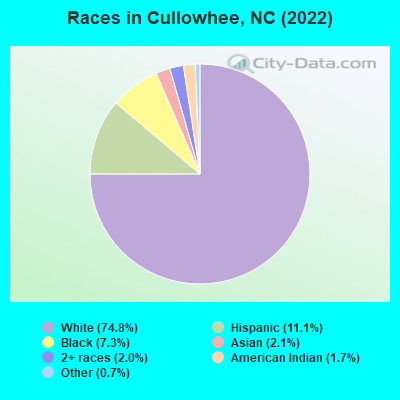
According to 2022 data, the most numerous races in Cullowhee, NC are White alone (5,130 residents), Black alone (502 residents), and Hispanic (759 residents). 90.5% of Cullowhee residents speak English at home. 6.7% of Cullowhee, NC residents are foreign-born (4.8% born in Latin America, 1.2% born in Asia), which is 19.6% less than the foreign-born rate of 8.0% across the entire state of North Carolina.
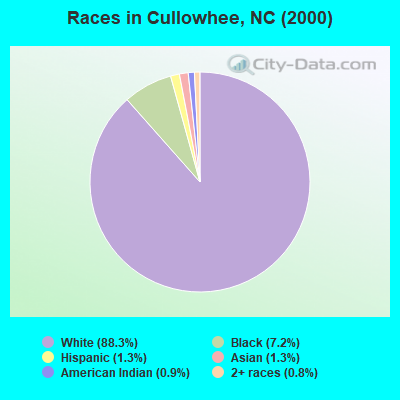
Race distribution in Cullowhee
2000
2022

- 3,16088.3%White alone
- 2597.2%Black alone
- 471.3%Hispanic
- 461.3%Asian alone
- 320.9%American Indian alone
- 300.8%Two or more races
- 30.08%Native Hawaiian and Other
Pacific Islander alone - 20.06%Other race alone
-
- 5,13074.8%White alone
- 75911.1%Hispanic
- 5027.3%Black alone
- 1452.1%Asian alone
- 1342.0%Two or more races
- 1151.7%American Indian alone
- 500.7%Other race alone
2000
2022
-
- 5,647,15570.2%White alone
- 1,723,30121.4%Black alone
- 378,9634.7%Hispanic
- 112,4161.4%Asian alone
- 95,3331.2%American Indian alone
- 79,9651.0%Two or more races
- 9,0150.1%Other race alone
- 3,1650.04%Native Hawaiian and Other
Pacific Islander alone

-
- 6,497,51960.7%White alone
- 2,155,65020.1%Black alone
- 1,114,79910.4%Hispanic
- 438,0614.1%Two or more races
- 341,0523.2%Asian alone
- 91,7580.9%American Indian alone
- 50,1800.5%Other race alone
- 9,9540.09%Native Hawaiian and Other
Pacific Islander alone

Income and house value in Cullowhee
- Median household income in 2022
- $33,334White non-Hispanic householders
- Median 2022 house value
- $-817,410,808White Non-Hispanic householders
- $-2,147,483,648Black or African American householders
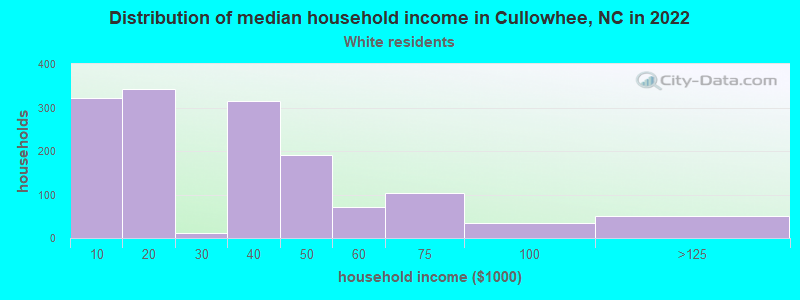
Household income for White non-Hispanic householders
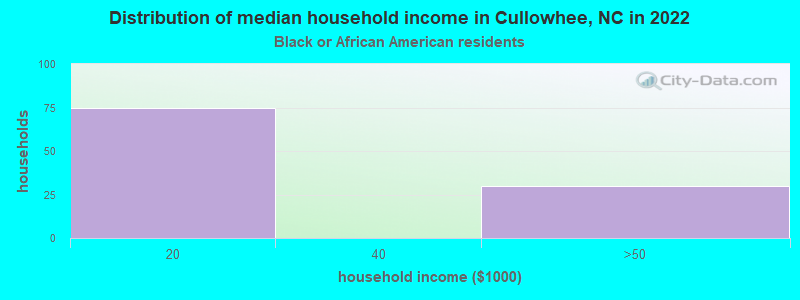
Household income for Black householders
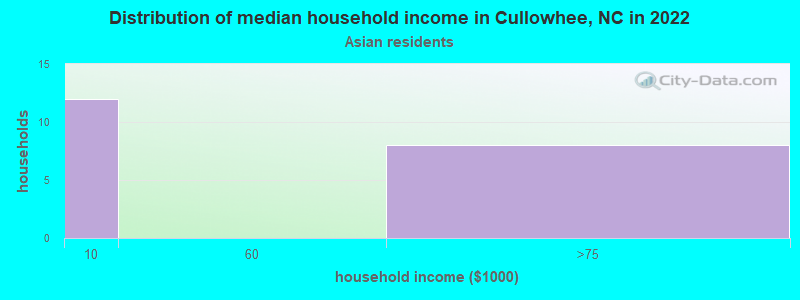
Household income for Asian householders
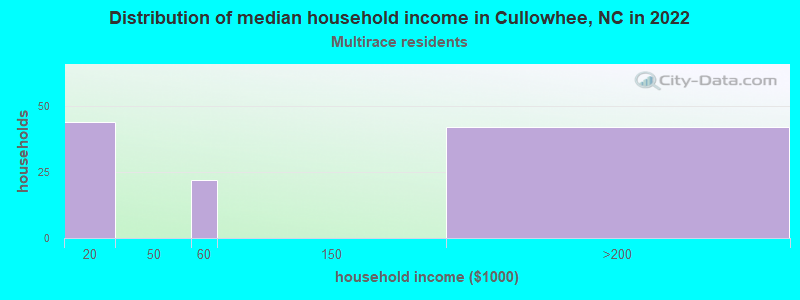
Household income for Two or more races householders
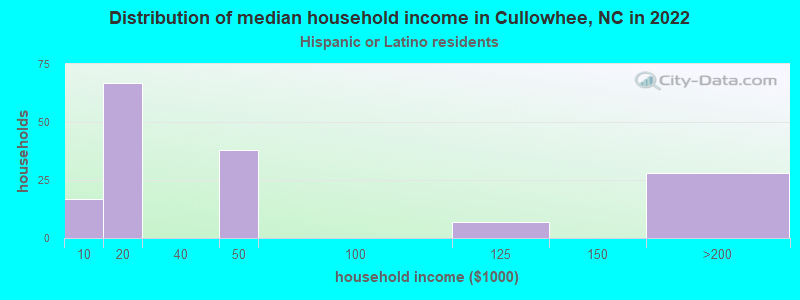
Household income for Hispanic or Latino race householders
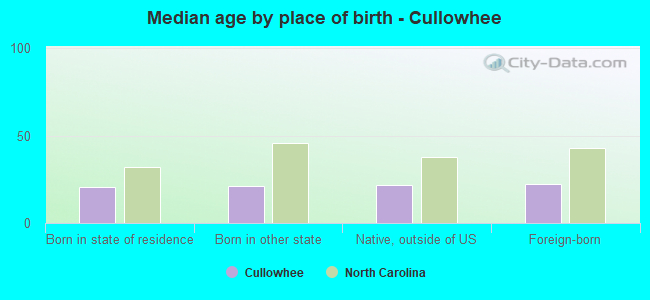
Median age by race in Cullowhee
- 21.0Median age for White residents
- 21.3Males
- 20.9Females
- 21.3Median age for Black or African American residents
- 21.8Males
- 21.1Females
- 19.8Median age for American Indian / Alaska Native residents
- -668,604,650.5Males
- 20.1Females
- 21.2Median age for Asian residents
- -682,080,924.2Males
- 21.2Females
- -609,884,331.7Median age for Native Hawaiian / Pacific Islander residents
- -611,708,482.1Males
- -612,403,100.2Females
- 19.3Median age for Other race residents
- 19.4Males
- 19.2Females
- 21.7Median age for Two or more races residents
- 19.7Males
- 25.3Females
- 20.8Median age for White alone residents
- 21.1Males
- 20.6Females
- 20.8Median age for Hispanic or Latino residents
- 19.1Males
- 21.6Females
Owner/renter occupied households by race in Cullowhee
- House owners and renters - White residents
- 15811.3%Owner occupied
- 1,23888.7%Renter occupied
- House owners and renters - Black or African American residents
- 108100.0%Renter occupied
- House owners and renters - American Indian / Alaska Native residents
- 26100.0%Renter occupied
- House owners and renters - Asian residents
- 18100.0%Renter occupied
- House owners and renters - Other race residents
- 26100.0%Renter occupied
- House owners and renters - Two or more races residents
- 99100.0%Renter occupied
- House owners and renters - White alone residents
- 15510.9%Owner occupied
- 1,26589.1%Renter occupied
- House owners and renters - Hispanic or Latino residents
- 63.8%Owner occupied
- 14396.2%Renter occupied
Language usage in Cullowhee
- English speakers - Total
- 90.5% of residents of Cullowhee speak English at home.
- 7.6% of residents speak Spanish at home
- 24947.6%Speak English very well
- 27452.4%Speak English less than very well
- 1.6% of residents speak other language at home
- 5752.8%Speak English very well
- 5147.2%Speak English less than very well
- English speakers - Born in the United States
- 97.3% of residents of Cullowhee speak English at home.
- 0.9% of residents speak Spanish at home
- 22100.0%Speak English very well
- 1.8% of residents speak other language at home
- 3579.5%Speak English very well
- 920.5%Speak English less than very well
- English speakers - Native, born elsewhere
- 98.3% of residents of Cullowhee speak English at home.
- English speakers - Foreign-born
- 18.1% of residents of Cullowhee speak English at home.
- 66.0% of residents speak Spanish at home
- 4213.9%Speak English very well
- 26186.1%Speak English less than very well
- 13.7% of residents speak other language at home
- 2031.7%Speak English very well
- 4368.3%Speak English less than very well
White (Caucasian) - Speak only English
| Native: | 97.5% (5,093) |
| Foreign-born: | 49.7% (50) |
White (Caucasian) - Speak another language
| Native: | 2.4% (128) |
| Foreign-born: | 54.3% (55) |
Asian - Speak only English
| Native: | 88.0% (126) |
| Foreign-born: | 49.1% (10) |
Asian - Speak another language
| Native: | 11.6% (17) |
| Foreign-born: | 50.2% (11) |
Other race - Speak only English
| Native: | 29.0% (11) |
| Foreign-born: | 28.3% (22) |
Other race - Speak another language
| Native: | 70.9% (26) |
| Foreign-born: | 69.3% (53) |
Two or more races - Speak another language
| Native: | 2.6% (6) |
| Foreign-born: | 100.0% (314) |
White alone - Speak only English
| Native: | 99.6% (5,026) |
| Foreign-born: | 24.2% (15) |
White alone - Speak another language
| Native: | 0.4% (18) |
| Foreign-born: | 75.8% (47) |
Hispanic or Latino - Speak only English
| Native: | 54.7% (238) |
| Foreign-born: | 17.3% (57) |
Hispanic or Latino - Speak another language
| Native: | 46.3% (202) |
| Foreign-born: | 83.0% (273) |
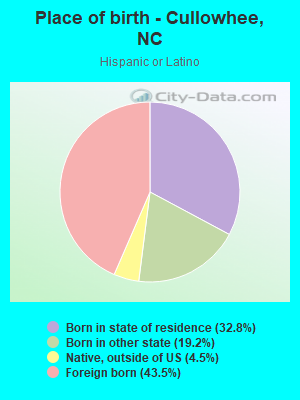
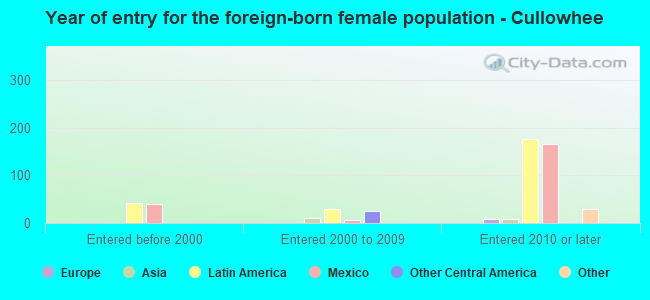
Foreign-born residents in Cullowhee
459 residents are foreign born (4.8% Latin America, 1.2% Asia).
| This city: | 6.7% |
| North Carolina: | 8.3% |
Marital status for residents in Cullowhee
Marital status - White (Caucasian) population 15 years and over
- Males
- 91.6%Never married
- 5.2%Now married
- 0.0%Separated
- 0.0%Widowed
- 3.2%Divorced
- Females
- 90.7%Never married
- 7.1%Now married
- 0.0%Separated
- 0.5%Widowed
- 1.8%Divorced
Women who did not give birth in the past 12 months
| Now married: | 5.5% (134) |
| Unmarried: | 94.5% (2,308) |
Marital status - Black or African American population 15 years and over
- Males
- 100.0%Never married
- 0.0%Now married
- 0.0%Separated
- 0.0%Widowed
- 0.0%Divorced
- Females
- 100.0%Never married
- 0.0%Now married
- 0.0%Separated
- 0.0%Widowed
- 0.0%Divorced
Women who did not give birth in the past 12 months
| Now married: | 0.0% (0) |
| Unmarried: | 100.0% (299) |
Marital status - American Indian / Alaska Native population 15 years and over
- Males
- 16.7%Never married
- 0.0%Now married
- 0.0%Separated
- 0.0%Widowed
- 83.3%Divorced
- Females
- 100.0%Never married
- 0.0%Now married
- 0.0%Separated
- 0.0%Widowed
- 0.0%Divorced
Women who did not give birth in the past 12 months
| Now married: | 0.0% (0) |
| Unmarried: | 100.0% (90) |
Marital status - Asian population 15 years and over
- Males
- 100.0%Never married
- 0.0%Now married
- 0.0%Separated
- 0.0%Widowed
- 0.0%Divorced
- Females
- 93.0%Never married
- 7.0%Now married
- 0.0%Separated
- 0.0%Widowed
- 0.0%Divorced
Women who did not give birth in the past 12 months
| Now married: | 0.0% (0) |
| Unmarried: | 100.0% (138) |
Marital status - Other race population 15 years and over
- Males
- 72.5%Never married
- 27.5%Now married
- 0.0%Separated
- 0.0%Widowed
- 0.0%Divorced
- Females
- 100.0%Never married
- 0.0%Now married
- 0.0%Separated
- 0.0%Widowed
- 0.0%Divorced
Women who did not give birth in the past 12 months
| Now married: | 0.0% (0) |
| Unmarried: | 100.0% (27) |
Marital status - Two or more races population 15 years and over
- Males
- 85.3%Never married
- 14.7%Now married
- 0.0%Separated
- 0.0%Widowed
- 0.0%Divorced
- Females
- 54.7%Never married
- 27.3%Now married
- 0.0%Separated
- 0.0%Widowed
- 18.0%Divorced
Women who did not give birth in the past 12 months
| Now married: | 0.0% (0) |
| Unmarried: | 100.0% (160) |
Marital status - White alone, not Hispanic / Latino population 15 years and over
- Males
- 91.8%Never married
- 4.8%Now married
- 0.0%Separated
- 0.0%Widowed
- 3.4%Divorced
- Females
- 91.2%Never married
- 6.4%Now married
- 0.0%Separated
- 0.5%Widowed
- 1.9%Divorced
Women who did not give birth in the past 12 months
| Now married: | 4.7% (115) |
| Unmarried: | 95.3% (2,311) |
Marital status - Hispanic or Latino population 15 years and over
- Males
- 76.8%Never married
- 23.2%Now married
- 0.0%Separated
- 0.0%Widowed
- 0.0%Divorced
- Females
- 65.4%Never married
- 24.3%Now married
- 0.0%Separated
- 0.0%Widowed
- 10.4%Divorced
Women who did not give birth in the past 12 months
| Now married: | 10.2% (26) |
| Unmarried: | 89.8% (229) |
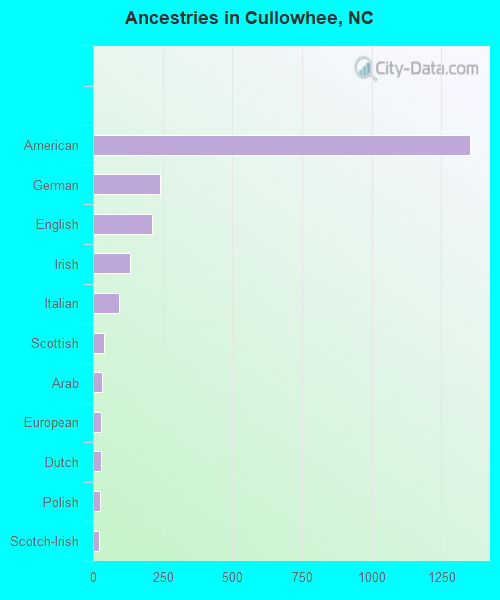
Ancestries in Cullowhee

- 1,35340.9%American
- 2427.3%German
- 2126.4%English
- 1334.0%Irish
- 922.8%Italian
- 401.2%Scottish
- 310.9%Arab
- 290.9%European
- 280.8%Dutch
- 240.7%Polish
- 230.7%Scotch-Irish
- 110.3%African
- 40.1%Welsh
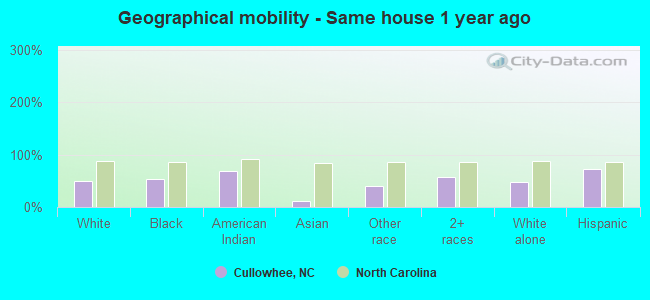
Geographical mobility in Cullowhee

- Same house 1 year ago
- 2,60449.0%White (Caucasian)
- 29153.5%Black or African American
- 8569.0%American Indian / Alaska Native
- 1912.2%Asian
- 4640.6%Other race
- 30957.4%Two or more races
- 2,41547.1%White alone, not Hispanic / Latino
- 54872.2%Hispanic or Latino
-
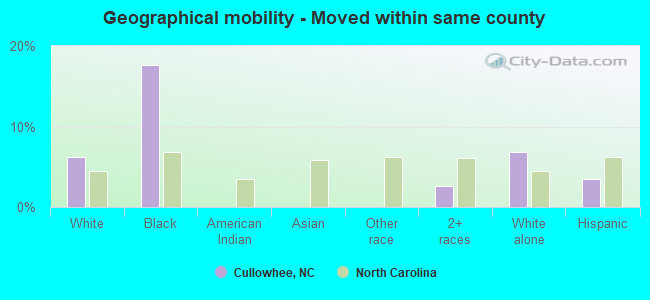
- Moved within same county
- 3326.2%White / Caucasian
- 9617.6%Black or African American
- 142.6%Two or more races
- 3496.8%White alone, not Hispanic / Latino
- 263.5%Hispanic or Latino
-
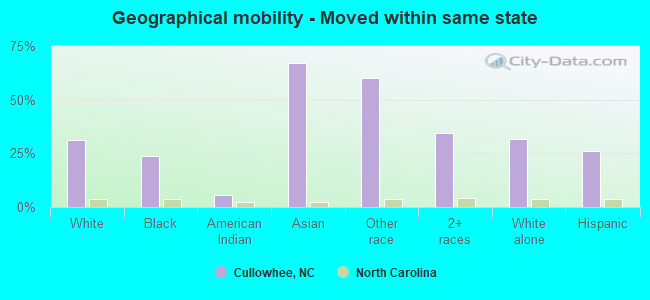
- Moved within same state
- 1,64531.0%White / Caucasian
- 13023.9%Black or African American
- 75.6%American Indian / Alaska Native
- 10766.9%Asian
- 6960.0%Other race
- 18534.5%Two or more races
- 1,61431.5%White alone, not Hispanic / Latino
- 20026.3%Hispanic or Latino
-
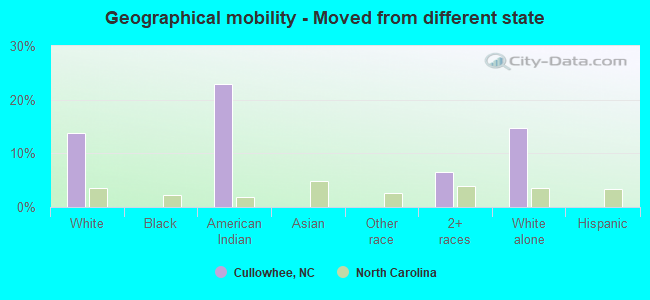
- Moved from different state
- 73013.7%White / Caucasian
- 2823.0%American Indian / Alaska Native
- 356.5%Two or more races
- 75614.7%White alone, not Hispanic / Latino
-
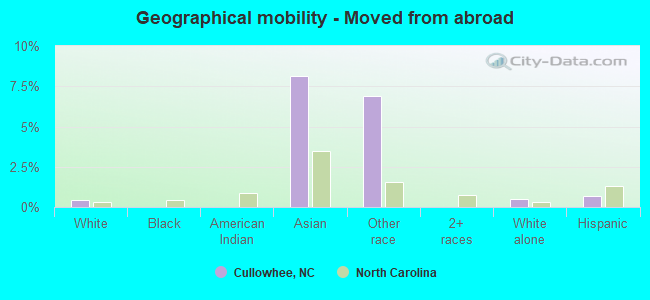
- Moved from abroad
- 220.4%White
- 138.1%Asian
- 86.9%Other race
- 240.5%White alone, not Hispanic / Latino
- 50.7%Hispanic or Latino
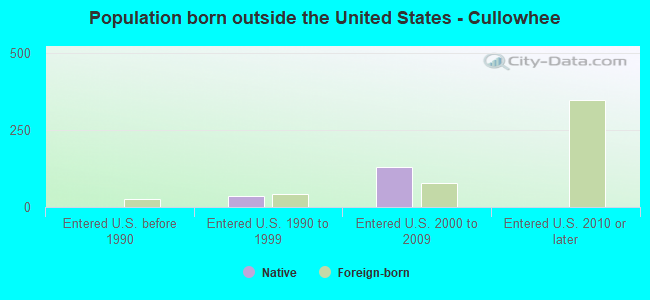
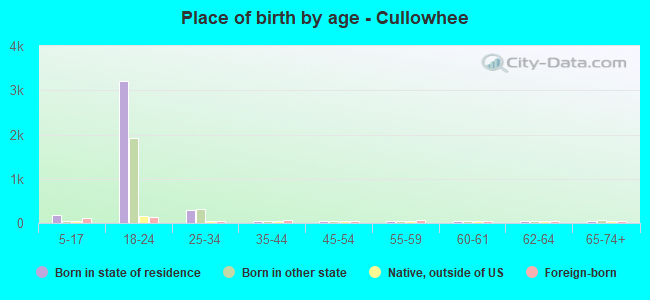
Children Nativity (place of birth) in Cullowhee
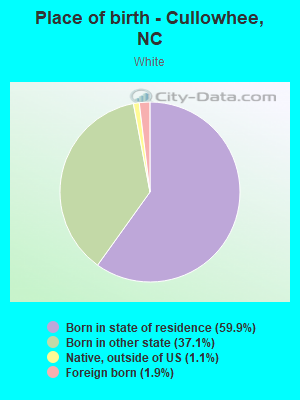
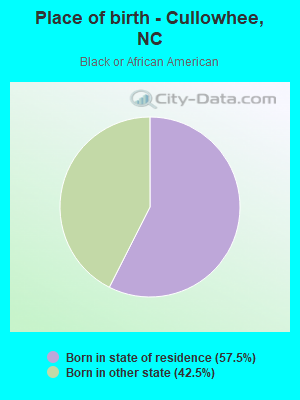
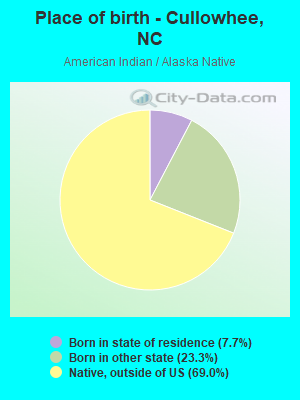
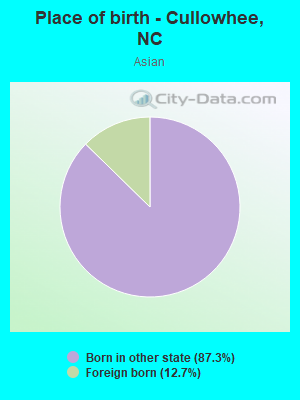
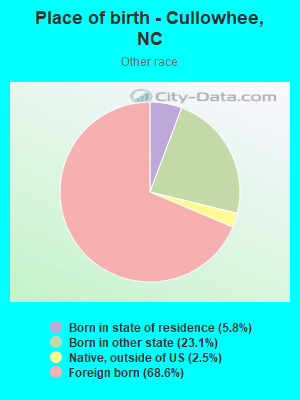
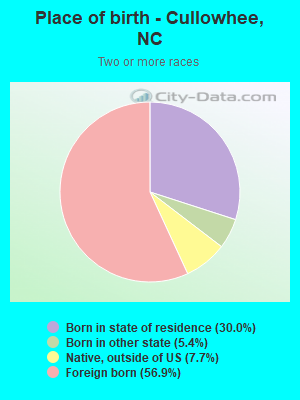
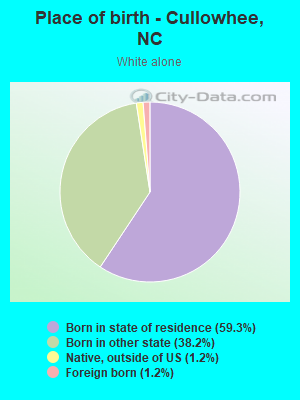
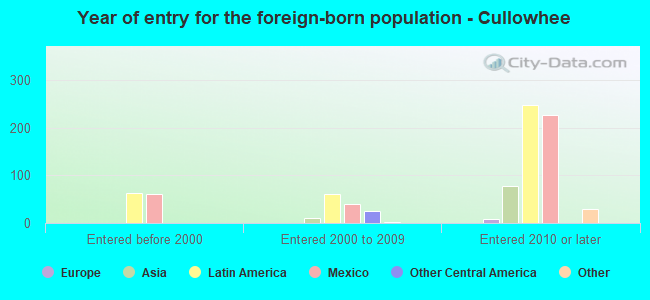
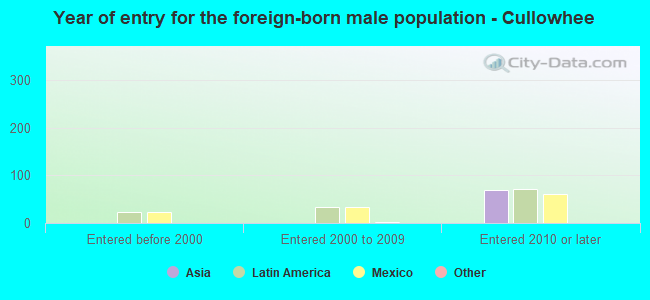
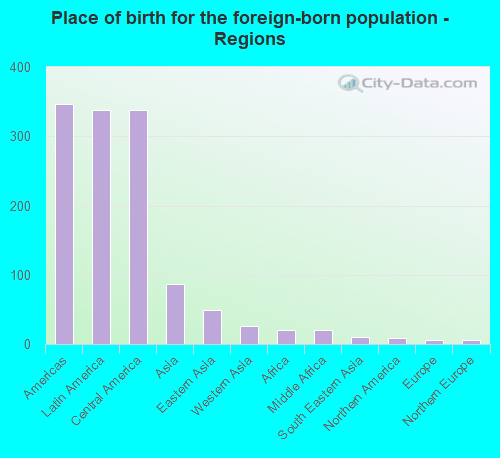
Place of birth for residents in Cullowhee
![Place of birth for the foreign-born population - Regions]()
- 346Americas
- 338Latin America
- 338Central America
- 86Asia
- 49Eastern Asia
- 26Western Asia
- 20Africa
- 20Middle Africa
- 10South Eastern Asia
- 8Northern America
- 6Europe
- 6Northern Europe
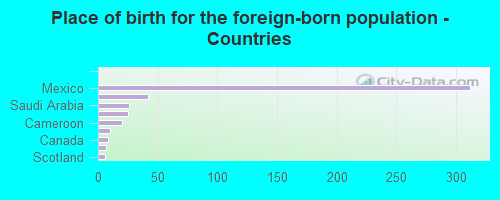
![Place of birth for the foreign-born population - Countries]()
- 312Mexico
- 42Japan
- 26Saudi Arabia
- 25Honduras
- 20Cameroon
- 10Philippines
- 8Canada
- 7Korea
- 6Scotland