Races in Cumberland, Rhode Island (RI) Detailed Stats
Ancestries, Foreign-born residents, place of birth

Recent posts about races in Cumberland, Rhode Island on our local forum with over 2,400,000 registered users:
 | Buying a house in RI vs CT? (177 replies) |
| Elementary school with more Asians? (21 replies) |
| House buyers flooding in from MA & NYC (90 replies) |
| Top Democrats Flock to One of Whitest and Most Affluent RI Communities (138 replies) |
| Another shooting/stabbing. (2066 replies) |
| Tommy's Pizza in Providence closes (70 replies) |
Latest news about races in Cumberland, RI collected exclusively by city-data.com from local newspapers, TV, and radio stations
9.3% of Cumberland, RI residents are foreign-born (5.9% born in Europe, 1.3% born in Latin America, 1.2% born in Asia), which is 50.4% less than the foreign-born rate of 14.0% across the entire state of Rhode Island.
Race distribution in Cumberland

- 30,40095.5%White alone
- 6672.1%Hispanic
- 2640.8%Asian alone
- 2300.7%Two or more races
- 1610.5%Black alone
- 880.3%Other race alone
- 220.07%American Indian alone
- 80.03%Native Hawaiian and Other
Pacific Islander alone

2000
2022
-
- 858,43381.9%White alone
- 90,8208.7%Hispanic
- 41,9224.0%Black alone
- 23,4162.2%Asian alone
- 20,8162.0%Two or more races
- 8,4110.8%Other race alone
- 4,1810.4%American Indian alone
- 3200.03%Native Hawaiian and Other
Pacific Islander alone

-
- 745,82568.2%White alone
- 191,97917.6%Hispanic
- 56,7385.2%Two or more races
- 51,3264.7%Black alone
- 37,2343.4%Asian alone
- 9,5140.9%Other race alone
- 9780.09%American Indian alone
- 1400.01%Native Hawaiian and Other
Pacific Islander alone

Income and house value in Cumberland
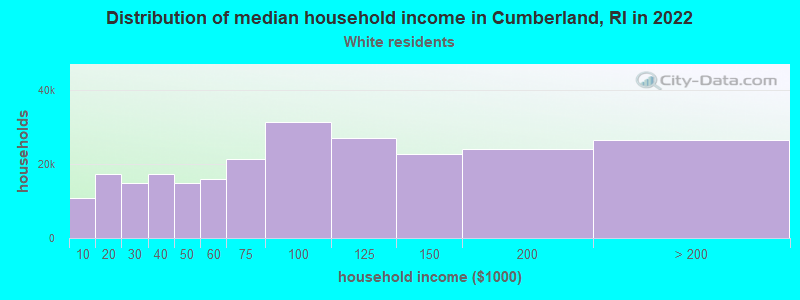
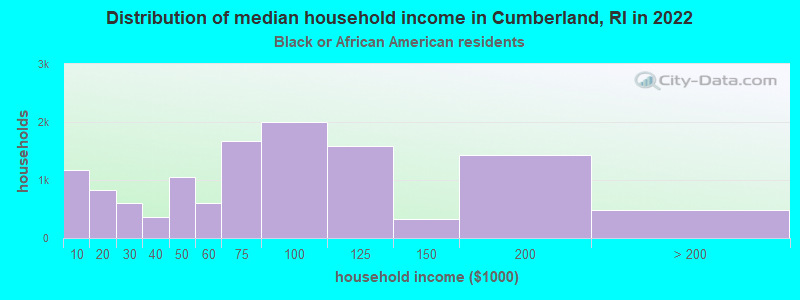
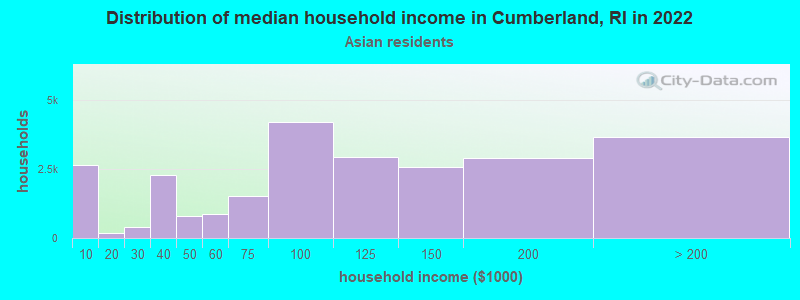
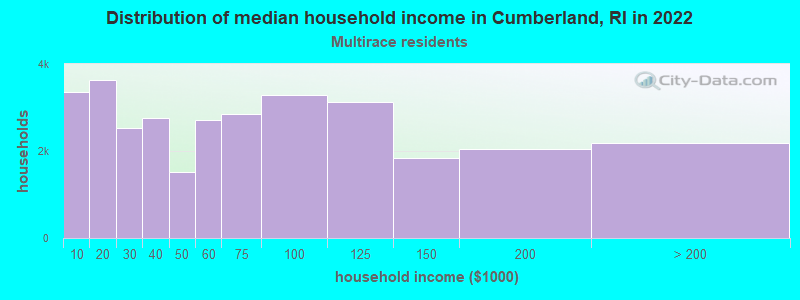
- Median household income in 2022
- $109,016White non-Hispanic householders
- $52,553Black householders
- over $200,000Asian householders
- $121,060Some other race householders
- $57,660Two or more races householders
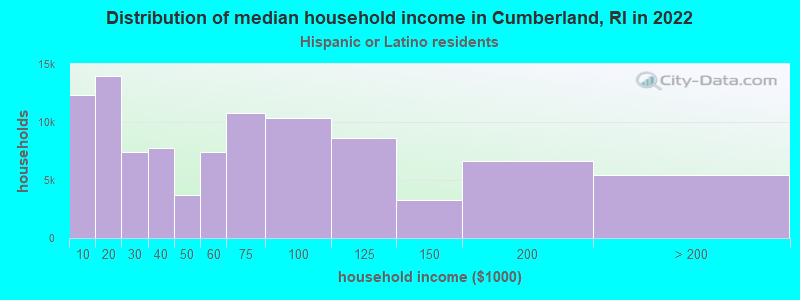
- $102,414Hispanic or Latino race householders
- Median 2022 house value
- $427,935White Non-Hispanic householders
- $399,288Black or African American householders
- $535,436Asian householders
- $430,593Some other race householders
- $393,677Two or more races householders
- $332,248Hispanic or Latino householders
Household income for White non-Hispanic householders
Household income for Black householders
Household income for Asian householders
Household income for Two or more races householders
Household income for Hispanic or Latino race householders
Foreign-born residents in Cumberland
2,964 residents are foreign born (5.9% Europe, 1.3% Latin America, 1.2% Asia).
| This city: | 9.3% |
| Rhode Island: | 11.4% |
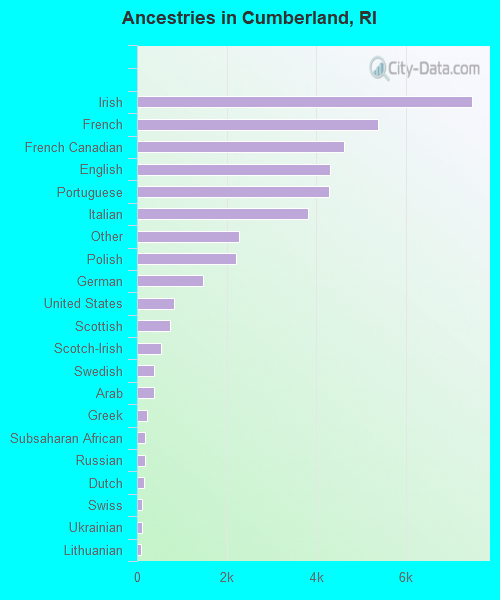
Ancestries in Cumberland

- 7,48118.7%Irish
- 5,37813.5%French
- 4,61211.5%French Canadian
- 4,30710.8%English
- 4,27910.7%Portuguese
- 3,8169.5%Italian
- 2,2785.7%Other
- 2,2155.5%Polish
- 1,4643.7%German
- 8312.1%United States
- 7391.8%Scottish
- 5401.4%Scotch-Irish
- 3750.9%Swedish
- 3740.9%Arab
- 2270.6%Greek
- 1840.5%Subsaharan African
- 1810.5%Russian
- 1630.4%Dutch
- 1190.3%Swiss
- 1160.3%Ukrainian
- 890.2%Lithuanian
- 520.1%Norwegian
- 450.1%Slovak
- 380.10%Welsh
- 290.07%Danish
- 240.06%Hungarian
- 230.06%Czech
Zip codes: 02864.