Races in Cusseta, Georgia (GA) Detailed Stats
Ancestries, Foreign-born residents, place of birth

Recent posts about races in Cusseta, Georgia on our local forum with over 2,400,000 registered users:
 | 2nd VA Clinic coming downtown! (3 replies) |
| Metro Road Construction Update (18 replies) |
| New I-185 interchange coming to south Columbus. (3 replies) |
| Need info about closest gates to Sand Hill area at Benning (12 replies) |
Latest news about races in Cusseta, GA collected exclusively by city-data.com from local newspapers, TV, and radio stations
2.3% of Cusseta, GA residents are foreign-born (1.8% born in Europe, 0.3% born in Asia, 0.3% born in Latin America), which is 327.1% less than the foreign-born rate of 10.0% across the entire state of Georgia.
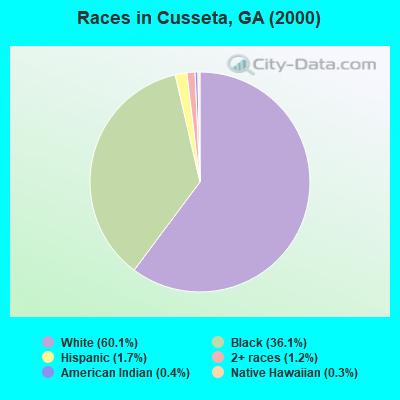
Race distribution in Cusseta

- 71960.1%White alone
- 43236.1%Black alone
- 201.7%Hispanic
- 141.2%Two or more races
- 50.4%American Indian alone
- 40.3%Native Hawaiian and Other
Pacific Islander alone - 10.08%Asian alone
- 10.08%Other race alone
2000
2022
-
- 5,128,66162.6%White alone
- 2,331,46528.5%Black alone
- 435,2275.3%Hispanic
- 171,5132.1%Asian alone
- 87,3641.1%Two or more races
- 17,6700.2%American Indian alone
- 11,2750.1%Other race alone
- 3,2780.04%Native Hawaiian and Other
Pacific Islander alone

-
- 5,415,65749.6%White alone
- 3,349,24030.7%Black alone
- 1,132,60410.4%Hispanic
- 479,1564.4%Asian alone
- 462,9234.2%Two or more races
- 54,4160.5%Other race alone
- 11,9230.1%American Indian alone
- 6,9570.06%Native Hawaiian and Other
Pacific Islander alone

Income and house value in Cusseta
- Median household income in 2022
- $53,339White non-Hispanic householders
- $36,166Black householders
- $59,512Two or more races householders
- $22,778Hispanic or Latino race householders
- Median 2022 house value
- $152,191White Non-Hispanic householders
- $120,915Black or African American householders
- $62,831Two or more races householders
- $153,587Hispanic or Latino householders
Household income for White non-Hispanic householders

Household income for Black householders

Household income for Two or more races householders

Household income for Hispanic or Latino race householders

Foreign-born residents in Cusseta
28 residents are foreign born (1.8% Europe, 0.3% Asia, 0.3% Latin America).
| This city: | 2.3% |
| Georgia: | 7.1% |
Ancestries in Cusseta

- 56951.6%Other
- 19918.1%United States
- 1059.5%Irish
- 1019.2%German
- 252.3%English
- 222.0%French
- 211.9%Polish
- 121.1%Italian
- 111.0%Scotch-Irish
- 100.9%Scottish
- 70.6%Dutch
- 70.6%Welsh
- 50.5%Russian
- 20.2%Czech
- 20.2%Danish
- 20.2%Norwegian
- 20.2%Subsaharan African

Zip codes: 31805.