Races in Dacula, Georgia (GA) Detailed Stats
Data:
Races - White alone (%)
Races - White alone (% change since 2000)
Races - Black alone (%)
Races - Black alone (% change since 2000)
Races - American Indian alone (%)
Races - American Indian alone (% change since 2000)
Races - Asian alone (%)
Races - Asian alone (% change since 2000)
Races - Hispanic (%)
Races - Hispanic (% change since 2000)
Races - Native Hawaiian and Other Pacific Islander alone (%)
Races - Native Hawaiian and Other Pacific Islander alone (% change since 2000)
Races - Two or more races(%)
Races - Two or more races(% change since 2000)
Races - Other race alone (%)
Races - Other race alone (% change since 2000)
Racial diversity
Place of birth - Born in state of residence (%)
Place of birth - Born in state of residence (%) - White
Place of birth - Born in state of residence (%) - Black or African American
Place of birth - Born in state of residence (%) - Asian
Place of birth - Born in state of residence (%) - Hispanic or Latino
Place of birth - Born in state of residence (%) - American Indian and Alaska Native
Place of birth - Born in state of residence (%) - Multirace
Place of birth - Born in state of residence (%) - Other Race
Place of birth - Born in other state (%)
Place of birth - Born in other state (%) - White
Place of birth - Born in other state (%) - Black or African American
Place of birth - Born in other state (%) - Asian
Place of birth - Born in other state (%) - Hispanic or Latino
Place of birth - Born in other state (%) - American Indian and Alaska Native
Place of birth - Born in other state (%) - Multirace
Place of birth - Born in other state (%) - Other Race
Place of birth - Native, outside of US (%)
Place of birth - Native, outside of US (%) - White
Place of birth - Native, outside of US (%) - Black or African American
Place of birth - Native, outside of US (%) - Asian
Place of birth - Native, outside of US (%) - Hispanic or Latino
Place of birth - Native, outside of US (%) - American Indian and Alaska Native
Place of birth - Native, outside of US (%) - Multirace
Place of birth - Native, outside of US (%) - Other Race
Place of birth - Foreign born (%)
Place of birth - Foreign born (%) - White
Place of birth - Foreign born (%) - Black or African American
Place of birth - Foreign born (%) - Asian
Place of birth - Foreign born (%) - Hispanic or Latino
Place of birth - Foreign born (%) - American Indian and Alaska Native
Place of birth - Foreign born (%) - Multirace
Place of birth - Foreign born (%) - Other Race
Residents speaking English at home (%)
Residents speaking English at home - Born in the United States (%)
Residents speaking English at home - Native, born elsewhere (%)
Residents speaking English at home - Foreign born (%)
Residents speaking Spanish at home (%)
Residents speaking Spanish at home - Born in the United States (%)
Residents speaking Spanish at home - Native, born elsewhere (%)
Residents speaking Spanish at home - Foreign born (%)
Residents speaking other language at home (%)
Residents speaking other language at home - Born in the United States (%)
Residents speaking other language at home - Native, born elsewhere (%)
Residents speaking other language at home - Foreign born (%)
Marital status - Never married (%)
Marital status - Now married (%)
Marital status - Separated (%)
Marital status - Widowed (%)
Marital status - Divorced (%)
Ancestries Reported - Arab (%)
Ancestries Reported - Czech (%)
Ancestries Reported - Danish (%)
Ancestries Reported - Dutch (%)
Ancestries Reported - English (%)
Ancestries Reported - French (%)
Ancestries Reported - French Canadian (%)
Ancestries Reported - German (%)
Ancestries Reported - Greek (%)
Ancestries Reported - Hungarian (%)
Ancestries Reported - Irish (%)
Ancestries Reported - Italian (%)
Ancestries Reported - Lithuanian (%)
Ancestries Reported - Norwegian (%)
Ancestries Reported - Polish (%)
Ancestries Reported - Portuguese (%)
Ancestries Reported - Russian (%)
Ancestries Reported - Scotch-Irish (%)
Ancestries Reported - Scottish (%)
Ancestries Reported - Slovak (%)
Ancestries Reported - Subsaharan African (%)
Ancestries Reported - Swedish (%)
Ancestries Reported - Swiss (%)
Ancestries Reported - Ukrainian (%)
Ancestries Reported - United States (%)
Ancestries Reported - Welsh (%)
Ancestries Reported - West Indian (%)
Ancestries Reported - Other (%)
Geographical mobility - Same house 1 year ago (%)
Geographical mobility - Same house 1 year ago (%) - White
Geographical mobility - Same house 1 year ago (%) - Black or African American
Geographical mobility - Same house 1 year ago (%) - Asian
Geographical mobility - Same house 1 year ago (%) - Hispanic or Latino
Geographical mobility - Same house 1 year ago (%) - American Indian and Alaska Native
Geographical mobility - Same house 1 year ago (%) - Multirace
Geographical mobility - Same house 1 year ago (%) - Other Race
Geographical mobility - Moved within same county (%)
Geographical mobility - Moved within same county (%) - White
Geographical mobility - Moved within same county (%) - Black or African American
Geographical mobility - Moved within same county (%) - Asian
Geographical mobility - Moved within same county (%) - Hispanic or Latino
Geographical mobility - Moved within same county (%) - American Indian and Alaska Native
Geographical mobility - Moved within same county (%) - Multirace
Geographical mobility - Moved within same county (%) - Other Race
Geographical mobility - Moved from different county within same state (%)
Geographical mobility - Moved from different county within same state (%) - White
Geographical mobility - Moved from different county within same state (%) - Black or African American
Geographical mobility - Moved from different county within same state (%) - Asian
Geographical mobility - Moved from different county within same state (%) - Hispanic or Latino
Geographical mobility - Moved from different county within same state (%) - American Indian and Alaska Native
Geographical mobility - Moved from different county within same state (%) - Multirace
Geographical mobility - Moved from different county within same state (%) - Other Race
Geographical mobility - Moved from different state (%)
Geographical mobility - Moved from different state (%) - White
Geographical mobility - Moved from different state (%) - Black or African American
Geographical mobility - Moved from different state (%) - Asian
Geographical mobility - Moved from different state (%) - Hispanic or Latino
Geographical mobility - Moved from different state (%) - American Indian and Alaska Native
Geographical mobility - Moved from different state (%) - Multirace
Geographical mobility - Moved from different state (%) - Other Race
Geographical mobility - Moved from abroad (%)
Geographical mobility - Moved from abroad (%) - White
Geographical mobility - Moved from abroad (%) - Black or African American
Geographical mobility - Moved from abroad (%) - Asian
Geographical mobility - Moved from abroad (%) - Hispanic or Latino
Geographical mobility - Moved from abroad (%) - American Indian and Alaska Native
Geographical mobility - Moved from abroad (%) - Multirace
Geographical mobility - Moved from abroad (%) - Other Race
Place of birth for the foreign-born population - Ireland (%)
Place of birth for the foreign-born population - Denmark (%)
Place of birth for the foreign-born population - Norway (%)
Place of birth for the foreign-born population - Sweden (%)
Place of birth for the foreign-born population - United Kingdom (%)
Place of birth for the foreign-born population - England (%)
Place of birth for the foreign-born population - Scotland (%)
Place of birth for the foreign-born population - Other Northern Europe (%)
Place of birth for the foreign-born population - Austria (%)
Place of birth for the foreign-born population - Belgium (%)
Place of birth for the foreign-born population - France (%)
Place of birth for the foreign-born population - Germany (%)
Place of birth for the foreign-born population - Netherlands (%)
Place of birth for the foreign-born population - Switzerland (%)
Place of birth for the foreign-born population - Other Western Europe (%)
Place of birth for the foreign-born population - Greece (%)
Place of birth for the foreign-born population - Italy (%)
Place of birth for the foreign-born population - Portugal (%)
Place of birth for the foreign-born population - Spain (%)
Place of birth for the foreign-born population - Other Southern Europe (%)
Place of birth for the foreign-born population - Albania (%)
Place of birth for the foreign-born population - Belarus (%)
Place of birth for the foreign-born population - Bosnia and Herzegovina (%)
Place of birth for the foreign-born population - Bulgaria (%)
Place of birth for the foreign-born population - Croatia (%)
Place of birth for the foreign-born population - Czechoslovakia (%)
Place of birth for the foreign-born population - Hungary (%)
Place of birth for the foreign-born population - Latvia (%)
Place of birth for the foreign-born population - Lithuania (%)
Place of birth for the foreign-born population - North Macedonia (Macedonia) (%)
Place of birth for the foreign-born population - Moldova (%)
Place of birth for the foreign-born population - Poland (%)
Place of birth for the foreign-born population - Romania (%)
Place of birth for the foreign-born population - Russia (%)
Place of birth for the foreign-born population - Serbia (%)
Place of birth for the foreign-born population - Ukraine (%)
Place of birth for the foreign-born population - Other Eastern Europe (%)
Place of birth for the foreign-born population - China (%)
Place of birth for the foreign-born population - Hong Kong (%)
Place of birth for the foreign-born population - Taiwan (%)
Place of birth for the foreign-born population - Japan (%)
Place of birth for the foreign-born population - Korea (%)
Place of birth for the foreign-born population - Other Eastern Asia (%)
Place of birth for the foreign-born population - Afghanistan (%)
Place of birth for the foreign-born population - Bangladesh (%)
Place of birth for the foreign-born population - India (%)
Place of birth for the foreign-born population - Iran (%)
Place of birth for the foreign-born population - Kazakhstan (%)
Place of birth for the foreign-born population - Nepal (%)
Place of birth for the foreign-born population - Pakistan (%)
Place of birth for the foreign-born population - Sri Lanka (%)
Place of birth for the foreign-born population - Uzbekistan (%)
Place of birth for the foreign-born population - Other South Central Asia (%)
Place of birth for the foreign-born population - Burma (%)
Place of birth for the foreign-born population - Cambodia (%)
Place of birth for the foreign-born population - Indonesia (%)
Place of birth for the foreign-born population - Laos (%)
Place of birth for the foreign-born population - Malaysia (%)
Place of birth for the foreign-born population - Philippines (%)
Place of birth for the foreign-born population - Singapore (%)
Place of birth for the foreign-born population - Thailand (%)
Place of birth for the foreign-born population - Vietnam (%)
Place of birth for the foreign-born population - Other South Eastern Asia (%)
Place of birth for the foreign-born population - Armenia (%)
Place of birth for the foreign-born population - Iraq (%)
Place of birth for the foreign-born population - Israel (%)
Place of birth for the foreign-born population - Jordan (%)
Place of birth for the foreign-born population - Kuwait (%)
Place of birth for the foreign-born population - Lebanon (%)
Place of birth for the foreign-born population - Saudi Arabia (%)
Place of birth for the foreign-born population - Syria (%)
Place of birth for the foreign-born population - Turkey (%)
Place of birth for the foreign-born population - Yemen (%)
Place of birth for the foreign-born population - Other Western Asia (%)
Place of birth for the foreign-born population - Eritrea (%)
Place of birth for the foreign-born population - Ethiopia (%)
Place of birth for the foreign-born population - Kenya (%)
Place of birth for the foreign-born population - Somalia (%)
Place of birth for the foreign-born population - Uganda (%)
Place of birth for the foreign-born population - Zimbabwe (%)
Place of birth for the foreign-born population - Other Eastern Africa (%)
Place of birth for the foreign-born population - Cameroon (%)
Place of birth for the foreign-born population - Congo (%)
Place of birth for the foreign-born population - Democratic Republic of Congo (Zaire) (%)
Place of birth for the foreign-born population - Other Middle Africa (%)
Place of birth for the foreign-born population - Egypt (%)
Place of birth for the foreign-born population - Morocco (%)
Place of birth for the foreign-born population - Sudan (%)
Place of birth for the foreign-born population - Other Northern Africa (%)
Place of birth for the foreign-born population - South Africa (%)
Place of birth for the foreign-born population - Other Southern Africa (%)
Place of birth for the foreign-born population - Cabo Verde (%)
Place of birth for the foreign-born population - Ghana (%)
Place of birth for the foreign-born population - Liberia (%)
Place of birth for the foreign-born population - Nigeria (%)
Place of birth for the foreign-born population - Senegal (%)
Place of birth for the foreign-born population - Sierra Leone (%)
Place of birth for the foreign-born population - Other Western Africa (%)
Place of birth for the foreign-born population - Australia (%)
Place of birth for the foreign-born population - New Zealand (%)
Place of birth for the foreign-born population - Fiji (%)
Place of birth for the foreign-born population - Micronesia (%)
Place of birth for the foreign-born population - Bahamas (%)
Place of birth for the foreign-born population - Barbados (%)
Place of birth for the foreign-born population - Cuba (%)
Place of birth for the foreign-born population - Dominica (%)
Place of birth for the foreign-born population - Dominican Republic (%)
Place of birth for the foreign-born population - Grenada (%)
Place of birth for the foreign-born population - Haiti (%)
Place of birth for the foreign-born population - Jamaica (%)
Place of birth for the foreign-born population - St. Vincent and the Grenadines (%)
Place of birth for the foreign-born population - Trinidad and Tobago (%)
Place of birth for the foreign-born population - West Indies (%)
Place of birth for the foreign-born population - Other Caribbean (%)
Place of birth for the foreign-born population - Belize (%)
Place of birth for the foreign-born population - Costa Rica (%)
Place of birth for the foreign-born population - El Salvador (%)
Place of birth for the foreign-born population - Guatemala (%)
Place of birth for the foreign-born population - Honduras (%)
Place of birth for the foreign-born population - Mexico (%)
Place of birth for the foreign-born population - Nicaragua (%)
Place of birth for the foreign-born population - Panama (%)
Place of birth for the foreign-born population - Other Central America (%)
Place of birth for the foreign-born population - Argentina (%)
Place of birth for the foreign-born population - Bolivia (%)
Place of birth for the foreign-born population - Brazil (%)
Place of birth for the foreign-born population - Chile (%)
Place of birth for the foreign-born population - Colombia (%)
Place of birth for the foreign-born population - Ecuador (%)
Place of birth for the foreign-born population - Guyana (%)
Place of birth for the foreign-born population - Peru (%)
Place of birth for the foreign-born population - Uruguay (%)
Place of birth for the foreign-born population - Venezuela (%)
Place of birth for the foreign-born population - Other South America (%)
Place of birth for the foreign-born population - Canada (%)
Place of birth for the foreign-born population - Other Northern America (%)
Place of birth for the foreign-born population - Other (%)
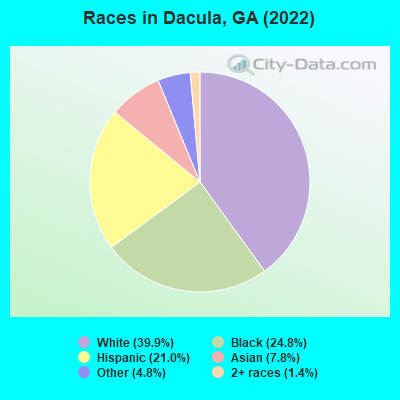
According to 2022 data, the most numerous races in Dacula, GA are White alone (2,806 residents), Black alone (1,741 residents), and Hispanic (1,473 residents). 67.1% of Dacula residents speak English at home. 22.0% of Dacula, GA residents are foreign-born (10.7% born in Latin America, 6.5% born in Asia, 4.3% born in Europe), which is 54.6% greater than the foreign-born rate of 10.0% across the entire state of Georgia.
Race distribution in Dacula
2000 2022
5,128,661 62.6% White alone 2,331,465 28.5% Black alone 435,227 5.3% Hispanic 171,513 2.1% Asian alone 87,364 1.1% Two or more races 17,670 0.2% American Indian alone 11,275 0.1% Other race alone 3,278 0.04% Native Hawaiian and Other
5,415,657 49.6% White alone 3,349,240 30.7% Black alone 1,132,604 10.4% Hispanic 479,156 4.4% Asian alone 462,923 4.2% Two or more races 54,416 0.5% Other race alone 11,923 0.1% American Indian alone 6,957 0.06% Native Hawaiian and Other
Income and house value in Dacula Median household income in 2022 $75,725 White non-Hispanic householders$55,961 Asian householders$98,909 Some other race householders$75,567 Two or more races householders$105,480 Hispanic or Latino race householdersMedian 2022 house value $374,860 White Non-Hispanic householders$401,824 Black or African American householders$452,134 American Indian or Alaska Native householders $411,031 Asian householders$369,928 Some other race householders$369,928 Two or more races householders$349,541 Hispanic or Latino householders
Median age by race in Dacula
42.0 Median age for White residents36.6 48.0 14.7 Median age for Black or African American residents10.7 33.2 -626,666,666.0 Median age for American Indian / Alaska Native residents-574,468,084.5 -732,307,691.6 41.5 Median age for Asian residents19.8 41.6 -1,080,291,969.7 Median age for Native Hawaiian / Pacific Islander residents-1,248,062,014.3 -776,776,776.0 19.9 Median age for Other race residents35.6 20.6 29.8 Median age for Two or more races residents21.0 44.0 41.7 Median age for White alone residents40.2 47.0 25.5 Median age for Hispanic or Latino residents18.6 44.5
Owner/renter occupied households by race in Dacula
House owners and renters - White residents 1,036 84.0% Owner occupied197 16.0% Renter occupiedHouse owners and renters - Black or African American residents 348 95.6% Owner occupied16 4.4% Renter occupiedHouse owners and renters - Asian residents 147 100.0% Owner occupiedHouse owners and renters - Other race residents 192 100.0% Owner occupiedHouse owners and renters - Two or more races residents 201 61.3% Owner occupied127 38.7% Renter occupiedHouse owners and renters - White alone residents 1,085 83.3% Owner occupied217 16.7% Renter occupiedHouse owners and renters - Hispanic or Latino residents 278 74.7% Owner occupied94 25.3% Renter occupied
Language usage in Dacula
English speakers - Total 67.1% of residents of Dacula speak English at home.
17.1% of residents speak Spanish at home 512 45.7% Speak English very well608 54.3% Speak English less than very well15.7% of residents speak other language at home 413 40.1% Speak English very well616 59.9% Speak English less than very well
English speakers - Born in the United States 94.2% of residents of Dacula speak English at home.
3.8% of residents speak Spanish at home 20 27.8% Speak English very well52 72.2% Speak English less than very well2.2% of residents speak other language at home 41 100.0% Speak English very well
English speakers - Native, born elsewhere 13.1% of residents of Dacula speak English at home.
84.3% of residents speak Spanish at home 114 50.7% Speak English very well111 49.3% Speak English less than very well
English speakers - Foreign-born 14.8% of residents of Dacula speak English at home.
23.3% of residents speak Spanish at home 140 38.5% Speak English very well224 61.5% Speak English less than very well62.6% of residents speak other language at home 376 38.4% Speak English very well603 61.6% Speak English less than very well
White (Caucasian) - Speak only English Native:
95.8% (2,251)Foreign-born:
38.6% (73)
White (Caucasian) - Speak another language Native:
5.0% (116)Foreign-born:
66.6% (126)
Black or African American - Speak only English Native:
99.6% (1,337)Foreign-born:
1.7% (4)
Black or African American - Speak another language Native:
0.7% (10)Foreign-born:
90.9% (237)
Other race - Speak another language Native:
53.8% (388)Foreign-born:
99.6% (275)
Two or more races - Speak only English Native:
30.1% (156)Foreign-born:
49.0% (136)
Two or more races - Speak another language Native:
64.7% (334)Foreign-born:
39.7% (110)
White alone - Speak only English Native:
96.9% (2,199)Foreign-born:
25.4% (76)
White alone - Speak another language Native:
3.1% (71)Foreign-born:
72.5% (216)
Hispanic or Latino - Speak only English Native:
33.1% (293)Foreign-born:
32.7% (165)
Hispanic or Latino - Speak another language Native:
67.4% (596)Foreign-born:
73.0% (370)
Foreign-born residents in Dacula 1,549 residents are foreign born (10.7% Latin America , 6.5% Asia , 4.3% Europe ).
This city:
22.0%Georgia:
10.4%
Marital status for residents in Dacula Marital status - White (Caucasian) population 15 years and over
Males 25.5% Never married66.5% Now married0.0% Separated0.0% Widowed8.0% DivorcedFemales 19.7% Never married56.7% Now married0.0% Separated10.4% Widowed13.2% DivorcedWomen who gave birth in the past 12 months Now married:
100.0% (30)Unmarried:
0.0% (0)
Women who did not give birth in the past 12 months Now married:
51.8% (246)Unmarried:
48.2% (229)
Marital status - Black or African American population 15 years and over
Males 7.6% Never married92.4% Now married0.0% Separated0.0% Widowed0.0% DivorcedFemales 24.2% Never married60.2% Now married0.0% Separated0.0% Widowed15.6% DivorcedWomen who did not give birth in the past 12 months Now married:
68.6% (319)Unmarried:
31.4% (146)
Marital status - Asian population 15 years and over
Males 32.5% Never married67.5% Now married0.0% Separated0.0% Widowed0.0% DivorcedFemales 44.1% Never married55.9% Now married0.0% Separated0.0% Widowed0.0% DivorcedWomen who did not give birth in the past 12 months Now married:
31.7% (34)Unmarried:
68.3% (73)
Marital status - Other race population 15 years and over
Males 25.1% Never married43.9% Now married30.9% Separated0.0% Widowed0.0% DivorcedFemales 53.2% Never married46.8% Now married0.0% Separated0.0% Widowed0.0% DivorcedWomen who did not give birth in the past 12 months Now married:
20.7% (50)Unmarried:
79.3% (190)
Marital status - Two or more races population 15 years and over
Males 58.9% Never married41.1% Now married0.0% Separated0.0% Widowed0.0% DivorcedFemales 48.4% Never married43.8% Now married0.0% Separated7.8% Widowed0.0% DivorcedWomen who did not give birth in the past 12 months Now married:
36.4% (91)Unmarried:
63.6% (159)
Marital status - White alone, not Hispanic / Latino population 15 years and over
Males 20.9% Never married70.6% Now married0.0% Separated0.0% Widowed8.5% DivorcedFemales 14.3% Never married60.8% Now married0.0% Separated10.7% Widowed14.2% DivorcedWomen who gave birth in the past 12 months Now married:
100.0% (34)Unmarried:
0.0% (0)
Women who did not give birth in the past 12 months Now married:
60.1% (272)Unmarried:
39.9% (180)
Marital status - Hispanic or Latino population 15 years and over
Males 59.4% Never married40.6% Now married0.0% Separated0.0% Widowed0.0% DivorcedFemales 37.3% Never married58.1% Now married0.0% Separated4.6% Widowed0.0% DivorcedWomen who did not give birth in the past 12 months Now married:
47.6% (192)Unmarried:
52.4% (212)
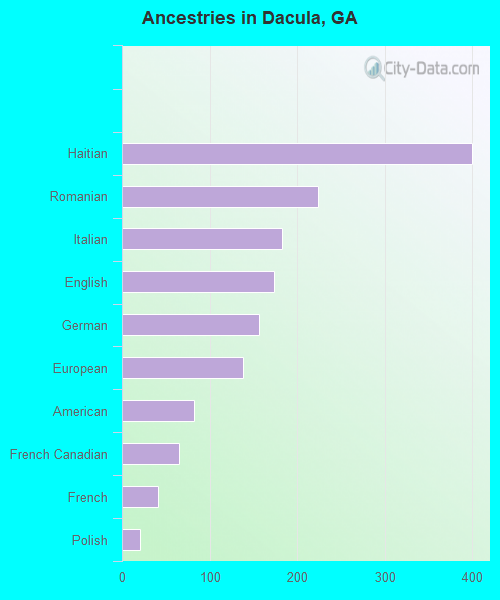
Ancestries in Dacula
399 16.0% Haitian224 9.0% Romanian183 7.4% Italian173 7.0% English156 6.3% German138 5.5% European82 3.3% American65 2.6% French Canadian41 1.6% French21 0.8% Polish2 0.08% Bahamian
Children Nativity (place of birth) in Dacula
Children under 6 years - Living with two parents Both parents native 399 100.0% NativeBoth parents foreign-born 71 100.0% NativeChildren under 6 years - Living with one parent Native parent 225 100.0% NativeChildren 6 to 17 years - Living with two parents Both parents native 180 100.0% NativeBoth parents foreign-born 172 100.0% NativeOne native, one foreign-born parent 179 100.0% NativeChildren 6 to 17 years - Living with one parent Native parent 91 100.0% NativeForeign-born parent 344 63.7% Native196 36.3% Foreign-born
Grandparents responsible for own grandchildren in Dacula
Grandparents (30 to 59 years) Black or African American 96 100.0% Not responsible for grandchildrenAsian 79 100.0% Responsible for grandchildren
Grandparents (60 years and over) Asian 66 100.0% Not responsible for grandchildren