Races in Danwood, South Carolina (SC) Detailed Stats
Ancestries, Foreign-born residents, place of birth
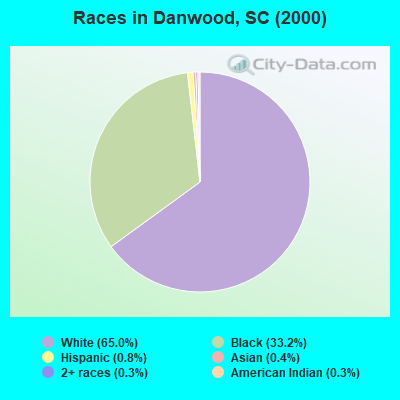
Race distribution in Danwood

- 8,06065.0%White alone
- 4,11233.2%Black alone
- 1000.8%Hispanic
- 540.4%Asian alone
- 400.3%Two or more races
- 350.3%American Indian alone
- 10.01%Other race alone
2000
2022
-
- 2,652,29166.1%White alone
- 1,178,48629.4%Black alone
- 95,0762.4%Hispanic
- 35,5680.9%Asian alone
- 33,2900.8%Two or more races
- 12,7650.3%American Indian alone
- 3,2660.08%Other race alone
- 1,2700.03%Native Hawaiian and Other
Pacific Islander alone

-
- 3,301,73962.5%White alone
- 1,313,29024.9%Black alone
- 343,7836.5%Hispanic
- 190,5083.6%Two or more races
- 89,8881.7%Asian alone
- 29,3900.6%Other race alone
- 12,1120.2%American Indian alone
- 1,9240.04%Native Hawaiian and Other
Pacific Islander alone

Income and house value in Danwood
- Median household income in 2022
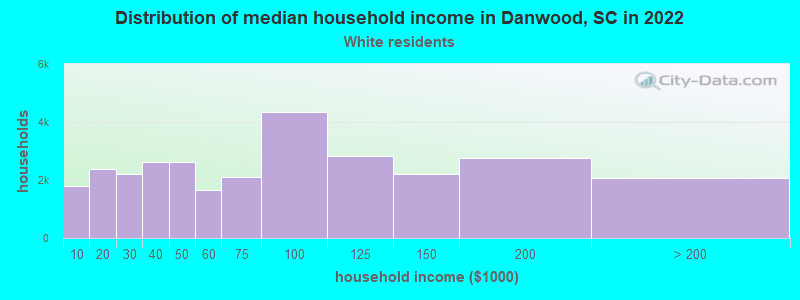
- $74,652White non-Hispanic householders
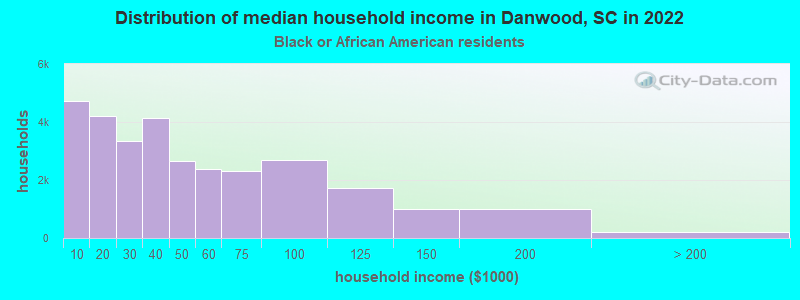
- $47,424Black householders
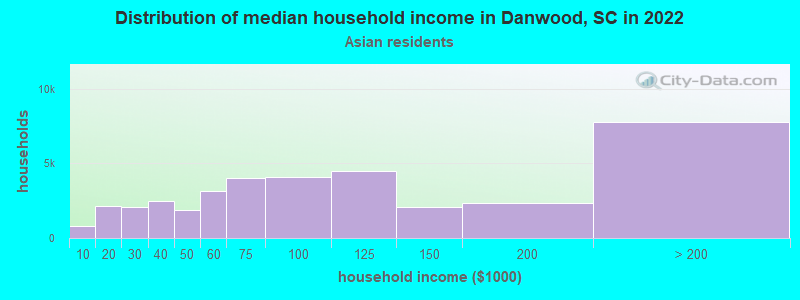
- $198,173Asian householders
- $65,513Some other race householders
- $102,368Hispanic or Latino race householders
- Median 2022 house value
- $285,619White Non-Hispanic householders
- $168,479Black or African American householders
- $774,667Asian householders
- $180,771Some other race householders
- $180,771Hispanic or Latino householders
Household income for White non-Hispanic householders
Household income for Black householders
Household income for Asian householders
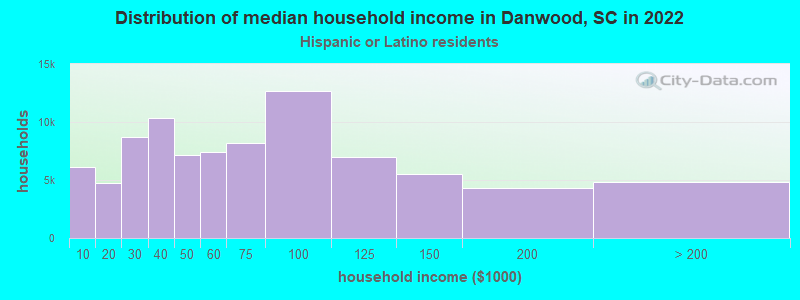
Household income for Hispanic or Latino race householders
Zip code: 29541