Races in Davenport, Iowa (IA) Detailed Stats
Data:
Races - White alone (%)
Races - White alone (% change since 2000)
Races - Black alone (%)
Races - Black alone (% change since 2000)
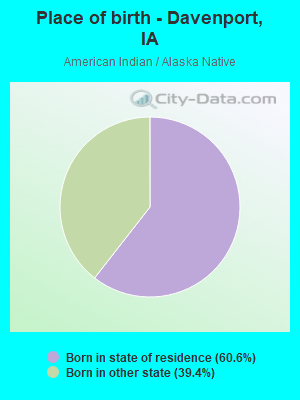
Races - American Indian alone (%)
Races - American Indian alone (% change since 2000)
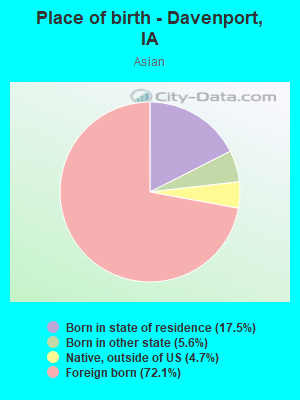
Races - Asian alone (%)
Races - Asian alone (% change since 2000)
Races - Hispanic (%)
Races - Hispanic (% change since 2000)
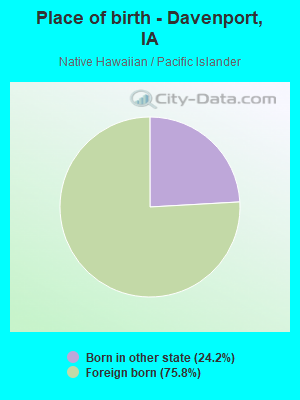
Races - Native Hawaiian and Other Pacific Islander alone (%)
Races - Native Hawaiian and Other Pacific Islander alone (% change since 2000)
Races - Two or more races(%)
Races - Two or more races(% change since 2000)
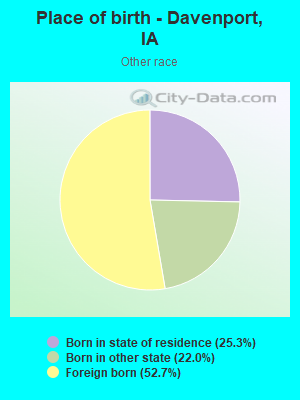
Races - Other race alone (%)
Races - Other race alone (% change since 2000)
Racial diversity
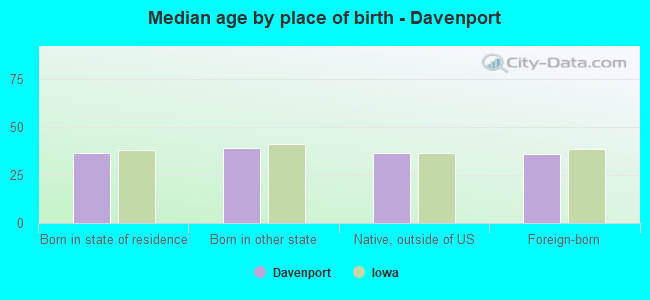
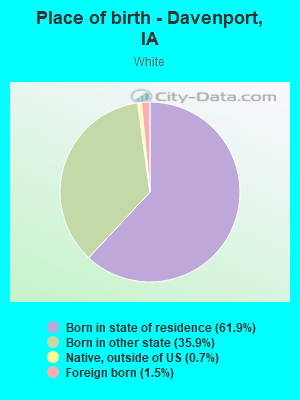
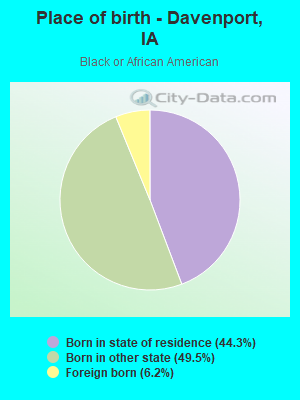
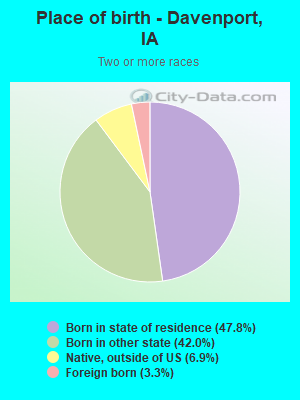
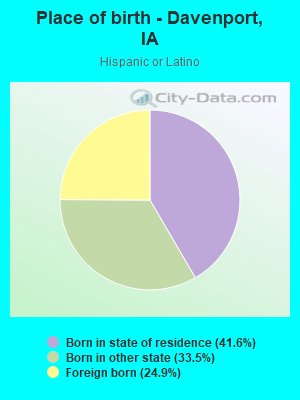
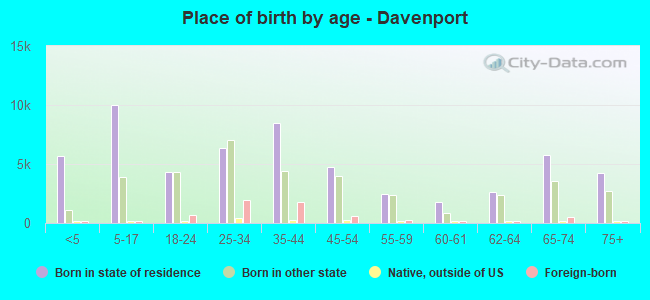
Place of birth - Born in state of residence (%)
Place of birth - Born in state of residence (%) - White
Place of birth - Born in state of residence (%) - Black or African American
Place of birth - Born in state of residence (%) - Asian
Place of birth - Born in state of residence (%) - Hispanic or Latino
Place of birth - Born in state of residence (%) - American Indian and Alaska Native
Place of birth - Born in state of residence (%) - Multirace
Place of birth - Born in state of residence (%) - Other Race
Place of birth - Born in other state (%)
Place of birth - Born in other state (%) - White
Place of birth - Born in other state (%) - Black or African American
Place of birth - Born in other state (%) - Asian
Place of birth - Born in other state (%) - Hispanic or Latino
Place of birth - Born in other state (%) - American Indian and Alaska Native
Place of birth - Born in other state (%) - Multirace
Place of birth - Born in other state (%) - Other Race
Place of birth - Native, outside of US (%)
Place of birth - Native, outside of US (%) - White
Place of birth - Native, outside of US (%) - Black or African American
Place of birth - Native, outside of US (%) - Asian
Place of birth - Native, outside of US (%) - Hispanic or Latino
Place of birth - Native, outside of US (%) - American Indian and Alaska Native
Place of birth - Native, outside of US (%) - Multirace
Place of birth - Native, outside of US (%) - Other Race
Place of birth - Foreign born (%)
Place of birth - Foreign born (%) - White
Place of birth - Foreign born (%) - Black or African American
Place of birth - Foreign born (%) - Asian
Place of birth - Foreign born (%) - Hispanic or Latino
Place of birth - Foreign born (%) - American Indian and Alaska Native
Place of birth - Foreign born (%) - Multirace
Place of birth - Foreign born (%) - Other Race
Residents speaking English at home (%)
Residents speaking English at home - Born in the United States (%)
Residents speaking English at home - Native, born elsewhere (%)
Residents speaking English at home - Foreign born (%)
Residents speaking Spanish at home (%)
Residents speaking Spanish at home - Born in the United States (%)
Residents speaking Spanish at home - Native, born elsewhere (%)
Residents speaking Spanish at home - Foreign born (%)
Residents speaking other language at home (%)
Residents speaking other language at home - Born in the United States (%)
Residents speaking other language at home - Native, born elsewhere (%)
Residents speaking other language at home - Foreign born (%)
Marital status - Never married (%)
Marital status - Now married (%)
Marital status - Separated (%)
Marital status - Widowed (%)
Marital status - Divorced (%)
Ancestries Reported - Arab (%)
Ancestries Reported - Czech (%)
Ancestries Reported - Danish (%)
Ancestries Reported - Dutch (%)
Ancestries Reported - English (%)
Ancestries Reported - French (%)
Ancestries Reported - French Canadian (%)
Ancestries Reported - German (%)
Ancestries Reported - Greek (%)
Ancestries Reported - Hungarian (%)
Ancestries Reported - Irish (%)
Ancestries Reported - Italian (%)
Ancestries Reported - Lithuanian (%)
Ancestries Reported - Norwegian (%)
Ancestries Reported - Polish (%)
Ancestries Reported - Portuguese (%)
Ancestries Reported - Russian (%)
Ancestries Reported - Scotch-Irish (%)
Ancestries Reported - Scottish (%)
Ancestries Reported - Slovak (%)
Ancestries Reported - Subsaharan African (%)
Ancestries Reported - Swedish (%)
Ancestries Reported - Swiss (%)
Ancestries Reported - Ukrainian (%)
Ancestries Reported - United States (%)
Ancestries Reported - Welsh (%)
Ancestries Reported - West Indian (%)
Ancestries Reported - Other (%)
Geographical mobility - Same house 1 year ago (%)
Geographical mobility - Same house 1 year ago (%) - White
Geographical mobility - Same house 1 year ago (%) - Black or African American
Geographical mobility - Same house 1 year ago (%) - Asian
Geographical mobility - Same house 1 year ago (%) - Hispanic or Latino
Geographical mobility - Same house 1 year ago (%) - American Indian and Alaska Native
Geographical mobility - Same house 1 year ago (%) - Multirace
Geographical mobility - Same house 1 year ago (%) - Other Race
Geographical mobility - Moved within same county (%)
Geographical mobility - Moved within same county (%) - White
Geographical mobility - Moved within same county (%) - Black or African American
Geographical mobility - Moved within same county (%) - Asian
Geographical mobility - Moved within same county (%) - Hispanic or Latino
Geographical mobility - Moved within same county (%) - American Indian and Alaska Native
Geographical mobility - Moved within same county (%) - Multirace
Geographical mobility - Moved within same county (%) - Other Race
Geographical mobility - Moved from different county within same state (%)
Geographical mobility - Moved from different county within same state (%) - White
Geographical mobility - Moved from different county within same state (%) - Black or African American
Geographical mobility - Moved from different county within same state (%) - Asian
Geographical mobility - Moved from different county within same state (%) - Hispanic or Latino
Geographical mobility - Moved from different county within same state (%) - American Indian and Alaska Native
Geographical mobility - Moved from different county within same state (%) - Multirace
Geographical mobility - Moved from different county within same state (%) - Other Race
Geographical mobility - Moved from different state (%)
Geographical mobility - Moved from different state (%) - White
Geographical mobility - Moved from different state (%) - Black or African American
Geographical mobility - Moved from different state (%) - Asian
Geographical mobility - Moved from different state (%) - Hispanic or Latino
Geographical mobility - Moved from different state (%) - American Indian and Alaska Native
Geographical mobility - Moved from different state (%) - Multirace
Geographical mobility - Moved from different state (%) - Other Race
Geographical mobility - Moved from abroad (%)
Geographical mobility - Moved from abroad (%) - White
Geographical mobility - Moved from abroad (%) - Black or African American
Geographical mobility - Moved from abroad (%) - Asian
Geographical mobility - Moved from abroad (%) - Hispanic or Latino
Geographical mobility - Moved from abroad (%) - American Indian and Alaska Native
Geographical mobility - Moved from abroad (%) - Multirace
Geographical mobility - Moved from abroad (%) - Other Race
Place of birth for the foreign-born population - Ireland (%)
Place of birth for the foreign-born population - Denmark (%)
Place of birth for the foreign-born population - Norway (%)
Place of birth for the foreign-born population - Sweden (%)
Place of birth for the foreign-born population - United Kingdom (%)
Place of birth for the foreign-born population - England (%)
Place of birth for the foreign-born population - Scotland (%)
Place of birth for the foreign-born population - Other Northern Europe (%)
Place of birth for the foreign-born population - Austria (%)
Place of birth for the foreign-born population - Belgium (%)
Place of birth for the foreign-born population - France (%)
Place of birth for the foreign-born population - Germany (%)
Place of birth for the foreign-born population - Netherlands (%)
Place of birth for the foreign-born population - Switzerland (%)
Place of birth for the foreign-born population - Other Western Europe (%)
Place of birth for the foreign-born population - Greece (%)
Place of birth for the foreign-born population - Italy (%)
Place of birth for the foreign-born population - Portugal (%)
Place of birth for the foreign-born population - Spain (%)
Place of birth for the foreign-born population - Other Southern Europe (%)
Place of birth for the foreign-born population - Albania (%)
Place of birth for the foreign-born population - Belarus (%)
Place of birth for the foreign-born population - Bosnia and Herzegovina (%)
Place of birth for the foreign-born population - Bulgaria (%)
Place of birth for the foreign-born population - Croatia (%)
Place of birth for the foreign-born population - Czechoslovakia (%)
Place of birth for the foreign-born population - Hungary (%)
Place of birth for the foreign-born population - Latvia (%)
Place of birth for the foreign-born population - Lithuania (%)
Place of birth for the foreign-born population - North Macedonia (Macedonia) (%)
Place of birth for the foreign-born population - Moldova (%)
Place of birth for the foreign-born population - Poland (%)
Place of birth for the foreign-born population - Romania (%)
Place of birth for the foreign-born population - Russia (%)
Place of birth for the foreign-born population - Serbia (%)
Place of birth for the foreign-born population - Ukraine (%)
Place of birth for the foreign-born population - Other Eastern Europe (%)
Place of birth for the foreign-born population - China (%)
Place of birth for the foreign-born population - Hong Kong (%)
Place of birth for the foreign-born population - Taiwan (%)
Place of birth for the foreign-born population - Japan (%)
Place of birth for the foreign-born population - Korea (%)
Place of birth for the foreign-born population - Other Eastern Asia (%)
Place of birth for the foreign-born population - Afghanistan (%)
Place of birth for the foreign-born population - Bangladesh (%)
Place of birth for the foreign-born population - India (%)
Place of birth for the foreign-born population - Iran (%)
Place of birth for the foreign-born population - Kazakhstan (%)
Place of birth for the foreign-born population - Nepal (%)
Place of birth for the foreign-born population - Pakistan (%)
Place of birth for the foreign-born population - Sri Lanka (%)
Place of birth for the foreign-born population - Uzbekistan (%)
Place of birth for the foreign-born population - Other South Central Asia (%)
Place of birth for the foreign-born population - Burma (%)
Place of birth for the foreign-born population - Cambodia (%)
Place of birth for the foreign-born population - Indonesia (%)
Place of birth for the foreign-born population - Laos (%)
Place of birth for the foreign-born population - Malaysia (%)
Place of birth for the foreign-born population - Philippines (%)
Place of birth for the foreign-born population - Singapore (%)
Place of birth for the foreign-born population - Thailand (%)
Place of birth for the foreign-born population - Vietnam (%)
Place of birth for the foreign-born population - Other South Eastern Asia (%)
Place of birth for the foreign-born population - Armenia (%)
Place of birth for the foreign-born population - Iraq (%)
Place of birth for the foreign-born population - Israel (%)
Place of birth for the foreign-born population - Jordan (%)
Place of birth for the foreign-born population - Kuwait (%)
Place of birth for the foreign-born population - Lebanon (%)
Place of birth for the foreign-born population - Saudi Arabia (%)
Place of birth for the foreign-born population - Syria (%)
Place of birth for the foreign-born population - Turkey (%)
Place of birth for the foreign-born population - Yemen (%)
Place of birth for the foreign-born population - Other Western Asia (%)
Place of birth for the foreign-born population - Eritrea (%)
Place of birth for the foreign-born population - Ethiopia (%)
Place of birth for the foreign-born population - Kenya (%)
Place of birth for the foreign-born population - Somalia (%)
Place of birth for the foreign-born population - Uganda (%)
Place of birth for the foreign-born population - Zimbabwe (%)
Place of birth for the foreign-born population - Other Eastern Africa (%)
Place of birth for the foreign-born population - Cameroon (%)
Place of birth for the foreign-born population - Congo (%)
Place of birth for the foreign-born population - Democratic Republic of Congo (Zaire) (%)
Place of birth for the foreign-born population - Other Middle Africa (%)
Place of birth for the foreign-born population - Egypt (%)
Place of birth for the foreign-born population - Morocco (%)
Place of birth for the foreign-born population - Sudan (%)
Place of birth for the foreign-born population - Other Northern Africa (%)
Place of birth for the foreign-born population - South Africa (%)
Place of birth for the foreign-born population - Other Southern Africa (%)
Place of birth for the foreign-born population - Cabo Verde (%)
Place of birth for the foreign-born population - Ghana (%)
Place of birth for the foreign-born population - Liberia (%)
Place of birth for the foreign-born population - Nigeria (%)
Place of birth for the foreign-born population - Senegal (%)
Place of birth for the foreign-born population - Sierra Leone (%)
Place of birth for the foreign-born population - Other Western Africa (%)
Place of birth for the foreign-born population - Australia (%)
Place of birth for the foreign-born population - New Zealand (%)
Place of birth for the foreign-born population - Fiji (%)
Place of birth for the foreign-born population - Micronesia (%)
Place of birth for the foreign-born population - Bahamas (%)
Place of birth for the foreign-born population - Barbados (%)
Place of birth for the foreign-born population - Cuba (%)
Place of birth for the foreign-born population - Dominica (%)
Place of birth for the foreign-born population - Dominican Republic (%)
Place of birth for the foreign-born population - Grenada (%)
Place of birth for the foreign-born population - Haiti (%)
Place of birth for the foreign-born population - Jamaica (%)
Place of birth for the foreign-born population - St. Vincent and the Grenadines (%)
Place of birth for the foreign-born population - Trinidad and Tobago (%)
Place of birth for the foreign-born population - West Indies (%)
Place of birth for the foreign-born population - Other Caribbean (%)
Place of birth for the foreign-born population - Belize (%)
Place of birth for the foreign-born population - Costa Rica (%)
Place of birth for the foreign-born population - El Salvador (%)
Place of birth for the foreign-born population - Guatemala (%)
Place of birth for the foreign-born population - Honduras (%)
Place of birth for the foreign-born population - Mexico (%)
Place of birth for the foreign-born population - Nicaragua (%)
Place of birth for the foreign-born population - Panama (%)
Place of birth for the foreign-born population - Other Central America (%)
Place of birth for the foreign-born population - Argentina (%)
Place of birth for the foreign-born population - Bolivia (%)
Place of birth for the foreign-born population - Brazil (%)
Place of birth for the foreign-born population - Chile (%)
Place of birth for the foreign-born population - Colombia (%)
Place of birth for the foreign-born population - Ecuador (%)
Place of birth for the foreign-born population - Guyana (%)
Place of birth for the foreign-born population - Peru (%)
Place of birth for the foreign-born population - Uruguay (%)
Place of birth for the foreign-born population - Venezuela (%)
Place of birth for the foreign-born population - Other South America (%)
Place of birth for the foreign-born population - Canada (%)
Place of birth for the foreign-born population - Other Northern America (%)
Place of birth for the foreign-born population - Other (%)
Latest news about races in Davenport, IA collected exclusively by city-data.com from local newspapers, TV, and radio stations
According to 2022 data, the most numerous races in Davenport, IA are White alone (71,843 residents), Hispanic (9,078 residents), and Black alone (11,600 residents). 92.2% of Davenport residents speak English at home. 4.8% of Davenport, IA residents are foreign-born (2.3% born in Latin America, 1.4% born in Asia), which is 4.9% less than the foreign-born rate of 5.0% across the entire state of Iowa.
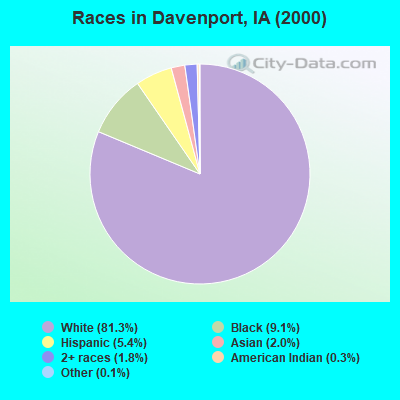
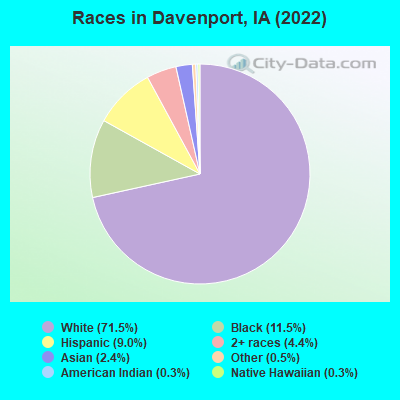
Race distribution in Davenport
2000 2022
79,972 81.3% White alone 8,917 9.1% Black alone 5,268 5.4% Hispanic 1,947 2.0% Asian alone 1,793 1.8% Two or more races 303 0.3% American Indian alone 138 0.1% Other race alone 21 0.02% Native Hawaiian and Other
71,843 71.5% White alone 11,600 11.5% Black alone 9,078 9.0% Hispanic 4,415 4.4% Two or more races 2,437 2.4% Asian alone 521 0.5% Other race alone 264 0.3% Native Hawaiian and Other 333 0.3% American Indian alone
2000 2022
2,710,344 92.6% White alone 82,473 2.8% Hispanic 60,744 2.1% Black alone 36,345 1.2% Asian alone 25,472 0.9% Two or more races 7,955 0.3% American Indian alone 2,103 0.07% Other race alone 888 0.03% Native Hawaiian and Other
2,650,110 82.8% White alone 218,024 6.8% Hispanic 119,004 3.7% Black alone 115,286 3.6% Two or more races 74,892 2.3% Asian alone 9,260 0.3% Other race alone 8,595 0.3% Native Hawaiian and Other 5,346 0.2% American Indian alone
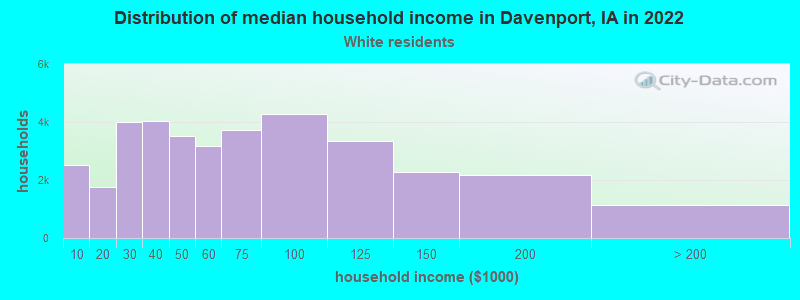
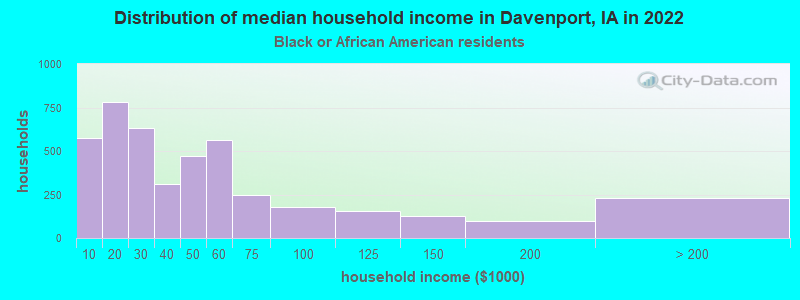
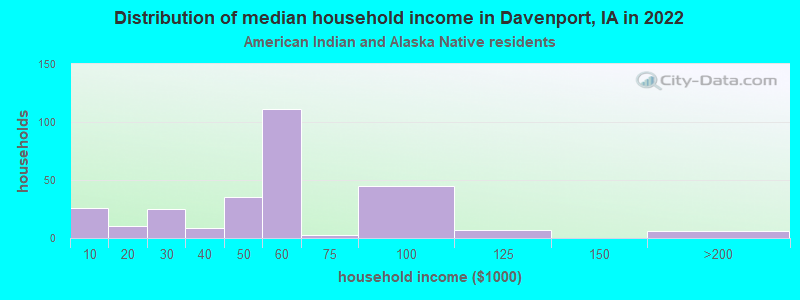
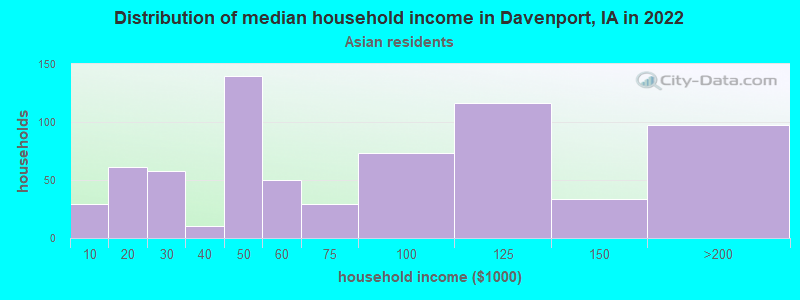
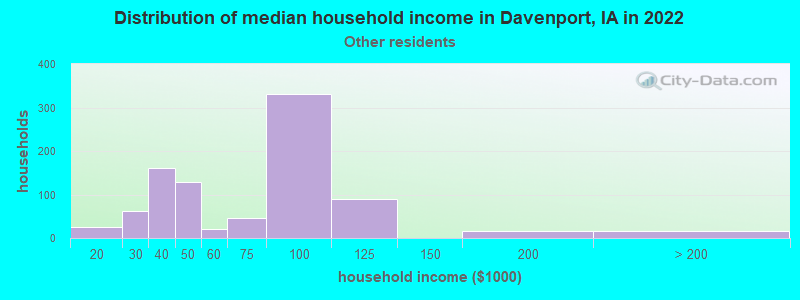
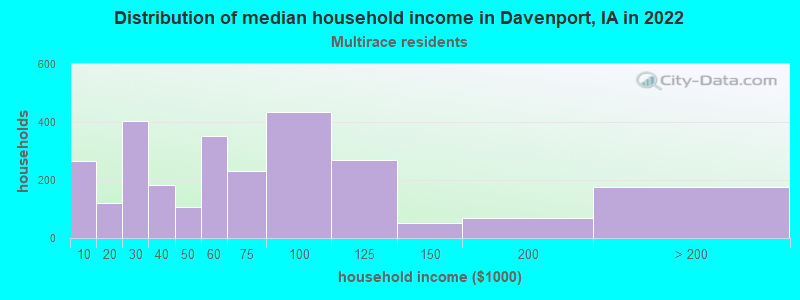
Income and house value in Davenport Median household income in 2022 $56,605 White non-Hispanic householders$36,815 Black householders$45,174 American Indian and Alaska Native householders$91,696 Asian householders$62,640 Some other race householders$73,409 Two or more races householders$35,656 Hispanic or Latino race householdersMedian 2022 house value $167,541 White Non-Hispanic householders$131,859 Black or African American householders$133,295 American Indian or Alaska Native householders $169,797 Asian householders$122,426 Some other race householders$133,295 Two or more races householders$129,809 Hispanic or Latino householders
Median age by race in Davenport
41.0 Median age for White residents40.8 41.4 28.1 Median age for Black or African American residents24.5 28.7 51.9 Median age for American Indian / Alaska Native residents51.2 57.4 36.6 Median age for Asian residents36.6 36.6 -666,666,666.0 Median age for Native Hawaiian / Pacific Islander residents-666,666,666.0 -666,666,666.0 31.4 Median age for Other race residents33.2 15.3 31.1 Median age for Two or more races residents31.3 24.3 41.7 Median age for White alone residents41.2 43.3 31.4 Median age for Hispanic or Latino residents32.6 23.6
Owner/renter occupied households by race in Davenport
House owners and renters - White residents 24,819 69.0% Owner occupied11,149 31.0% Renter occupiedHouse owners and renters - Black or African American residents 1,656 33.4% Owner occupied3,305 66.6% Renter occupiedHouse owners and renters - American Indian / Alaska Native residents 115 47.6% Owner occupied127 52.4% Renter occupiedHouse owners and renters - Asian residents 318 42.7% Owner occupied427 57.3% Renter occupiedHouse owners and renters - Native Hawaiian / Pacific Islander residents 39 100.0% Renter occupiedHouse owners and renters - Other race residents 379 61.3% Owner occupied239 38.7% Renter occupiedHouse owners and renters - Two or more races residents 628 34.2% Owner occupied1,210 65.8% Renter occupiedHouse owners and renters - White alone residents 23,924 69.5% Owner occupied10,485 30.5% Renter occupiedHouse owners and renters - Hispanic or Latino residents 1,521 53.9% Owner occupied1,301 46.1% Renter occupied
Language usage in Davenport
English speakers - Total 92.2% of residents of Davenport speak English at home.
4.6% of residents speak Spanish at home 2,113 48.6% Speak English very well2,239 51.4% Speak English less than very well3.6% of residents speak other language at home 1,514 44.8% Speak English very well1,867 55.2% Speak English less than very well
English speakers - Born in the United States 96.7% of residents of Davenport speak English at home.
2.9% of residents speak Spanish at home 798 79.1% Speak English very well211 20.9% Speak English less than very well0.6% of residents speak other language at home 78 37.1% Speak English very well132 62.9% Speak English less than very well
English speakers - Native, born elsewhere 71.1% of residents of Davenport speak English at home.
14.5% of residents speak Spanish at home 110 90.9% Speak English very well11 9.1% Speak English less than very well8.6% of residents speak other language at home 55 76.4% Speak English very well17 23.6% Speak English less than very well
English speakers - Foreign-born 12.0% of residents of Davenport speak English at home.
42.5% of residents speak Spanish at home 399 17.4% Speak English very well1,898 82.6% Speak English less than very well49.9% of residents speak other language at home 1,052 39.0% Speak English very well1,646 61.0% Speak English less than very well
White (Caucasian) - Speak only English Native:
98.2% (68,027)Foreign-born:
64.4% (735)
White (Caucasian) - Speak another language Native:
1.8% (1,281)Foreign-born:
35.6% (406)
Black or African American - Speak only English Native:
98.3% (9,345)Foreign-born:
6.0% (36)
Black or African American - Speak another language Native:
1.8% (167)Foreign-born:
98.9% (592)
Asian - Speak only English Native:
71.0% (164)Foreign-born:
14.6% (292)
Asian - Speak another language Native:
29.0% (67)Foreign-born:
85.4% (1,704)
Other race - Speak only English Native:
64.2% (938)Foreign-born:
10.2% (90)
Other race - Speak another language Native:
36.1% (528)Foreign-born:
89.3% (787)
Two or more races - Speak only English Native:
88.6% (7,327)Foreign-born:
38.1% (401)
Two or more races - Speak another language Native:
9.7% (801)Foreign-born:
65.8% (693)
White alone - Speak only English Native:
99.1% (65,726)Foreign-born:
64.4% (735)
White alone - Speak another language Native:
0.9% (570)Foreign-born:
35.6% (406)
Hispanic or Latino - Speak another language Native:
24.9% (1,486)Foreign-born:
100.0% (2,261)
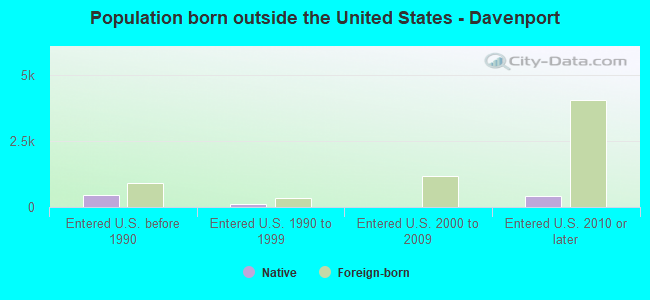
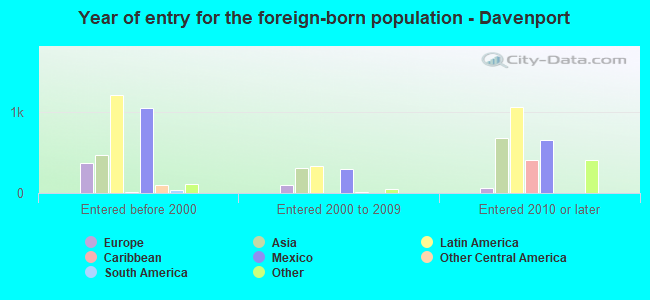
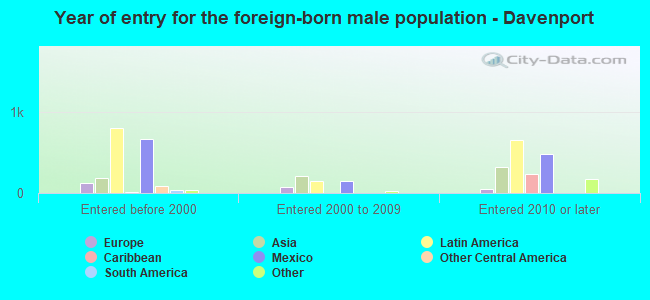
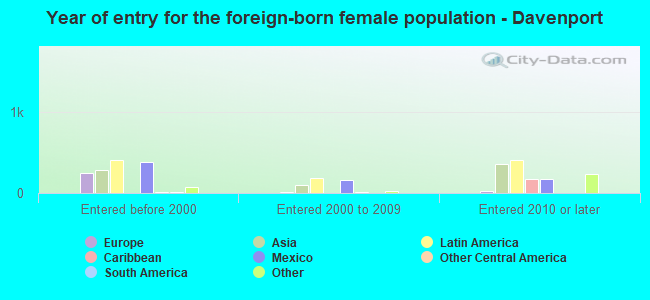
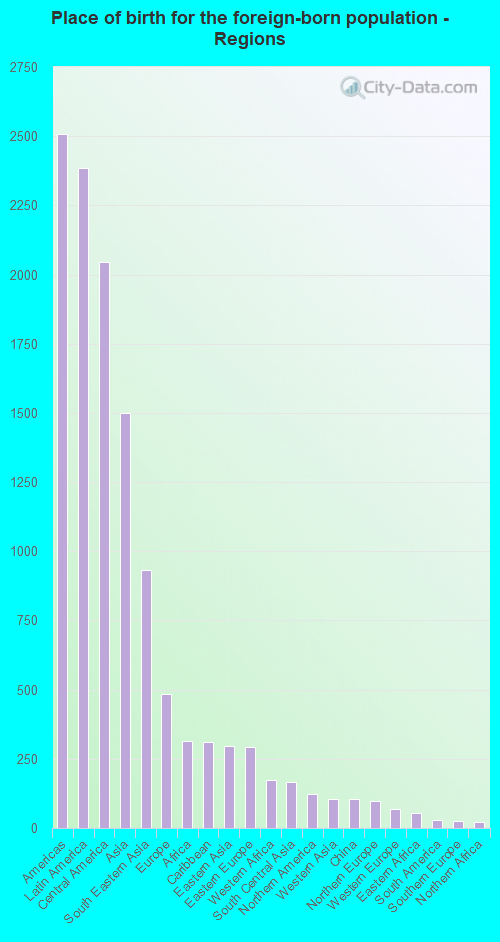
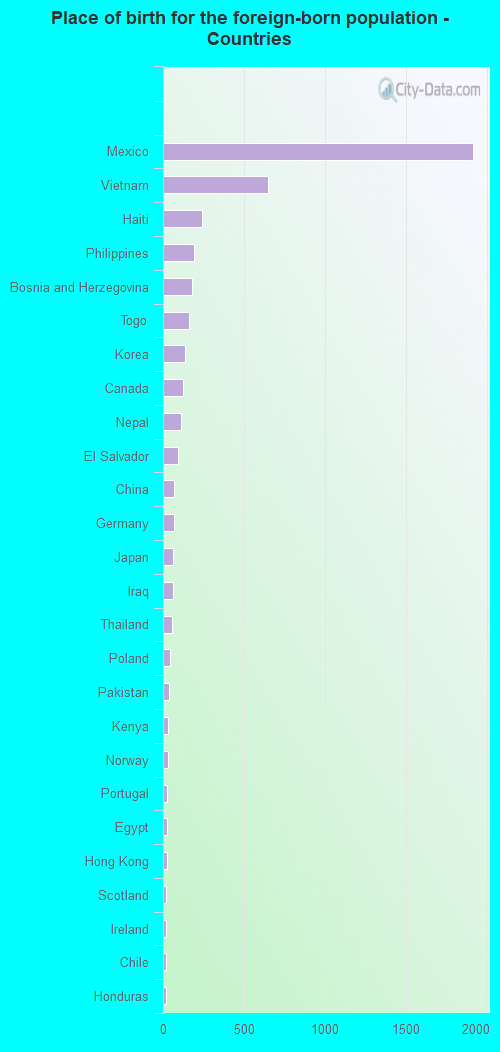
Foreign-born residents in Davenport 4,826 residents are foreign born (2.3% Latin America , 1.4% Asia ).
Marital status for residents in Davenport Marital status - White (Caucasian) population 15 years and over
Males 39.4% Never married44.9% Now married1.2% Separated2.0% Widowed12.5% DivorcedFemales 31.6% Never married44.2% Now married0.5% Separated10.1% Widowed13.6% DivorcedWomen who gave birth in the past 12 months Now married:
65.1% (661)Unmarried:
34.9% (355)
Women who did not give birth in the past 12 months Now married:
38.9% (6,637)Unmarried:
61.1% (10,442)
Marital status - Black or African American population 15 years and over
Males 49.6% Never married31.3% Now married0.0% Separated6.0% Widowed13.0% DivorcedFemales 71.7% Never married23.7% Now married0.0% Separated3.5% Widowed1.1% DivorcedWomen who gave birth in the past 12 months Now married:
19.6% (30)Unmarried:
80.4% (124)
Women who did not give birth in the past 12 months Now married:
25.4% (693)Unmarried:
74.6% (2,038)
Marital status - American Indian / Alaska Native population 15 years and over
Males 23.7% Never married24.5% Now married0.0% Separated0.0% Widowed51.8% DivorcedFemales 51.4% Never married27.6% Now married0.5% Separated0.0% Widowed20.5% DivorcedWomen who did not give birth in the past 12 months Now married:
20.6% (27)Unmarried:
79.4% (105)
Marital status - Asian population 15 years and over
Males 28.2% Never married65.4% Now married0.0% Separated1.9% Widowed4.6% DivorcedFemales 56.0% Never married33.2% Now married0.0% Separated0.8% Widowed10.0% DivorcedWomen who gave birth in the past 12 months Now married:
100.0% (8)Unmarried:
0.0% (0)
Women who did not give birth in the past 12 months Now married:
32.0% (194)Unmarried:
68.0% (413)
Marital status - Other race population 15 years and over
Males 42.2% Never married47.5% Now married1.1% Separated1.1% Widowed8.0% DivorcedFemales 49.7% Never married27.6% Now married3.3% Separated1.2% Widowed18.1% DivorcedWomen who gave birth in the past 12 months Now married:
69.0% (38)Unmarried:
31.0% (17)
Women who did not give birth in the past 12 months Now married:
25.8% (133)Unmarried:
74.2% (383)
Marital status - Two or more races population 15 years and over
Males 53.8% Never married37.7% Now married0.0% Separated0.0% Widowed8.5% DivorcedFemales 44.5% Never married33.6% Now married0.0% Separated11.4% Widowed10.4% DivorcedWomen who gave birth in the past 12 months Now married:
34.0% (48)Unmarried:
66.0% (93)
Women who did not give birth in the past 12 months Now married:
27.4% (652)Unmarried:
72.6% (1,728)
Marital status - White alone, not Hispanic / Latino population 15 years and over
Males 39.8% Never married44.3% Now married1.2% Separated2.1% Widowed12.5% DivorcedFemales 30.9% Never married45.4% Now married0.5% Separated10.7% Widowed12.5% DivorcedWomen who gave birth in the past 12 months Now married:
62.6% (595)Unmarried:
37.4% (355)
Women who did not give birth in the past 12 months Now married:
39.9% (6,367)Unmarried:
60.1% (9,578)
Marital status - Hispanic or Latino population 15 years and over
Males 56.1% Never married29.7% Now married0.0% Separated0.0% Widowed14.1% DivorcedFemales 52.2% Never married20.1% Now married2.6% Separated0.0% Widowed25.1% DivorcedWomen who gave birth in the past 12 months Now married:
100.0% (183)Unmarried:
0.0% (0)
Women who did not give birth in the past 12 months Now married:
21.6% (458)Unmarried:
78.4% (1,663)
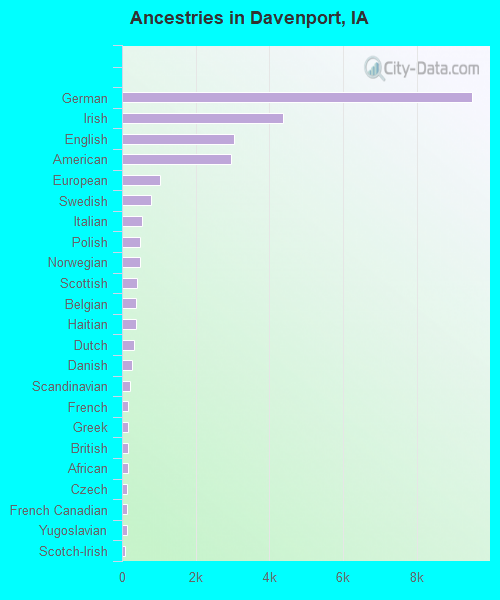
Ancestries in Davenport
9,494 20.8% German4,366 9.5% Irish3,045 6.7% English2,968 6.5% American1,035 2.3% European781 1.7% Swedish556 1.2% Italian498 1.1% Polish489 1.1% Norwegian412 0.9% Scottish384 0.8% Belgian376 0.8% Haitian326 0.7% Dutch270 0.6% Danish220 0.5% Scandinavian176 0.4% French167 0.4% Greek163 0.4% British159 0.3% African145 0.3% Czech143 0.3% French Canadian142 0.3% Yugoslavian87 0.2% Scotch-Irish79 0.2% Welsh78 0.2% Ukrainian64 0.1% Russian63 0.1% Hungarian59 0.1% Portuguese58 0.1% Northern European56 0.1% Swiss55 0.1% Jamaican40 0.09% Pennsylvania German37 0.08% Canadian37 0.08% Egyptian32 0.07% Eastern European30 0.07% Armenian29 0.06% Czechoslovakian24 0.05% Finnish24 0.05% Croatian20 0.04% South African18 0.04% Latvian18 0.04% Iranian14 0.03% Turkish10 0.02% Arab10 0.02% Austrian10 0.02% Kenyan10 0.02% Bulgarian6 0.01% Slavic4 0.01% Lithuanian3 0.01% Lebanese3 0.01% Brazilian
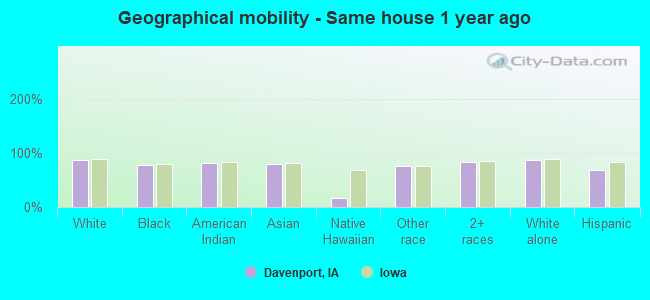
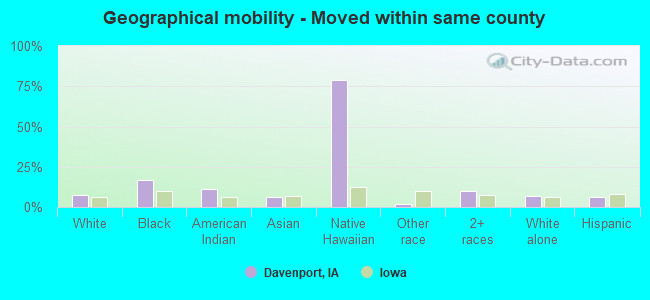
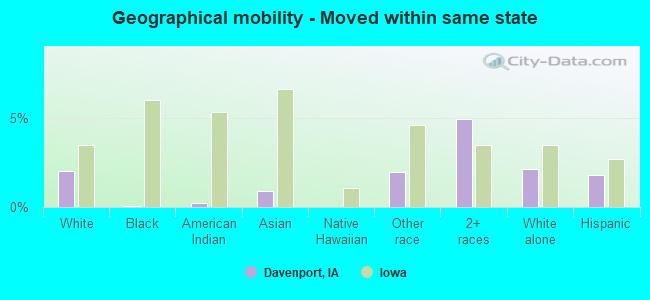
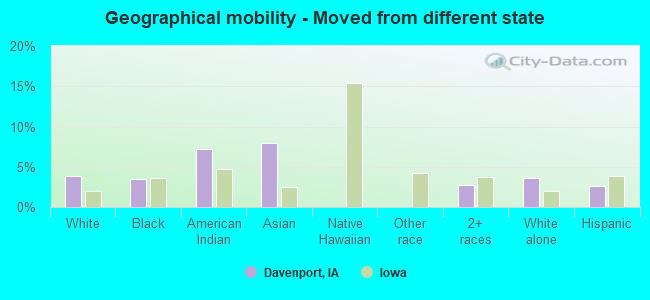
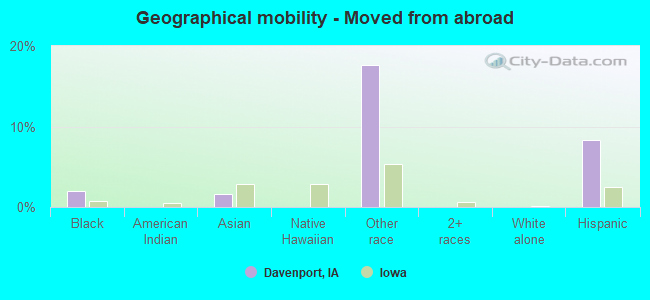
Geographical mobility in Davenport Same house 1 year ago 64,128 86.7% White (Caucasian)9,468 77.7% Black or African American326 81.2% American Indian / Alaska Native1,476 79.6% Asian8 16.8% Native Hawaiian / Pacific Islander2,004 75.5% Other race4,725 82.6% Two or more races61,509 87.2% White alone, not Hispanic / Latino6,332 68.5% Hispanic or LatinoMoved within same county 5,516 7.5% White / Caucasian2,042 16.8% Black or African American45 11.2% American Indian / Alaska Native121 6.5% Asian35 78.8% Native Hawaiian / Pacific Islander45 1.7% Other race561 9.8% Two or more races5,025 7.1% White alone, not Hispanic / Latino585 6.3% Hispanic or LatinoMoved within same state 1,486 2.0% White / Caucasian6 0.0% Black or African American1 0.2% American Indian / Alaska Native17 0.9% Asian52 2.0% Other race280 4.9% Two or more races1,486 2.1% White alone, not Hispanic / Latino165 1.8% Hispanic or LatinoMoved from different state 2,831 3.8% White / Caucasian422 3.5% Black or African American29 7.1% American Indian / Alaska Native148 8.0% Asian2 0.1% Other race154 2.7% Two or more races2,534 3.6% White alone, not Hispanic / Latino245 2.6% Hispanic or LatinoMoved from abroad 241 2.0% Black or African American30 1.6% Asian467 17.6% Other race764 8.3% Hispanic or Latino
Children Nativity (place of birth) in Davenport
Children under 6 years - Living with two parents Both parents native 3,760 100.0% Native0 0.0% Foreign-bornBoth parents foreign-born 225 93.5% Native16 6.5% Foreign-bornOne native, one foreign-born parent 125 100.0% NativeChildren under 6 years - Living with one parent Native parent 2,568 100.0% NativeForeign-born parent 140 100.0% NativeChildren 6 to 17 years - Living with two parents Both parents native 6,965 100.0% Native1 0.0% Foreign-bornBoth parents foreign-born 317 54.5% Native264 45.5% Foreign-bornOne native, one foreign-born parent 159 91.6% Native15 8.4% Foreign-bornChildren 6 to 17 years - Living with one parent Native parent 5,285 100.0% NativeForeign-born parent 109 51.8% Native101 48.2% Foreign-born
Grandparents responsible for own grandchildren in Davenport
Grandparents (30 to 59 years) White / Caucasian 178 32.3% Responsible for grandchildren373 67.7% Not responsible for grandchildrenBlack or African American 31 41.5% Responsible for grandchildren43 58.5% Not responsible for grandchildrenAmerican Indian / Alaska Native 7 19.5% Responsible for grandchildren27 80.5% Not responsible for grandchildrenAsian 15 100.0% Responsible for grandchildrenOther race 96 100.0% Responsible for grandchildrenTwo or more races 18 34.0% Responsible for grandchildren36 66.0% Not responsible for grandchildrenWhite alone, not Hispanic / Latino 178 34.8% Responsible for grandchildren333 65.2% Not responsible for grandchildrenHispanic or Latino 72 64.8% Responsible for grandchildren39 35.2% Not responsible for grandchildrenGrandparents (60 years and over) White / Caucasian 141 40.6% Responsible for grandchildren207 59.4% Not responsible for grandchildrenBlack or African American 37 100.0% Not responsible for grandchildrenAmerican Indian / Alaska Native 1 97.6% Responsible for grandchildrenAsian 21 100.0% Responsible for grandchildrenOther race 15 100.0% Not responsible for grandchildrenTwo or more races 4 22.7% Responsible for grandchildren14 77.3% Not responsible for grandchildrenWhite alone, not Hispanic / Latino 141 42.8% Responsible for grandchildren188 57.2% Not responsible for grandchildrenHispanic or Latino 0 0.5% Responsible for grandchildren106 99.5% Not responsible for grandchildren