Races in Davie, Florida (FL) Detailed Stats
Data:
Races - White alone (%)
Races - White alone (% change since 2000)
Races - Black alone (%)
Races - Black alone (% change since 2000)
Races - American Indian alone (%)
Races - American Indian alone (% change since 2000)
Races - Asian alone (%)
Races - Asian alone (% change since 2000)
Races - Hispanic (%)
Races - Hispanic (% change since 2000)
Races - Native Hawaiian and Other Pacific Islander alone (%)
Races - Native Hawaiian and Other Pacific Islander alone (% change since 2000)
Races - Two or more races(%)
Races - Two or more races(% change since 2000)
Races - Other race alone (%)
Races - Other race alone (% change since 2000)
Racial diversity
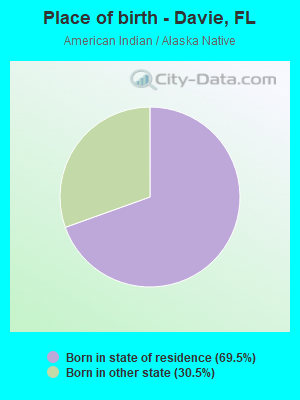
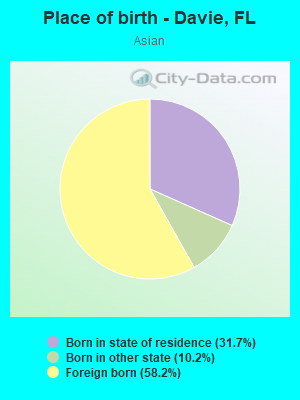
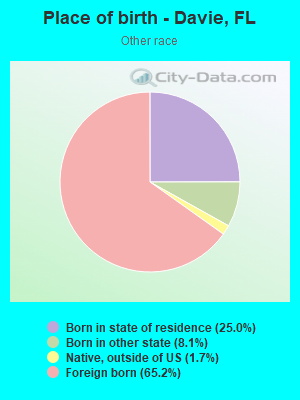
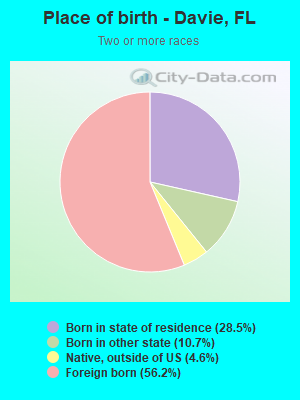
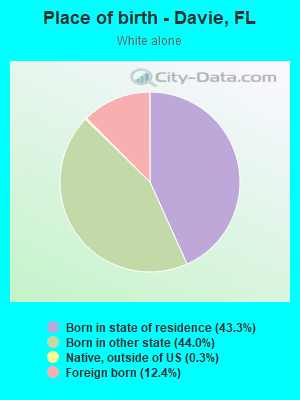
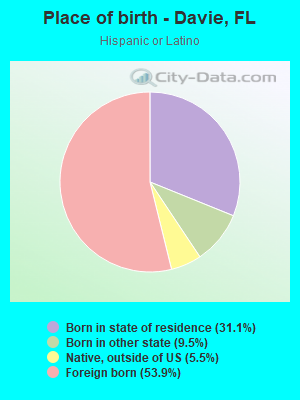
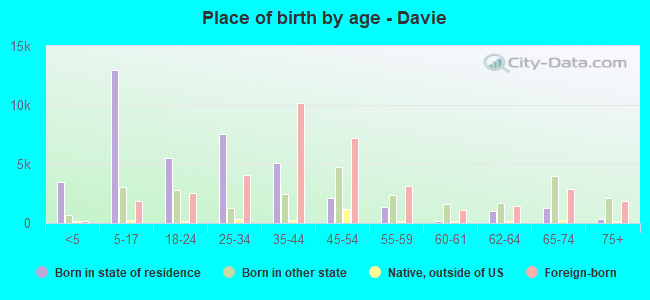
Place of birth - Born in state of residence (%)
Place of birth - Born in state of residence (%) - White
Place of birth - Born in state of residence (%) - Black or African American
Place of birth - Born in state of residence (%) - Asian
Place of birth - Born in state of residence (%) - Hispanic or Latino
Place of birth - Born in state of residence (%) - American Indian and Alaska Native
Place of birth - Born in state of residence (%) - Multirace
Place of birth - Born in state of residence (%) - Other Race
Place of birth - Born in other state (%)
Place of birth - Born in other state (%) - White
Place of birth - Born in other state (%) - Black or African American
Place of birth - Born in other state (%) - Asian
Place of birth - Born in other state (%) - Hispanic or Latino
Place of birth - Born in other state (%) - American Indian and Alaska Native
Place of birth - Born in other state (%) - Multirace
Place of birth - Born in other state (%) - Other Race
Place of birth - Native, outside of US (%)
Place of birth - Native, outside of US (%) - White
Place of birth - Native, outside of US (%) - Black or African American
Place of birth - Native, outside of US (%) - Asian
Place of birth - Native, outside of US (%) - Hispanic or Latino
Place of birth - Native, outside of US (%) - American Indian and Alaska Native
Place of birth - Native, outside of US (%) - Multirace
Place of birth - Native, outside of US (%) - Other Race
Place of birth - Foreign born (%)
Place of birth - Foreign born (%) - White
Place of birth - Foreign born (%) - Black or African American
Place of birth - Foreign born (%) - Asian
Place of birth - Foreign born (%) - Hispanic or Latino
Place of birth - Foreign born (%) - American Indian and Alaska Native
Place of birth - Foreign born (%) - Multirace
Place of birth - Foreign born (%) - Other Race
Residents speaking English at home (%)
Residents speaking English at home - Born in the United States (%)
Residents speaking English at home - Native, born elsewhere (%)
Residents speaking English at home - Foreign born (%)
Residents speaking Spanish at home (%)
Residents speaking Spanish at home - Born in the United States (%)
Residents speaking Spanish at home - Native, born elsewhere (%)
Residents speaking Spanish at home - Foreign born (%)
Residents speaking other language at home (%)
Residents speaking other language at home - Born in the United States (%)
Residents speaking other language at home - Native, born elsewhere (%)
Residents speaking other language at home - Foreign born (%)
Marital status - Never married (%)
Marital status - Now married (%)
Marital status - Separated (%)
Marital status - Widowed (%)
Marital status - Divorced (%)
Ancestries Reported - Arab (%)
Ancestries Reported - Czech (%)
Ancestries Reported - Danish (%)
Ancestries Reported - Dutch (%)
Ancestries Reported - English (%)
Ancestries Reported - French (%)
Ancestries Reported - French Canadian (%)
Ancestries Reported - German (%)
Ancestries Reported - Greek (%)
Ancestries Reported - Hungarian (%)
Ancestries Reported - Irish (%)
Ancestries Reported - Italian (%)
Ancestries Reported - Lithuanian (%)
Ancestries Reported - Norwegian (%)
Ancestries Reported - Polish (%)
Ancestries Reported - Portuguese (%)
Ancestries Reported - Russian (%)
Ancestries Reported - Scotch-Irish (%)
Ancestries Reported - Scottish (%)
Ancestries Reported - Slovak (%)
Ancestries Reported - Subsaharan African (%)
Ancestries Reported - Swedish (%)
Ancestries Reported - Swiss (%)
Ancestries Reported - Ukrainian (%)
Ancestries Reported - United States (%)
Ancestries Reported - Welsh (%)
Ancestries Reported - West Indian (%)
Ancestries Reported - Other (%)
Geographical mobility - Same house 1 year ago (%)
Geographical mobility - Same house 1 year ago (%) - White
Geographical mobility - Same house 1 year ago (%) - Black or African American
Geographical mobility - Same house 1 year ago (%) - Asian
Geographical mobility - Same house 1 year ago (%) - Hispanic or Latino
Geographical mobility - Same house 1 year ago (%) - American Indian and Alaska Native
Geographical mobility - Same house 1 year ago (%) - Multirace
Geographical mobility - Same house 1 year ago (%) - Other Race
Geographical mobility - Moved within same county (%)
Geographical mobility - Moved within same county (%) - White
Geographical mobility - Moved within same county (%) - Black or African American
Geographical mobility - Moved within same county (%) - Asian
Geographical mobility - Moved within same county (%) - Hispanic or Latino
Geographical mobility - Moved within same county (%) - American Indian and Alaska Native
Geographical mobility - Moved within same county (%) - Multirace
Geographical mobility - Moved within same county (%) - Other Race
Geographical mobility - Moved from different county within same state (%)
Geographical mobility - Moved from different county within same state (%) - White
Geographical mobility - Moved from different county within same state (%) - Black or African American
Geographical mobility - Moved from different county within same state (%) - Asian
Geographical mobility - Moved from different county within same state (%) - Hispanic or Latino
Geographical mobility - Moved from different county within same state (%) - American Indian and Alaska Native
Geographical mobility - Moved from different county within same state (%) - Multirace
Geographical mobility - Moved from different county within same state (%) - Other Race
Geographical mobility - Moved from different state (%)
Geographical mobility - Moved from different state (%) - White
Geographical mobility - Moved from different state (%) - Black or African American
Geographical mobility - Moved from different state (%) - Asian
Geographical mobility - Moved from different state (%) - Hispanic or Latino
Geographical mobility - Moved from different state (%) - American Indian and Alaska Native
Geographical mobility - Moved from different state (%) - Multirace
Geographical mobility - Moved from different state (%) - Other Race
Geographical mobility - Moved from abroad (%)
Geographical mobility - Moved from abroad (%) - White
Geographical mobility - Moved from abroad (%) - Black or African American
Geographical mobility - Moved from abroad (%) - Asian
Geographical mobility - Moved from abroad (%) - Hispanic or Latino
Geographical mobility - Moved from abroad (%) - American Indian and Alaska Native
Geographical mobility - Moved from abroad (%) - Multirace
Geographical mobility - Moved from abroad (%) - Other Race
Place of birth for the foreign-born population - Ireland (%)
Place of birth for the foreign-born population - Denmark (%)
Place of birth for the foreign-born population - Norway (%)
Place of birth for the foreign-born population - Sweden (%)
Place of birth for the foreign-born population - United Kingdom (%)
Place of birth for the foreign-born population - England (%)
Place of birth for the foreign-born population - Scotland (%)
Place of birth for the foreign-born population - Other Northern Europe (%)
Place of birth for the foreign-born population - Austria (%)
Place of birth for the foreign-born population - Belgium (%)
Place of birth for the foreign-born population - France (%)
Place of birth for the foreign-born population - Germany (%)
Place of birth for the foreign-born population - Netherlands (%)
Place of birth for the foreign-born population - Switzerland (%)
Place of birth for the foreign-born population - Other Western Europe (%)
Place of birth for the foreign-born population - Greece (%)
Place of birth for the foreign-born population - Italy (%)
Place of birth for the foreign-born population - Portugal (%)
Place of birth for the foreign-born population - Spain (%)
Place of birth for the foreign-born population - Other Southern Europe (%)
Place of birth for the foreign-born population - Albania (%)
Place of birth for the foreign-born population - Belarus (%)
Place of birth for the foreign-born population - Bosnia and Herzegovina (%)
Place of birth for the foreign-born population - Bulgaria (%)
Place of birth for the foreign-born population - Croatia (%)
Place of birth for the foreign-born population - Czechoslovakia (%)
Place of birth for the foreign-born population - Hungary (%)
Place of birth for the foreign-born population - Latvia (%)
Place of birth for the foreign-born population - Lithuania (%)
Place of birth for the foreign-born population - North Macedonia (Macedonia) (%)
Place of birth for the foreign-born population - Moldova (%)
Place of birth for the foreign-born population - Poland (%)
Place of birth for the foreign-born population - Romania (%)
Place of birth for the foreign-born population - Russia (%)
Place of birth for the foreign-born population - Serbia (%)
Place of birth for the foreign-born population - Ukraine (%)
Place of birth for the foreign-born population - Other Eastern Europe (%)
Place of birth for the foreign-born population - China (%)
Place of birth for the foreign-born population - Hong Kong (%)
Place of birth for the foreign-born population - Taiwan (%)
Place of birth for the foreign-born population - Japan (%)
Place of birth for the foreign-born population - Korea (%)
Place of birth for the foreign-born population - Other Eastern Asia (%)
Place of birth for the foreign-born population - Afghanistan (%)
Place of birth for the foreign-born population - Bangladesh (%)
Place of birth for the foreign-born population - India (%)
Place of birth for the foreign-born population - Iran (%)
Place of birth for the foreign-born population - Kazakhstan (%)
Place of birth for the foreign-born population - Nepal (%)
Place of birth for the foreign-born population - Pakistan (%)
Place of birth for the foreign-born population - Sri Lanka (%)
Place of birth for the foreign-born population - Uzbekistan (%)
Place of birth for the foreign-born population - Other South Central Asia (%)
Place of birth for the foreign-born population - Burma (%)
Place of birth for the foreign-born population - Cambodia (%)
Place of birth for the foreign-born population - Indonesia (%)
Place of birth for the foreign-born population - Laos (%)
Place of birth for the foreign-born population - Malaysia (%)
Place of birth for the foreign-born population - Philippines (%)
Place of birth for the foreign-born population - Singapore (%)
Place of birth for the foreign-born population - Thailand (%)
Place of birth for the foreign-born population - Vietnam (%)
Place of birth for the foreign-born population - Other South Eastern Asia (%)
Place of birth for the foreign-born population - Armenia (%)
Place of birth for the foreign-born population - Iraq (%)
Place of birth for the foreign-born population - Israel (%)
Place of birth for the foreign-born population - Jordan (%)
Place of birth for the foreign-born population - Kuwait (%)
Place of birth for the foreign-born population - Lebanon (%)
Place of birth for the foreign-born population - Saudi Arabia (%)
Place of birth for the foreign-born population - Syria (%)
Place of birth for the foreign-born population - Turkey (%)
Place of birth for the foreign-born population - Yemen (%)
Place of birth for the foreign-born population - Other Western Asia (%)
Place of birth for the foreign-born population - Eritrea (%)
Place of birth for the foreign-born population - Ethiopia (%)
Place of birth for the foreign-born population - Kenya (%)
Place of birth for the foreign-born population - Somalia (%)
Place of birth for the foreign-born population - Uganda (%)
Place of birth for the foreign-born population - Zimbabwe (%)
Place of birth for the foreign-born population - Other Eastern Africa (%)
Place of birth for the foreign-born population - Cameroon (%)
Place of birth for the foreign-born population - Congo (%)
Place of birth for the foreign-born population - Democratic Republic of Congo (Zaire) (%)
Place of birth for the foreign-born population - Other Middle Africa (%)
Place of birth for the foreign-born population - Egypt (%)
Place of birth for the foreign-born population - Morocco (%)
Place of birth for the foreign-born population - Sudan (%)
Place of birth for the foreign-born population - Other Northern Africa (%)
Place of birth for the foreign-born population - South Africa (%)
Place of birth for the foreign-born population - Other Southern Africa (%)
Place of birth for the foreign-born population - Cabo Verde (%)
Place of birth for the foreign-born population - Ghana (%)
Place of birth for the foreign-born population - Liberia (%)
Place of birth for the foreign-born population - Nigeria (%)
Place of birth for the foreign-born population - Senegal (%)
Place of birth for the foreign-born population - Sierra Leone (%)
Place of birth for the foreign-born population - Other Western Africa (%)
Place of birth for the foreign-born population - Australia (%)
Place of birth for the foreign-born population - New Zealand (%)
Place of birth for the foreign-born population - Fiji (%)
Place of birth for the foreign-born population - Micronesia (%)
Place of birth for the foreign-born population - Bahamas (%)
Place of birth for the foreign-born population - Barbados (%)
Place of birth for the foreign-born population - Cuba (%)
Place of birth for the foreign-born population - Dominica (%)
Place of birth for the foreign-born population - Dominican Republic (%)
Place of birth for the foreign-born population - Grenada (%)
Place of birth for the foreign-born population - Haiti (%)
Place of birth for the foreign-born population - Jamaica (%)
Place of birth for the foreign-born population - St. Vincent and the Grenadines (%)
Place of birth for the foreign-born population - Trinidad and Tobago (%)
Place of birth for the foreign-born population - West Indies (%)
Place of birth for the foreign-born population - Other Caribbean (%)
Place of birth for the foreign-born population - Belize (%)
Place of birth for the foreign-born population - Costa Rica (%)
Place of birth for the foreign-born population - El Salvador (%)
Place of birth for the foreign-born population - Guatemala (%)
Place of birth for the foreign-born population - Honduras (%)
Place of birth for the foreign-born population - Mexico (%)
Place of birth for the foreign-born population - Nicaragua (%)
Place of birth for the foreign-born population - Panama (%)
Place of birth for the foreign-born population - Other Central America (%)
Place of birth for the foreign-born population - Argentina (%)
Place of birth for the foreign-born population - Bolivia (%)
Place of birth for the foreign-born population - Brazil (%)
Place of birth for the foreign-born population - Chile (%)
Place of birth for the foreign-born population - Colombia (%)
Place of birth for the foreign-born population - Ecuador (%)
Place of birth for the foreign-born population - Guyana (%)
Place of birth for the foreign-born population - Peru (%)
Place of birth for the foreign-born population - Uruguay (%)
Place of birth for the foreign-born population - Venezuela (%)
Place of birth for the foreign-born population - Other South America (%)
Place of birth for the foreign-born population - Canada (%)
Place of birth for the foreign-born population - Other Northern America (%)
Place of birth for the foreign-born population - Other (%)
Latest news about races in Davie, FL collected exclusively by city-data.com from local newspapers, TV, and radio stations
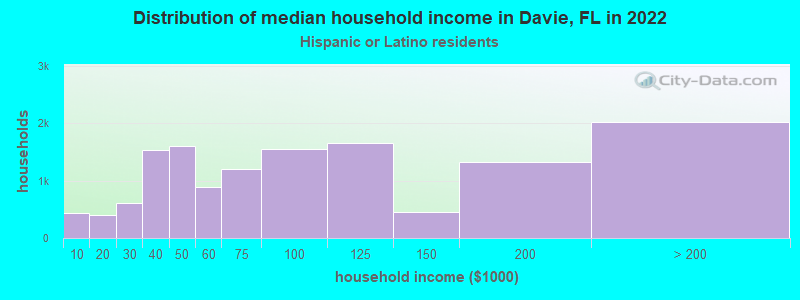
According to 2022 data, the most numerous races in Davie, FL are White alone (43,853 residents), Hispanic (42,925 residents), and Black alone (9,597 residents). 55.9% of Davie residents speak English at home. 34.5% of Davie, FL residents are foreign-born (23.4% born in Latin America, 4.7% born in Asia), which is 39.1% greater than the foreign-born rate of 21.0% across the entire state of Florida.
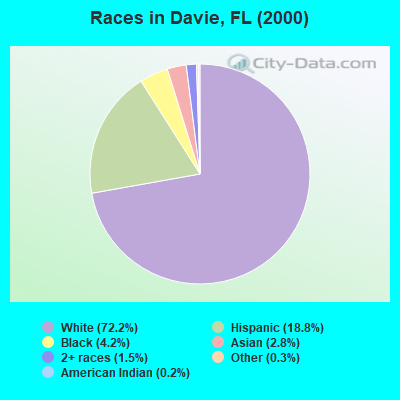
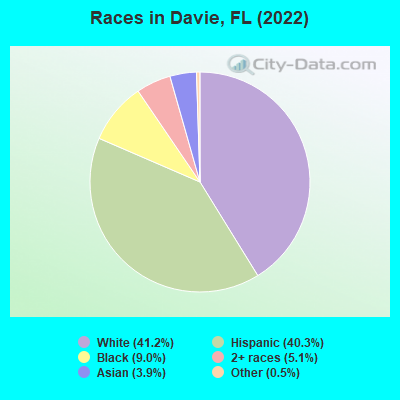
Race distribution in Davie
2000 2022
54,676 72.2% White alone 14,270 18.8% Hispanic 3,207 4.2% Black alone 2,087 2.8% Asian alone 1,105 1.5% Two or more races 206 0.3% Other race alone 144 0.2% American Indian alone 25 0.03% Native Hawaiian and Other
43,853 41.2% White alone 42,925 40.3% Hispanic 9,597 9.0% Black alone 5,416 5.1% Two or more races 4,187 3.9% Asian alone 510 0.5% Other race alone
2000 2022
10,458,509 65.4% White alone 2,682,715 16.8% Hispanic 2,264,268 14.2% Black alone 261,693 1.6% Asian alone 236,954 1.5% Two or more races 42,358 0.3% American Indian alone 28,994 0.2% Other race alone 6,887 0.04% Native Hawaiian and Other
11,309,403 50.8% White alone 6,025,039 27.1% Hispanic 3,241,015 14.6% Black alone 861,630 3.9% Two or more races 623,692 2.8% Asian alone 152,054 0.7% Other race alone 22,504 0.1% American Indian alone 9,486 0.04% Native Hawaiian and Other
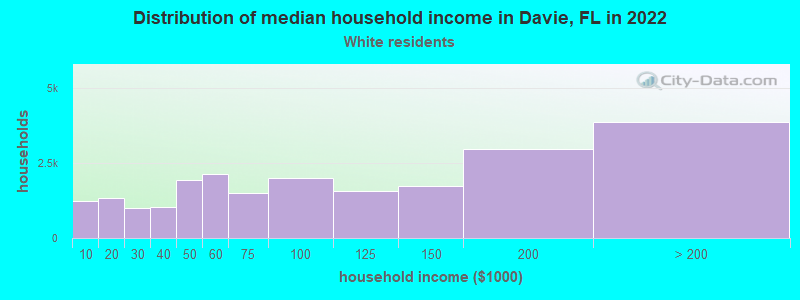
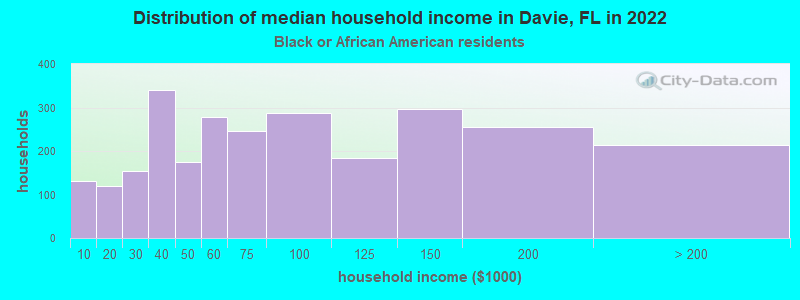
Income and house value in Davie Median household income in 2022 $94,188 White non-Hispanic householders$61,200 Black householders$96,373 Asian householders$34,264 Some other race householders$88,150 Two or more races householders$75,863 Hispanic or Latino race householdersMedian 2022 house value $633,157 White Non-Hispanic householders$633,985 Black or African American householders$368,548 American Indian or Alaska Native householders $690,717 Asian householders$460,892 Some other race householders$677,465 Two or more races householders$591,747 Hispanic or Latino householders
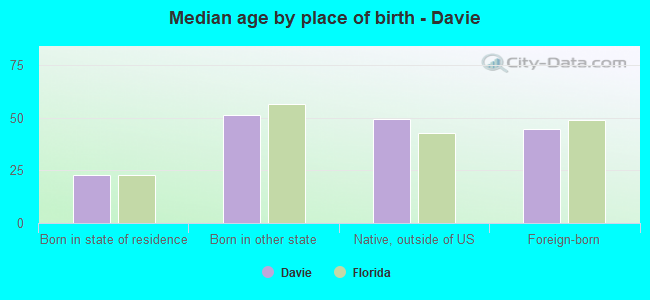
Median age by race in Davie
44.2 Median age for White residents41.3 45.3 30.4 Median age for Black or African American residents38.8 25.3 -666,666,666.0 Median age for American Indian / Alaska Native residents-666,666,666.0 -666,666,666.0 37.7 Median age for Asian residents29.8 40.4 -666,666,666.0 Median age for Native Hawaiian / Pacific Islander residents-666,666,666.0 -666,666,666.0 37.3 Median age for Other race residents36.5 42.3 36.5 Median age for Two or more races residents33.8 37.6 44.6 Median age for White alone residents42.5 45.1 37.0 Median age for Hispanic or Latino residents35.1 39.1
Owner/renter occupied households by race in Davie
House owners and renters - White residents 16,401 73.6% Owner occupied5,888 26.4% Renter occupiedHouse owners and renters - Black or African American residents 912 28.5% Owner occupied2,288 71.5% Renter occupiedHouse owners and renters - American Indian / Alaska Native residents 71 100.0% Renter occupiedHouse owners and renters - Asian residents 911 67.3% Owner occupied443 32.7% Renter occupiedHouse owners and renters - Other race residents 1,112 59.2% Owner occupied766 40.8% Renter occupiedHouse owners and renters - Two or more races residents 6,045 63.7% Owner occupied3,444 36.3% Renter occupiedHouse owners and renters - White alone residents 14,160 76.3% Owner occupied4,398 23.7% Renter occupiedHouse owners and renters - Hispanic or Latino residents 8,626 63.1% Owner occupied5,055 36.9% Renter occupied
Language usage in Davie
English speakers - Total 55.9% of residents of Davie speak English at home.
33.0% of residents speak Spanish at home 18,577 55.1% Speak English very well15,113 44.9% Speak English less than very well11.1% of residents speak other language at home 7,783 68.8% Speak English very well3,524 31.2% Speak English less than very well
English speakers - Born in the United States 86.7% of residents of Davie speak English at home.
11.4% of residents speak Spanish at home 2,936 98.6% Speak English very well42 1.4% Speak English less than very well1.9% of residents speak other language at home 452 90.2% Speak English very well49 9.8% Speak English less than very well
English speakers - Native, born elsewhere 12.0% of residents of Davie speak English at home.
84.2% of residents speak Spanish at home 1,458 67.9% Speak English very well688 32.1% Speak English less than very well3.8% of residents speak other language at home 96 100.0% Speak English very well
English speakers - Foreign-born 13.9% of residents of Davie speak English at home.
61.9% of residents speak Spanish at home 9,446 42.1% Speak English very well12,969 57.9% Speak English less than very well24.2% of residents speak other language at home 5,573 63.6% Speak English very well3,190 36.4% Speak English less than very well
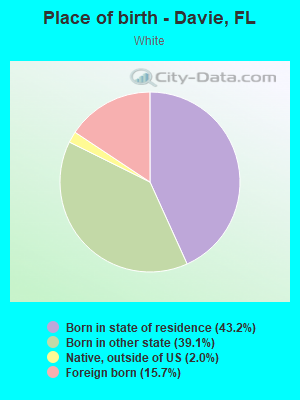
White (Caucasian) - Speak only English Native:
86.8% (36,537)Foreign-born:
23.0% (1,901)
White (Caucasian) - Speak another language Native:
13.2% (5,536)Foreign-born:
77.0% (6,350)
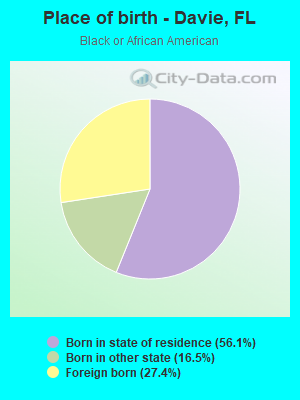
Black or African American - Speak only English Native:
93.7% (4,206)Foreign-born:
49.9% (1,288)
Black or African American - Speak another language Native:
6.7% (300)Foreign-born:
50.0% (1,292)
Asian - Speak only English Native:
34.5% (493)Foreign-born:
22.5% (549)
Asian - Speak another language Native:
65.5% (936)Foreign-born:
77.5% (1,886)
Other race - Speak only English Native:
36.8% (594)Foreign-born:
7.1% (283)
Other race - Speak another language Native:
63.2% (1,018)Foreign-born:
92.9% (3,719)
Two or more races - Speak only English Native:
56.8% (7,871)Foreign-born:
6.1% (1,151)
Two or more races - Speak another language Native:
43.2% (5,976)Foreign-born:
93.9% (17,733)
White alone - Speak only English Native:
92.6% (33,927)Foreign-born:
32.9% (1,796)
White alone - Speak another language Native:
7.4% (2,714)Foreign-born:
67.1% (3,660)
Hispanic or Latino - Speak only English Native:
46.6% (8,337)Foreign-born:
3.5% (813)
Hispanic or Latino - Speak another language Native:
53.4% (9,536)Foreign-born:
96.5% (22,152)
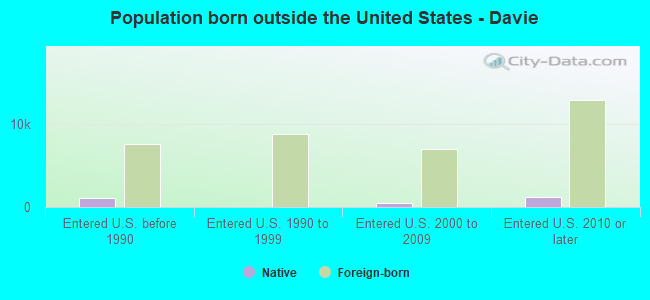
Foreign-born residents in Davie 36,582 residents are foreign born (23.4% Latin America , 4.7% Asia ).
This city:
34.5%Florida:
21.1%
Marital status for residents in Davie Marital status - White (Caucasian) population 15 years and over
Males 34.0% Never married47.5% Now married3.7% Separated2.9% Widowed11.9% DivorcedFemales 29.7% Never married46.6% Now married3.8% Separated8.4% Widowed11.4% DivorcedWomen who gave birth in the past 12 months Now married:
100.0% (178)Unmarried:
0.0% (0)
Women who did not give birth in the past 12 months Now married:
44.4% (5,564)Unmarried:
55.6% (6,974)
Marital status - Black or African American population 15 years and over
Males 40.7% Never married42.1% Now married1.9% Separated5.7% Widowed9.6% DivorcedFemales 60.4% Never married28.5% Now married0.0% Separated3.7% Widowed7.4% DivorcedWomen who gave birth in the past 12 months Now married:
32.8% (85)Unmarried:
67.2% (174)
Women who did not give birth in the past 12 months Now married:
27.4% (631)Unmarried:
72.6% (1,669)
Marital status - Asian population 15 years and over
Males 38.9% Never married54.0% Now married0.0% Separated5.0% Widowed2.1% DivorcedFemales 22.1% Never married63.1% Now married0.3% Separated9.8% Widowed4.7% DivorcedWomen who gave birth in the past 12 months Now married:
100.0% (72)Unmarried:
0.0% (0)
Women who did not give birth in the past 12 months Now married:
58.6% (1,082)Unmarried:
41.4% (765)
Marital status - Other race population 15 years and over
Males 43.4% Never married40.3% Now married5.7% Separated0.0% Widowed10.6% DivorcedFemales 37.1% Never married33.9% Now married2.1% Separated5.4% Widowed21.5% DivorcedWomen who gave birth in the past 12 months Now married:
80.9% (82)Unmarried:
19.1% (19)
Women who did not give birth in the past 12 months Now married:
28.0% (696)Unmarried:
72.0% (1,787)
Marital status - Two or more races population 15 years and over
Males 36.3% Never married51.1% Now married4.9% Separated0.3% Widowed7.3% DivorcedFemales 35.4% Never married51.0% Now married1.5% Separated6.7% Widowed5.5% DivorcedWomen who gave birth in the past 12 months Now married:
62.1% (242)Unmarried:
37.9% (148)
Women who did not give birth in the past 12 months Now married:
47.2% (3,925)Unmarried:
52.8% (4,382)
Marital status - White alone, not Hispanic / Latino population 15 years and over
Males 31.5% Never married48.3% Now married2.5% Separated3.5% Widowed14.2% DivorcedFemales 31.8% Never married46.6% Now married2.6% Separated8.1% Widowed10.9% DivorcedWomen who gave birth in the past 12 months Now married:
100.0% (178)Unmarried:
0.0% (0)
Women who did not give birth in the past 12 months Now married:
45.8% (4,925)Unmarried:
54.2% (5,829)
Marital status - Hispanic or Latino population 15 years and over
Males 35.3% Never married52.8% Now married6.2% Separated0.1% Widowed5.5% DivorcedFemales 30.5% Never married50.6% Now married3.4% Separated6.6% Widowed9.0% DivorcedWomen who gave birth in the past 12 months Now married:
71.8% (377)Unmarried:
28.2% (148)
Women who did not give birth in the past 12 months Now married:
44.8% (4,424)Unmarried:
55.2% (5,452)
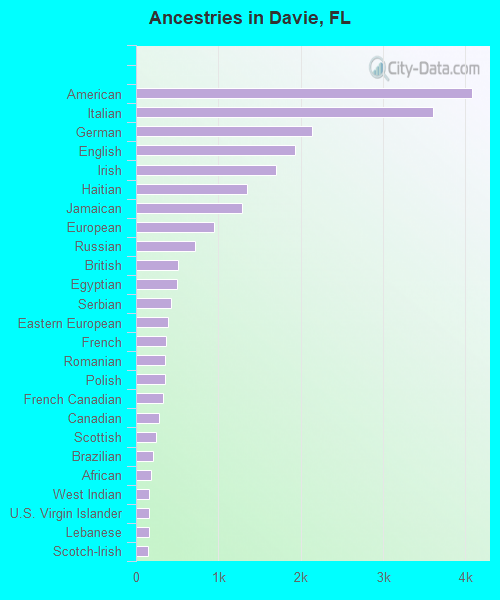
Ancestries in Davie
4,083 6.3% American3,612 5.5% Italian2,137 3.3% German1,931 3.0% English1,705 2.6% Irish1,353 2.1% Haitian1,284 2.0% Jamaican951 1.5% European720 1.1% Russian506 0.8% British493 0.8% Egyptian429 0.7% Serbian386 0.6% Eastern European363 0.6% French351 0.5% Romanian348 0.5% Polish332 0.5% French Canadian276 0.4% Canadian241 0.4% Scottish204 0.3% Brazilian178 0.3% African160 0.2% West Indian159 0.2% U.S. Virgin Islander157 0.2% Lebanese148 0.2% Scotch-Irish143 0.2% Israeli123 0.2% Dutch119 0.2% Ukrainian118 0.2% Hungarian103 0.2% Slovak102 0.2% Turkish99 0.2% Slovene95 0.1% Swedish89 0.1% Kenyan73 0.1% Northern European70 0.1% Portuguese70 0.1% Greek66 0.1% Bulgarian65 0.10% South African62 0.10% Lithuanian61 0.09% Croatian58 0.09% Moroccan58 0.09% Norwegian55 0.08% Trinidadian and Tobagonian46 0.07% Nigerian44 0.07% Pennsylvania German42 0.06% Guyanese32 0.05% Czechoslovakian31 0.05% Australian27 0.04% Armenian23 0.04% Estonian20 0.03% Ghanaian19 0.03% Iraqi17 0.03% Basque16 0.02% Czech15 0.02% Austrian13 0.02% Belgian13 0.02% Scandinavian13 0.02% Syrian13 0.02% Jordanian11 0.02% Bahamian10 0.02% Maltese9 0.01% Welsh6 0.01% Bermudan
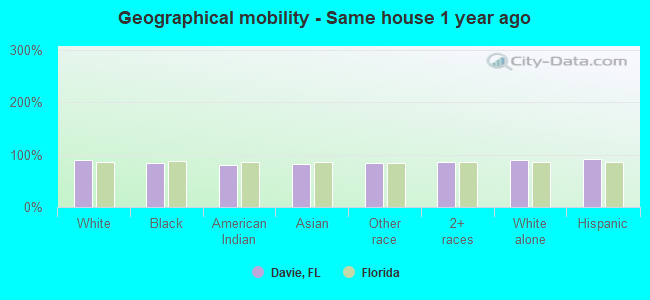
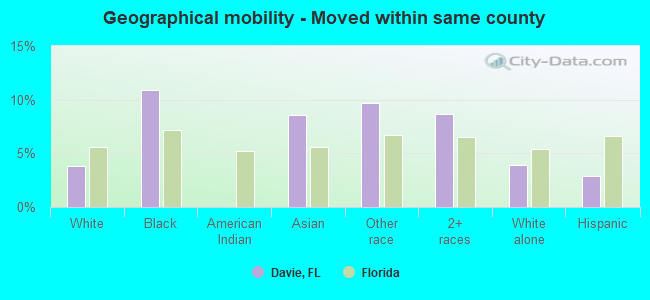
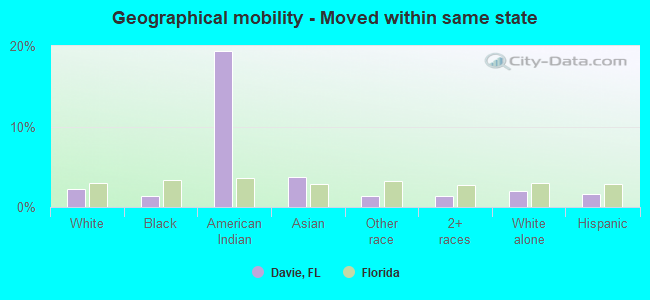
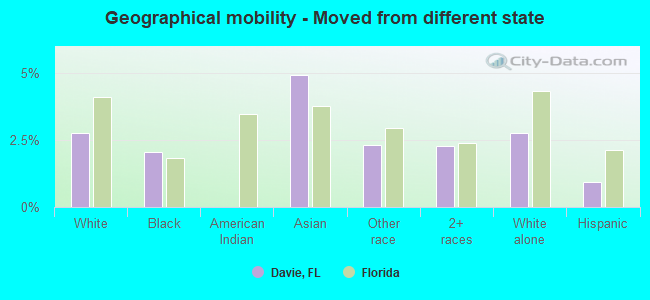
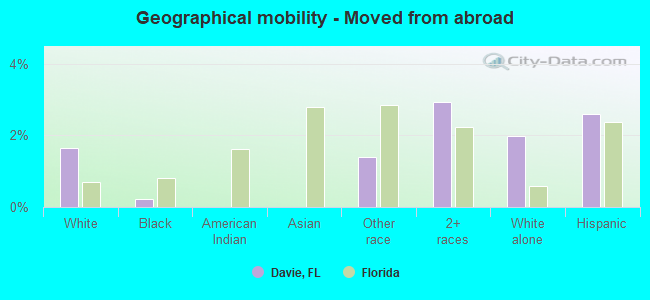
Geographical mobility in Davie Same house 1 year ago 46,703 89.6% White (Caucasian)6,189 84.1% Black or African American212 80.0% American Indian / Alaska Native5,661 82.9% Asian8,134 84.6% Other race28,169 84.9% Two or more races38,750 89.3% White alone, not Hispanic / Latino39,221 91.9% Hispanic or LatinoMoved within same county 1,982 3.8% White / Caucasian803 10.9% Black or African American585 8.6% Asian935 9.7% Other race2,870 8.7% Two or more races1,685 3.9% White alone, not Hispanic / Latino1,224 2.9% Hispanic or LatinoMoved within same state 1,150 2.2% White / Caucasian98 1.3% Black or African American51 19.4% American Indian / Alaska Native255 3.7% Asian131 1.4% Other race458 1.4% Two or more races884 2.0% White alone, not Hispanic / Latino712 1.7% Hispanic or LatinoMoved from different state 1,435 2.8% White / Caucasian152 2.1% Black or African American337 4.9% Asian223 2.3% Other race758 2.3% Two or more races1,200 2.8% White alone, not Hispanic / Latino394 0.9% Hispanic or LatinoMoved from abroad 858 1.6% White17 0.2% Black or African American135 1.4% Other race969 2.9% Two or more races858 2.0% White alone, not Hispanic / Latino1,110 2.6% Hispanic or Latino
Children Nativity (place of birth) in Davie
Children under 6 years - Living with two parents Both parents native 1,956 100.0% NativeBoth parents foreign-born 1,418 93.8% Native93 6.2% Foreign-bornOne native, one foreign-born parent 976 100.0% NativeChildren under 6 years - Living with one parent Native parent 716 100.0% NativeForeign-born parent 258 100.0% NativeChildren 6 to 17 years - Living with two parents Both parents native 2,935 100.0% NativeBoth parents foreign-born 4,267 76.9% Native1,284 23.1% Foreign-bornOne native, one foreign-born parent 3,295 100.0% NativeChildren 6 to 17 years - Living with one parent Native parent 3,103 100.0% NativeForeign-born parent 1,050 57.1% Native788 42.9% Foreign-born
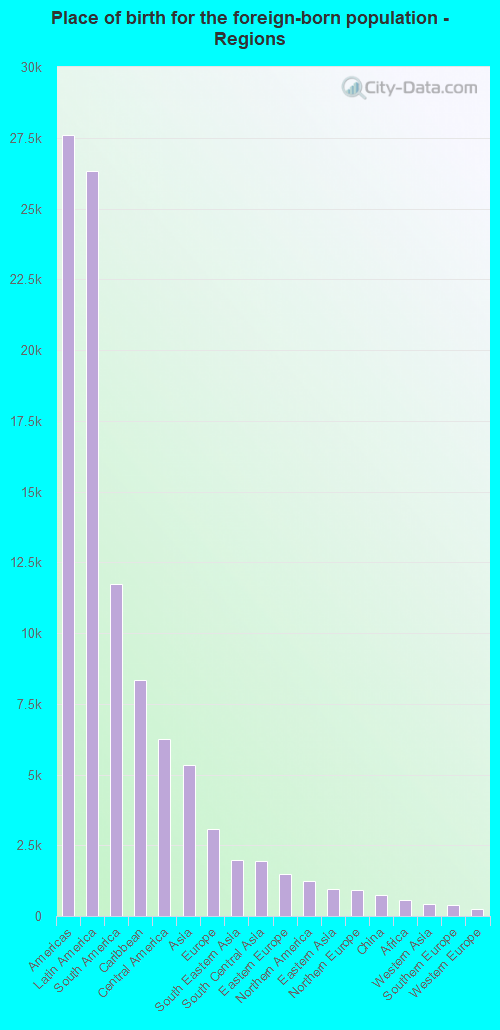
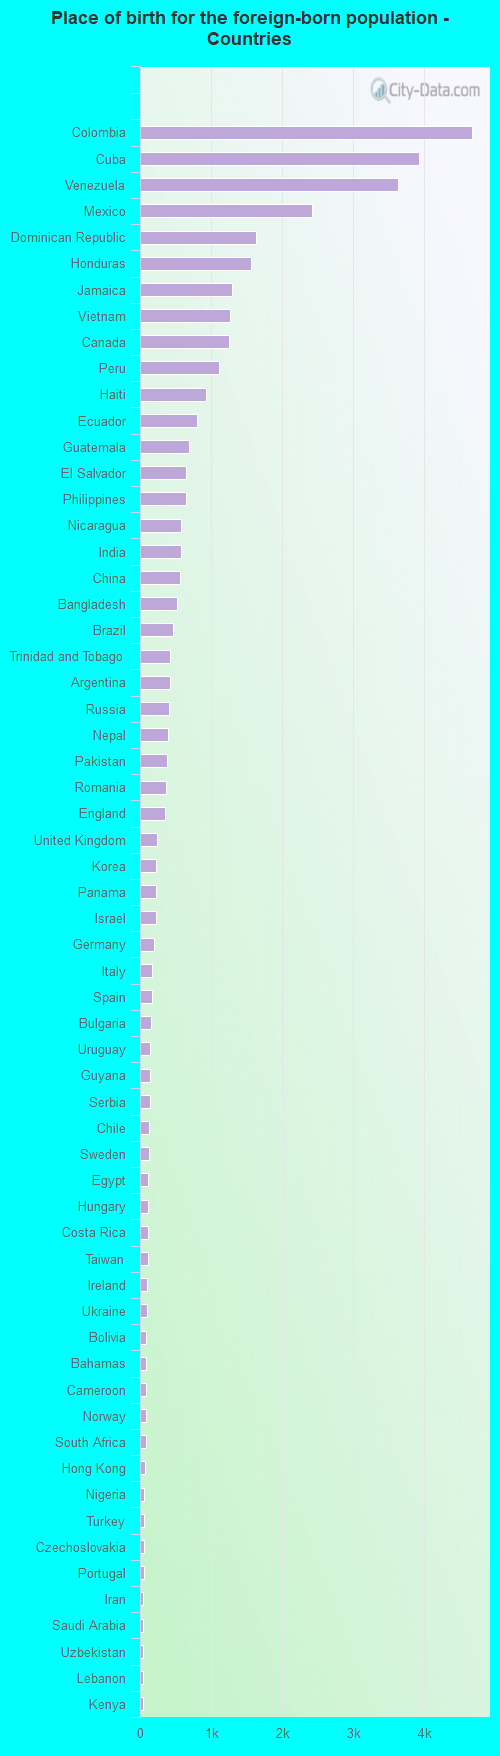
Place of birth for residents in Davie 27,589 Americas26,336 Latin America11,741 South America8,343 Caribbean6,250 Central America5,326 Asia3,082 Europe1,987 South Eastern Asia1,961 South Central Asia1,493 Eastern Europe1,253 Northern America970 Eastern Asia926 Northern Europe738 China549 Africa407 Western Asia405 Southern Europe257 Western Europe128 Eastern Africa125 Western Africa119 Northern Africa90 Middle Africa86 Southern Africa34 Oceania34 Australia and New Zealand Subregion4,675 Colombia3,921 Cuba3,623 Venezuela2,426 Mexico1,637 Dominican Republic1,562 Honduras1,300 Jamaica1,264 Vietnam1,247 Canada1,113 Peru926 Haiti804 Ecuador683 Guatemala653 El Salvador649 Philippines582 Nicaragua578 India564 China527 Bangladesh469 Brazil418 Trinidad and Tobago416 Argentina401 Russia387 Nepal376 Pakistan368 Romania350 England234 United Kingdom231 Korea231 Panama229 Israel203 Germany174 Italy167 Spain150 Bulgaria147 Uruguay137 Guyana137 Serbia128 Chile127 Sweden119 Egypt116 Hungary109 Costa Rica108 Taiwan99 Ireland94 Ukraine91 Bolivia90 Bahamas90 Cameroon87 Norway86 South Africa65 Hong Kong62 Nigeria56 Turkey56 Czechoslovakia55 Portugal48 Iran48 Saudi Arabia43 Uzbekistan43 Lebanon43 Kenya37 Uganda35 Malaysia34 Moldova34 Australia32 Ghana29 Togo28 Croatia25 Scotland25 Netherlands25 Belarus23 Poland18 Burma (Myanmar)17 Zimbabwe15 France14 Jordan13 Iraq12 Austria12 Thailand7 Cambodia7 Greece7 Lithuania3 West Indies
Grandparents responsible for own grandchildren in Davie
Grandparents (30 to 59 years) White / Caucasian 118 35.4% Responsible for grandchildren216 64.6% Not responsible for grandchildrenBlack or African American 124 100.0% Not responsible for grandchildrenOther race 31 100.0% Not responsible for grandchildrenTwo or more races 280 100.0% Not responsible for grandchildrenWhite alone, not Hispanic / Latino 96 46.3% Responsible for grandchildren111 53.7% Not responsible for grandchildrenHispanic or Latino 98 20.2% Responsible for grandchildren388 79.8% Not responsible for grandchildrenGrandparents (60 years and over) White / Caucasian 130 23.7% Responsible for grandchildren418 76.3% Not responsible for grandchildrenBlack or African American 7 21.3% Responsible for grandchildren27 78.7% Not responsible for grandchildrenOther race 37 100.0% Not responsible for grandchildrenTwo or more races 87 54.0% Responsible for grandchildren74 46.0% Not responsible for grandchildrenWhite alone, not Hispanic / Latino 149 30.7% Responsible for grandchildren336 69.3% Not responsible for grandchildrenHispanic or Latino 39 11.5% Responsible for grandchildren302 88.5% Not responsible for grandchildren